


Services on Demand
Journal
Article
 English (pdf)
 Article in xml format
 Article references
 Send this article by e-mail
Indicators
-
 Cited by SciELO
 -
 Access statistics
Related links
-
 Cited by Google
 -
 Similars in
SciELO
Similars in
SciELO -
 Similars in Google
Share

 Permalink
CT&F - Ciencia, Tecnología y Futuro
Print version ISSN 0122-5383On-line version ISSN 2382-4581
C.T.F Cienc. Tecnol. Futuro vol.3 no.4 Bucaramanga Jan./Dec. 2008
1Ecopetrol S.A.-Instituto Colombiano del Petróleo, A.A. 4185 Bucaramanga, Santander, Colombia
2Universidad Industrial de Santander (UIS), Bucaramanga, Santander, Colombia
3Ecopetrol S.A.-Reservoir Management, Bogotá, Cundinamarca, Colombia
e-mail: edwin.rodriguez@ecopetrol.com.co
(Received May 11, 2006; Accepted Nov. 11, 2008)
* To whom correspondence may be addressed
ABSTRACT
This article presents the methodology used and the results obtained in the construction, match and prediction of the first thermal composition simulation model done in Colombia by employing advanced thermal process commercial software, globally recognized because of its effectiveness in modeling these types of processes (CMG-STARS, 2005). The Santa Clara and Palermo fields were modeled and an excellent history match was achieved. All in all 28 wells and 17 years of production were matched.
Two production scenes were proposed. The first involved primary production from existing wells, in other words: primary production; and a second escen where all the wells in the field are converted into injectors and producers, to simulate cyclic steam injection. This injection process included a series of sensitivity studies for several of the parameters involved in this technology, such as: pressure and temperature injection, time and rate of injection, heat injected, soaking period, steam quality, and injection cycles. This sensitivity study was focused on optimizing the processes to obtain the maximum end recovery possible.
The information entered into the simulator was validated by laboratory tests developed at the Instituto Colombiano del Petróleo (ICP). Among the tests performed the following were assessed: rock compressibility, relative permeability curve behavior at different temperatures, formation sensitivity to injection fluids, DRX analysis and residual saturation of crude oil for steam injection. The aforementioned results are documented in this paper.
Key words: cyclic steam injection, Santa Clara field, numerical simulation, sensitivity analysis, laboratory test.
RESUMEN
Este artículo presenta la metodología empleada y los resultados obtenidos de la construcción, ajuste y predicción del primer modelo de simulación composicional térmica hecho en el país, mediante el uso de un software comercial de procesos térmicos avanzados, el cual es reconocido a nivel mundial como la herramienta de mayor uso y efectividad en el modelamiento de este tipo de procesos (CMG, 2005). Los campos Santa Clara y Palermo fueron los modelados y el ajuste histórico logrado fue excelente, la producción de fluidos del campo ajustó en un 100% y para los pozos en un 97%. En total se ajustaron 28 pozos y 17 años de producción.
Se plantearon dos escenarios de producción. El primero de ellos en producción primaria de los pozos existentes; es decir: declinación normal del campo, y un segundo escenario en que todos los pozos del campo son convertidos en inyectores y productores, para simular un proceso de inyección cíclica de vapor. Este proceso de inyección incluyó una serie de sensibilidades de varios parámetros involucrados en esta tecnología como fueron: presión y temperatura de inyección, tiempo y tasa de inyección, calor inyectado, período de remojo, calidad del vapor, y ciclos de inyección. Esta sensibilización tuvo como fin la optimización del proceso para la obtención del máximo recobro final.
La información ingresada al simulador fue validada con pruebas de laboratorio desarrolladas en el Instituto Colombiano del Petróleo (ICP). Entre las pruebas realizadas se evaluaron: compresibilidad de la roca, comportamiento de las curvas de permeabilidad relativa a diferentes temperaturas, sensibilidad de la formación a los fluidos de inyección, análisis DRX y saturación residual de crudo a la inyección de vapor. Cuyos resultados fueron documentados en este artículo.
Palabras Clave: Inyección cíclica de vapor, campo Santa Clara, simulación numérica, análisis de sensibilidad, pruebas de laboratorio.
INTRODUCTION
During prior years, Ecopetrol S.A. developed a study of feasibility and selection of recovery methods for the fields at the Southern Regional Management (Saavedra, 2003), in order to identify the most technically convenient and economically feasible methods to be implemented at these fields. According to crude oil characteristics for the Santa Clara and Palermo fields, the methods selected were cyclic injection, continuous steam injection and polymer injection. Later studies showed steam injection as the best alternative to increase the recovery factor at Santa Clara field. These studies were supported by results obtained from analytical simulations and consulting from international consultants (Farouq, 2003).
The recovery factor for the Santa Clara field in the year 2005 was 9%, a very low recovery rate. Thus the technological challenge to implement new technologies to increase production to profitable levels and incorporate new proven reserves into the national market. Heavy crude oil fields are currently considered one of the most viable alternatives to fill the large national demand for fuel. It is there that the methods of improved recovery, such as cyclic steam injection become more important, since they are the most successful thermal recovery techniques and the most applicable worldwide (Prats, 1986). Thus in Colombia several fields are being steam injected in this way, namely Jazmín, Teca and Nare fields with very positive results.
This process injects steam into the reservoir, which transfers the heat to the original fluids and to the rock, creating a warming of the area which causes a reduction of oil viscosity, allowing it to flow towards the well and later to the surface. The process is comprised of three stages:
The injection stage: during this stage heat is supplied as steam to the producing formation, for several days or weeks according to the estimated requirements. The objective is to reduce crude oil viscosity surrounding the well, up to a determined distance. The time employed depends on the quantity of steam injected and the capacity of the equipment used in the project.
Soaking stage: after the injection period, the well is closed off to establish a homogenization of the heated area around the well.
Production stage: at this time, the well is opened and it begins to produce a great quantity of water at high temperature resulting from the condensation of the steam injected. The water production rate will begin diminishing little by little, while crude oil production increases. For this reason the response of the well to stimulation depends principally on the viscosity of the oil, the existing permeability, the radius heated, the initial reservoir pressure and heat losses.
The duration of this stimulation effect (cycle) depends mainly on the speed with which the fluids produced cool off the formation and the rate of energy loss to the adjacent formations, both in a vertical as well as in the lateral direction. With time, these factors will cause a decrease in oil production for cycles to be performed, since a temperature drop increases oil viscosity, halting the process when the least economically feasible rate is reached.
STATIC MODEL
A static reservoir model (figure 1) was developed using modeling software, integrating a structural, petro-physical and facies model. The model is a "nonorthoghonal corner point" model with a total of 210,490 cells (35, 97, 62 in directions I, J, K, respectively).
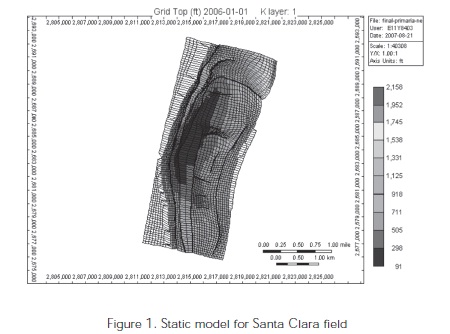
The absolute permeability values presented in the grid where estimated by using three formulas which included porosity values, and they vary according to three different types of rock, which were previously interpreted by means of petro-physical studies. These values were entered into Petrel in a LAS format and used for populating cell properties in the geo-statistical model. It included a facies model, where population of properties was done by keeping in mind the analysis performed to scale units for this reason. Some of the properties obtained by interpolation of petro-physical parameters were overwritten by the figures obtained through the facies analysis. The interpolation of petro physical values were generated foot by foot and then scaled to approximately 7 feet.
Geological description
Geologically the Santa Clara field is part of the Neiva subbasin, which encompasses part of the south basin of the Upper Magdalena Valley and corresponds to an elongated depression heading SW-NE, where there is a predominant system of bedding thrusts converging toward the East (Barrios et al., 2003). The structure of the field is defined as an asymetric elongated anticlinal whose main direction is north to south, with pitching both in the South as well as in the North. The anticlinal is 5,5 km long and 2,7 km wide. Figure 2 shows the structural model for the Santa Clara field (including the fault map) generated after interpreting its 3D seismic.
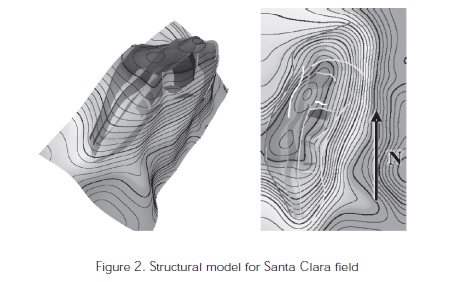
The western flank of the anticlinal limits with the Santa Clara fault. The eastern flank has its own closing. The structure of the field shows that the slope on the western flank is 6° less than the one to the East where it reaches 9°. From the Santa Clara fault several inverse sealing nature faults are derived (satellites) with a main orientation of SW-NE-E, generating several blocks within the field, thus controlling their fluid flow. There are 14 faults identified within the field.
Stratigraphic description
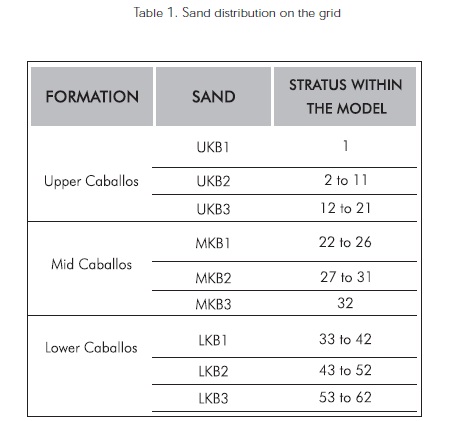
The producer formation in the Santa Clara field is known as the Caballos formation, and it has been commonly divided into three sub-formations. Upper, mid and lower Caballos. Upper Caballos (UKB), is the main producing reservoir at the Santa Clara field. It has a thickness between 120 and 150 feet. The Upper Caballos formation is subdivided stratigraphically into three units from top to base: UKB1, UKB2 (30-50 foot thickness), UKB3 (30-50 foot thickness). The Middle Caballos formation (MKB) has an average thickness of 120 feet and it is subdivided into three units, MKB, MKB1, MKB2. The Lower Caballos formation (LKB) rests conflictingly on the basement and is comprised of three stratigraphic units, LKB, LKB2, LKB3 with a total average thickness of 150 feet. Both the isopach maps, as well as those for net sand show a NW-SE orientation of the sandy bodies.
Table 1 shows a representation of the stratigraphic units within the static model. Units UKB and LKB represent the units with the greatest contribution to production at Santa Clara, while the MKB unit is a formation with more argillecaeous bodies, and is less productive.
Upper Caballos exhibits the best petrophysical properties in the reservoir with porosity between 16 and 20% and permeability between 100 and 300 md, initial water saturation at the reservoir was 22%. The field has a productive area of 752 acres and there is 40 to 60 acre spacing between wells.
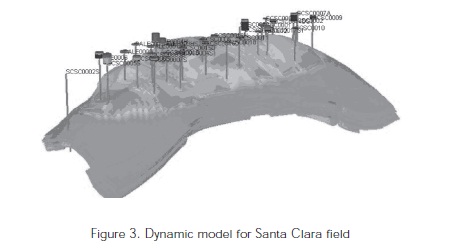
DYNAMIC MODEL
Once the static model was generated, it was exported to the simulator in order to develop the dynamic model which was integrated with rock fluid properties (relative permeability and capillary pressures), modeling and PVT property match , initialization conditions and well history.
Modelling of fluids
Crude oil at the Santa Clara field is a viscous oil (26-65cp), reservoir temperature 116°F (319,81 K), with an API gravity of nearly 18°. Bubble point pressure is close to 1100 psi. For modeling and adjustments, the last PVT data obtained for the field was employed (Barrios, 2004), based on this information, the modeling of the fluid properties was done in the fluid simulator. This allowed us to create a composition fluid and properties similar to the real scenario, adjusting it by means of a parametric regression and exporting its thermodynamic properties as equilibrium constants.
The composition of the original fluid characterized in the PVT Laboratory at the ICP was initially reduced to 11 components, without including water. Due to the numerical difficulties presented by the hardware to be able to perform the simulation processes, a new componet set was generated for three components (live oil system with three components: water, oil and gas). This end fluid model allowed us to balance the number of calculations and simulation time.
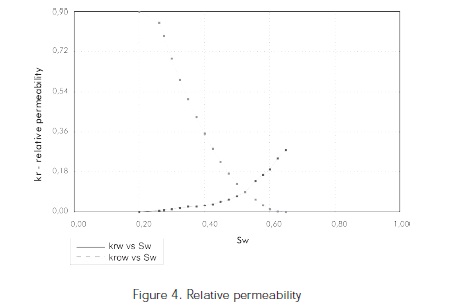
Relative permeabilities
A set of relative permeabilities were used from laboratory tests done on several samples (Amaya, 2004). For the reservoir having neutral wettability with a tendency to be oil wet, the residual oil saturation is 40%; but upon heating, it was observed that the value could decrease to 20%.
Initialization conditions
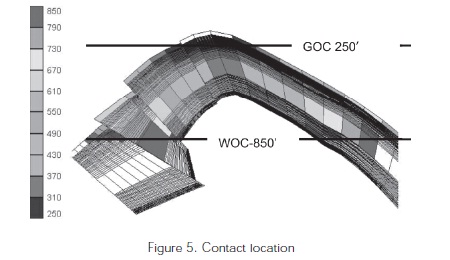
Initial pressure and depth conditions were estimated at 1217 psi and 600 ft - TVDSS. Original water oil contracts and gas oil contacts were estimated at 850 feet and 250 feet respectively; although these figures are presented with some degree of uncertainty, for this reason they were reviewed during the historical adjustment phase, bearing in mind that they directly affect the behavior of production and pressure in the field.
Initial fluids in the reservoir were the following:
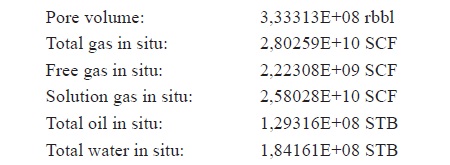
The Santa Clara field has been exploited since 1987 at its Caballos formation in three units: Upper Caballos, Middle Caballos and Lower Caballos; Upper Caballos being responsible for more than 90% of production. Production mechanisms are a layer of gas, gas solution and active partially aquifer drive. As of the year 2005 oil production topped 10,5 MMBBL, in other words an approximate recovery factor of 8,6%.
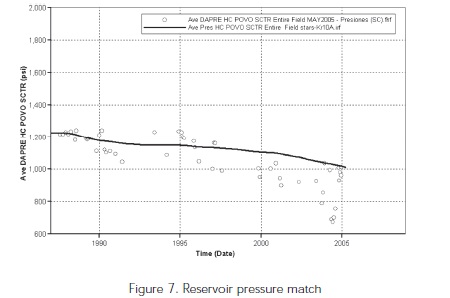
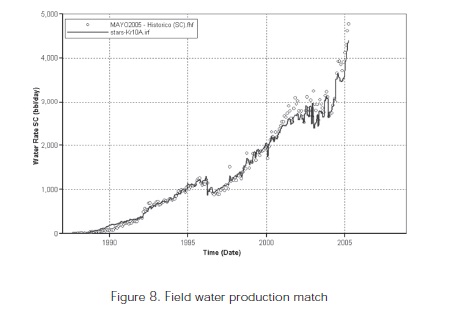
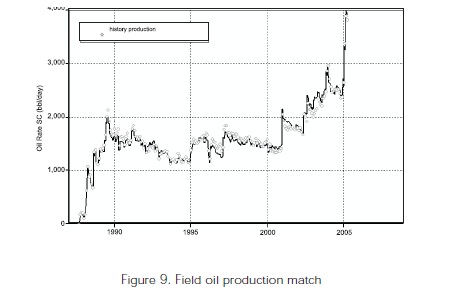
HISTORY MATCH
Once reservoir pore volume, static and dynamic reservoir models were integrated and validated, pressure and fluid production were adjusted in the field. It was decided that liquid rate would be used for history matching, since we were dealing with a field with large water production and active aquifer. By using this control, the aquifer restored pressure caused by well production. The match covered aquifer modeling, location of water oil contacts for each production unit, illumination of the isolated areas near the wells and handling of preferential waterflow channels within the reservoir.
Size and type of aquifer
After a profound analysis of the structure of the field, it was determined that the only way to guarantee pressure support for the upper area (UKB) of the reservoir was by means of a lateral aquifer connection. This was due to the existence of a shale seal that would not allow pressure support caused by the bottom aquifer (method in usually used) to affect the Upper Caballos unit. The aquifer was respresented by the Carter-Tracy model (infinite extension).
Location of contacts
Due to the initial water production behavior study at certain wells (for example: SC9) differences were observed between the real results and those of the simulator. In the case of SC9, the well was drilled initially to a depth of 1014 feet, bearing in mind the depth of the contact at 850 feet, it would be concluded that there are more than 150 feet of intervals drilled in water areas that would cause that the original water production be higher than the actual. For this reason, two different WOC contacts where placed for the units at Upper Caballos and Lower Caballos, dividing the reservoir into two initialization areas: Region one (Upper Caballos) with a contact at 870 feet and Region two (Caballos inferior) with a contact at 1025 feet.
To summarize, 19 years of production, at 28 wells were matched from the Santa Clara and Palermo fields. The results are shown in the following figures:
CYCLIC STEAM INJECTION
Laboratory tests
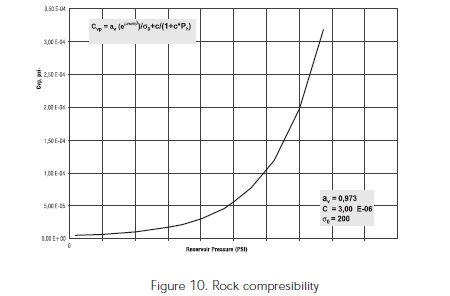
Once the best technology was defined for developing the Santa Clara field, steam injection started (Barrios, et al., 2003), several lab tests were designed and applied. These tests were carried out seeking to complete reservoir data necessary to numerically model these types of processes. Among the tests performed the following were assessed: ock compressibility, relative permeability curve behavior at different temperatures, formation sensitivity to injection fluids, DRX analysis and residual saturation of crude oil for steam injection.
Rock compresibility. CMS-300 equipment was used to calculate pore volume compresibility for the rock and runs were generated at various pressures, bearing in mind the confinement pressure and initial and end reservoir pressures. The results obtained were the following:
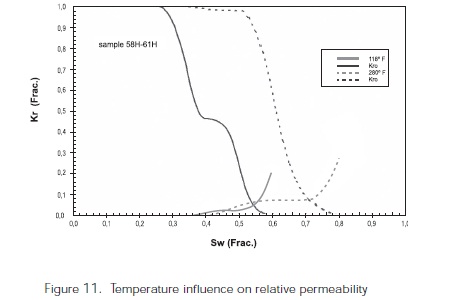
Relative permeability. Relative permeability curves were determined for three samples, at two different temperatures. Reservoir temperature 118°F (320,92 K) and steam injection temperature 280°F (420,92 K). The purpose of this study was to evaluate the influence of temperature on relative permeability of the fluids. The displacements were done on long composite samples, made up of two cores. The samples were grouped according to their air permeability. The resulting samples were placed in three different permeability ranges: low (~3 mD), medium (~86 mD) and high (~250 mD); corresponding to the three different types of rock at the reservoir.
The measurement method used was the water flooding technique, at a non-stable condition in restored samples. These samples were subjected to a wettability restoration process, after cleaning with solvents at 80°C (353,15 K).
The results obtained show that there is a significant influence on crude oil residual saturation. Residual saturation changes from ~40% at 118°F (320,92 K) to ~20% at 280°F (410,92 K). The effect on the shape of the curves is also noticeable. Crude oil effective of permeability increases and effective permeability to water reduces with increasing temperature.
Formation sensitivity. It is well known that the interactions between rock and different injected fluids may lead to a decrease in formation permeability for the regions and exposed to thermal injection. However, in steam injection processes an increase in permeability is produced because a dilation in the rock matrix is generated due to production of thermal changes.
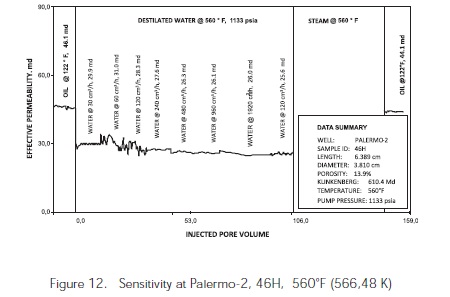
Throughout the study, cores were used from samples derived from Palermo-2 well, which were supplied by Hocol de Colombia Limited. Crude oil from Santa Clara 15 well, gas from Santa Clara -13, and production water from the Santa Clara-10 well and distilled water type I from Santa Clara 3 were used in tests.
It was seen that in all cores hot water was able to move at injection rates as high as 32,0 cm3/min, which is equivalent to a rate of 3,153 STB/D in the field, for a net petroleum pay of 60 feet. These high water flows assured steam injectivity at Santa Clara field.
Formation permeability remains constant during the two steam displacements, showing lesser changes in the amounts recorded, before and after the injection. As the figure shows:
On another front, based on the type 1 analysis on crude oil from five wells at Santa Clara field, it was possible to observe that there were no precipitation problems for paraffins since their fluid point is -24°C -11,2°F (249,15 K), which is a lower minimum temperature than that required for working conditions: More or less 26°C (299,15 K) or 80°F (299,81 K).
In the physical and chemical analysis it may be seen that there is a high content of bicarbonate ions at an average of 1450 ppm at all wells, which may precipitate as calcium carbonate by decreasing reservoir pressure. This would lead to the reduction of permeability for plugging.
The CO2 content in production water at the Santa Clara field, greater than 100 ppm at every well, may contribute to develope corrosion phenomena.
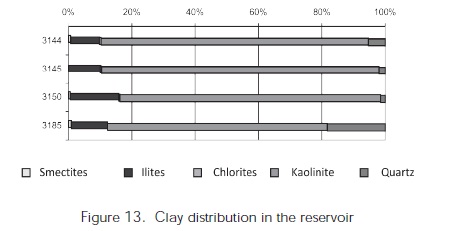
DRX Analysis. These tests were run showing that sands from Upper Caballos exhibit high concentration of quartz and low presence of clay minerals, some traces of pyrite and possible ferrous oxides.
The clay is basically kaolinite; ilite mica reaches nearly 10%, and there is a very low concentration of smectites, no higher than 1% of the lowest fraction of two micras. Microcrystaline Quartz is found in large portions in the deepest sample, where the presence of clays is minimal.
Residual oil saturation. The table shows residual oil saturation after flooding the formation at 300°F, 400°F and 560°F (422,03 K, 477,59 K and 566,48 K), respectively.
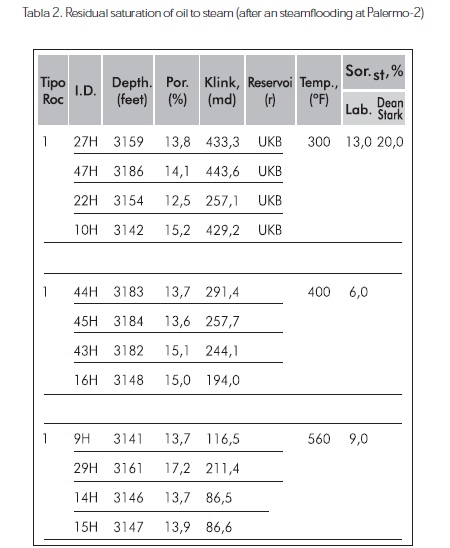
During displacements it was observed that residual crude oil saturation may be diminished from 40% to values around 13% and 6%, meanwhile a steam injection process is used.
Numerical Simulation
A cyclic injection process was simulated for the Santa Clara and Palermo fields, looking for the evaluation of the reservoir response to this recovery process. 30 wells were stimulated using sequential operations, starting in the South sector of the field.
Initial conditions for the injection process were schematized based on thermal projects, performed on similar fields, and supported by "analogy application for improved recovery processes" software (Soto, 2005).
- Injection pressure: 1250 psi
- Injection temperature: 572°F (573,15)
- Steam quality: 0,8
- Injection time: 15 days
- Soaking period: 3 days
- Injection rate: 1200 Bbls/day
- Mechanical conditions of the well: thermal cementing, thermal tubing
The last item assumes that all wells are mechanically adapted for steam injection. In other words, they have been completed with thermal cement and special tubing, this is true for the latest wells that have been drilled in the field. It is important to note that the first few wells would have to be reconditioned to support this process.
Once favorable results were observed for the first cyclic injection, sensitivity parameters were established in order to optimize the process and to obtain the best response from the reservoir.
Process sensitivity and optimization
Injection time-rate and injected heat. The injection rate was the first parameter evaluated. the thickness to be flooded area is considerable, especially for sloped and horizontal wells.
When defining to the injection rate, there are other parameters taken into account such as:
- Generator capacity
- Injection time
According to the literature (Farouq, 1983) and lessons learned from other similar projects, the minimum quantity of heat injected per foot has been established to vary between 50 - 80 MMBTU. Seeking to obtain the minimum production deferred and maximizing (maximize) generator work, all simulation calculations were based on using a 50 MM BTU/HR steam generator. This implies that steam injection conditions (pressure and temperature) were handled at a fixed daily injection rate of 3250 Bbls for every well in the field. The injection time for each well was also varied according to the formation thickness to be contacted.
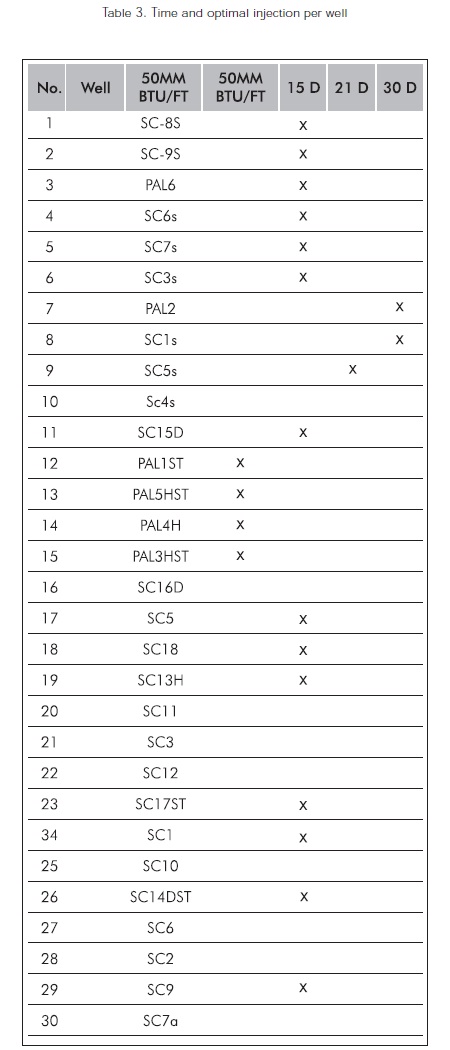
Bearing in mind the thickness for each of the wells, two sensitivities were proposed for injection: 50 MMBTU/FT and 80 MMBTU / FT, obtaining variable injection times, then running three more with set injection times for all wells of 15,21 and 30 days.
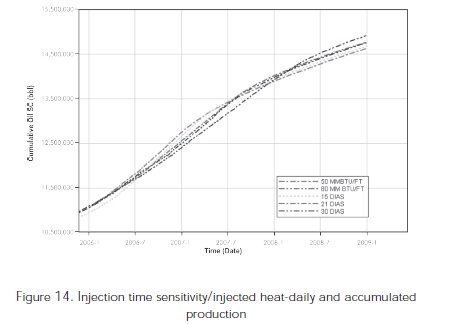
Production peaks fluctuate strongly with the heat injected and the injection time (Figure 14), each well has its own optimum injection period, and thus the importance of the sensitivities. Having performed sensitivities and analyzed daily production as well as accumulated field production, an injection time was defined for each well:
Injection pressure and temperature. At the beginning of the sensitivity studies it was necessary to evaluate under which probable scenario it would be possible to obtain better recovery, bearing in mind that the current reservoir pressure (800-1000 psi) was high. For this reason it was impossible to inject under these pressures. Likewise, injection pressures obtained during lab tests were used as a reference proving that it was possible to inject at high pressure, without causing serious damage to the formation in question.
- Steam was injected at 4 pressure values (900-1250- 1500-1700 psi)
The following are the results:
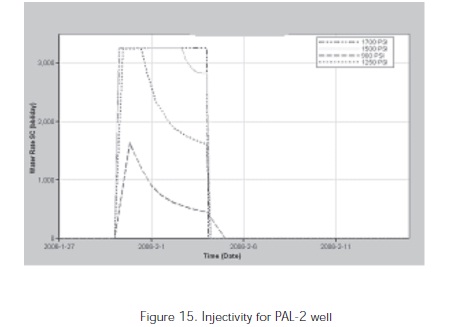
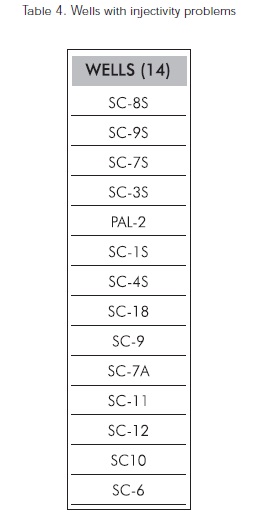
Injectivity was initially evaluated for each of the wells, observing that the higher the injection pressureas was expected, the lower the quantity of water and steam needed to flood the reservoir. It is concluded that the greater the injection pressure, the better injectivity for the Santa Clara and Palermo wells. It was observed that almost every well showed a favorable response above 1250 psi, but in general the majority presented injectivity problems, especially due to the high pressure of these wells and a high rate of injection being handled.
The following table summarizes the wells with injectivity problems:
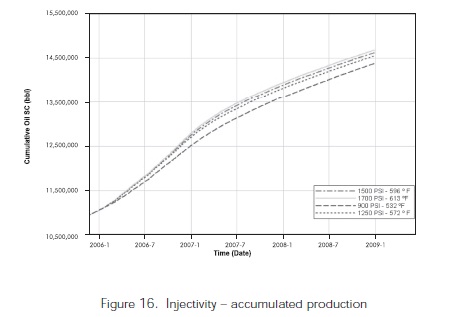
Likewise, it is possible to observe a favorable behavior in production when steam is injected at high pressures. However, in some wells the behavior was the same when injecting at 1250 psi or at 1700 psi.
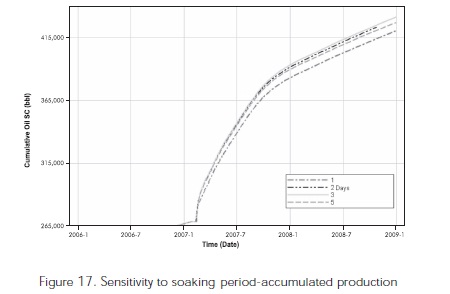
Soaking period. 1, 2, 3 and 5 day soaking sensitivities were performed, in order to observe its direct behavior on production. It was observed that the influence of this parameter on well behavior was the minimum. More than anything, this time span will depend mostly on the mechanical condition of the well and the time the operator takes to remove the injection string and place it in production. Nevertheless, some wells showed favorable behavior with longer times.
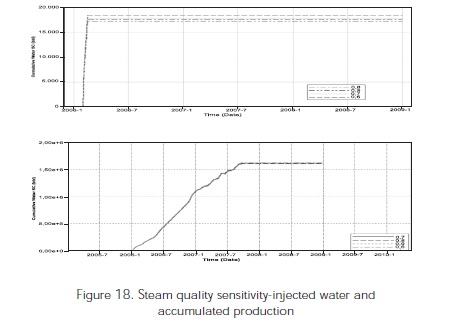
Steam quality. Sensitivities were performed at 0,6; 0,7; 0,8 and 0,9. A slight increase was observed in the daily production rate with increasing quality. For cumulative production, both for the field as well as for the wells, the increase was not considerable. Favorable behavior was observed in some wells showing better injectivity with lower quality.
INJECTION CYCLES
Once the injection process was optimized, the following operating conditions were established:
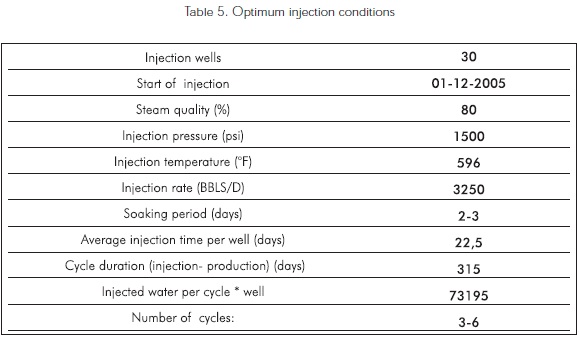
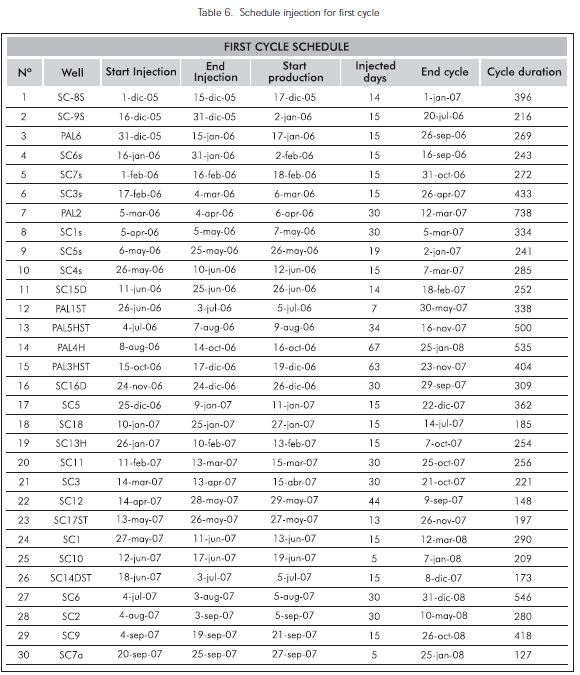
First injection cycle. The injection schedule was the following: this graph shows the sequential order for each well flooded with steam, the time lapse of the injection (starting and ending dates), date when it was put into production, duration of the cycle, in other words the period when it was first injected, it began to produce and reach the initial rate that it had before injection (cold production).
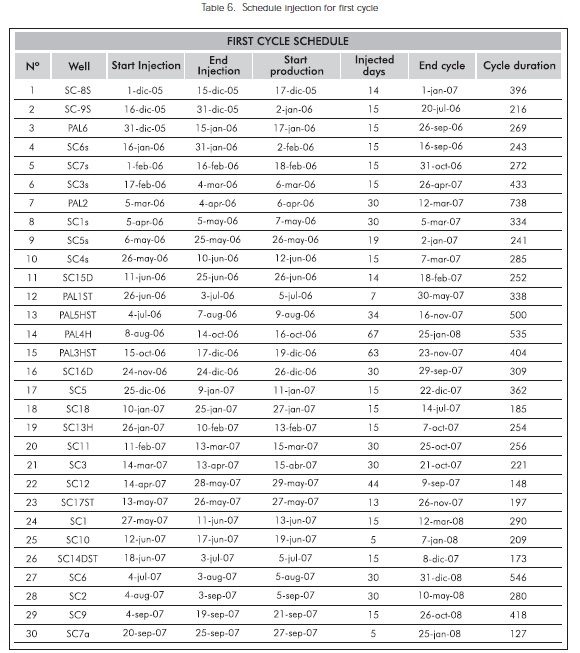
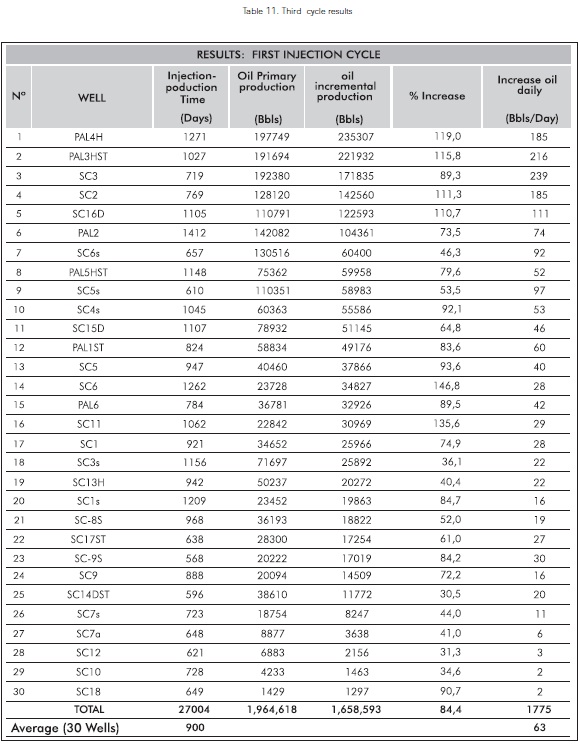
The above table shows the results obtained, showing oil produced during this period of time if there were steam injection and showing which will be the incremental production of the process. produced/steam injected ratio (equivalent barrels of water) was calculated for every well, since this is the main economic indicator for the project. Duration of the first cycle had an average of 314 days, fluctuating between 127-738 days. Steam was injected during 675 days, it was observed an increasing production of 583,000 Bbls, in other words an increase of 72% of production that would have had primary recovery in the field.
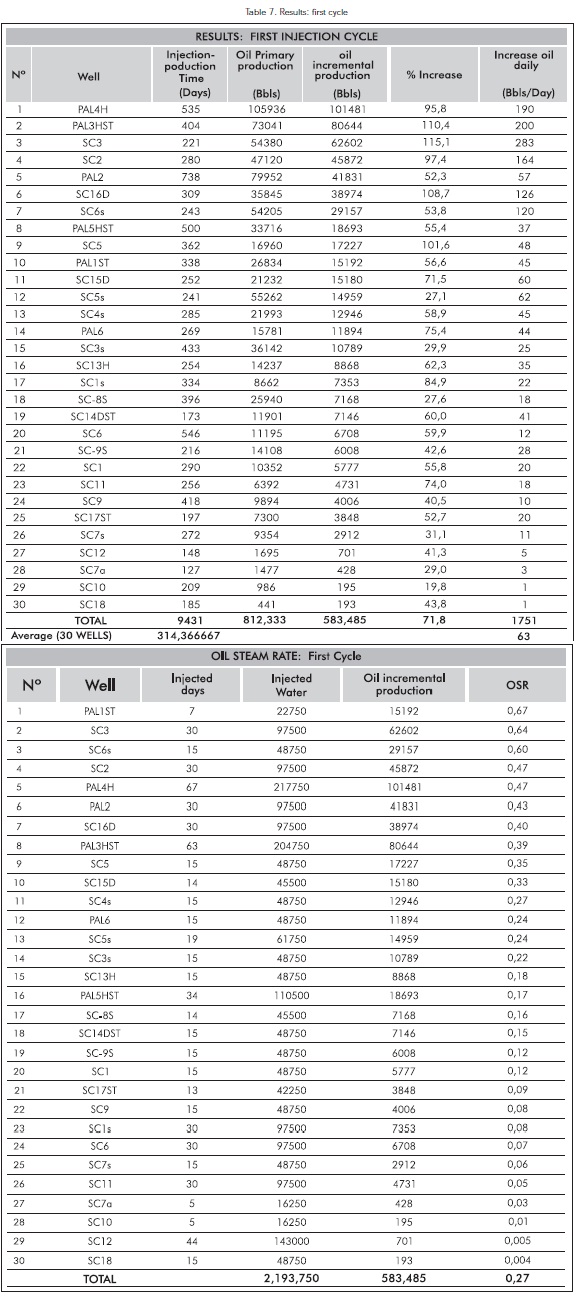
The average OSR for the wells was 0,27 and was higher than 0,5 in some wells. The percentage injectivity for this first cycle was 71% and injected energy on the average was 126 million BTU/FT.
Second injection cycle. The injection schedule is in Table 8:
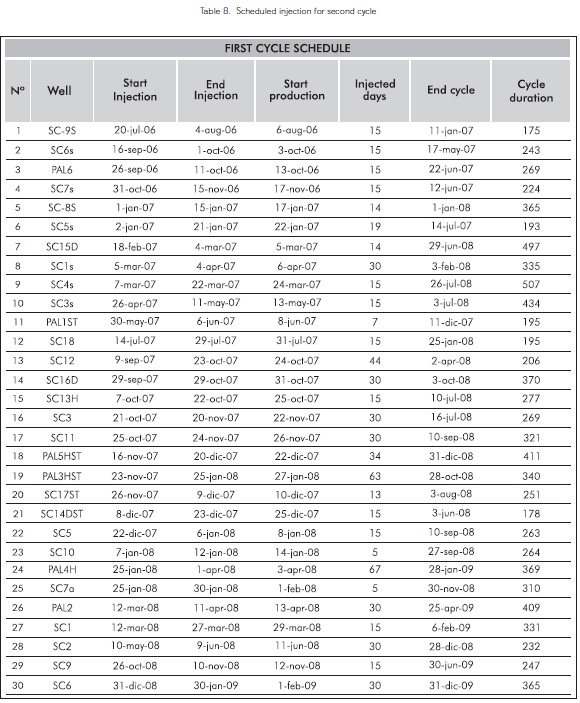
The top half of Table 8 shows the results for the second cycle. The bottom half of Table 9 shows the accumulated results (first and second cycles) obt ained:
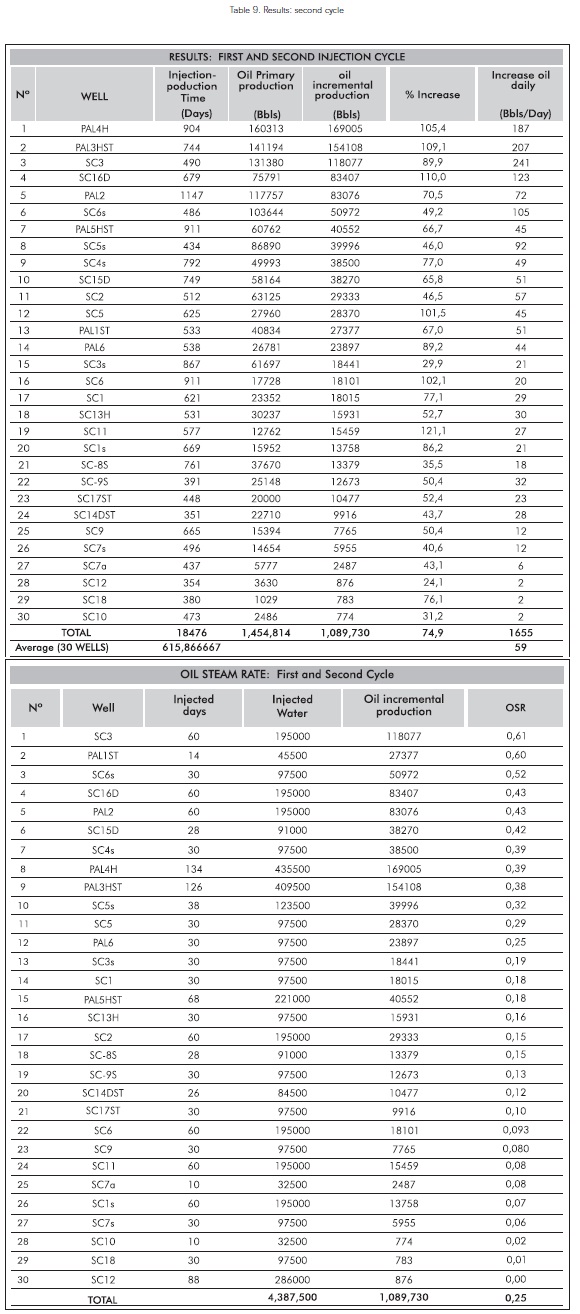
The duration of the second cycle had an average 302 days, fluctuating between 507-175 days, performing steam injection during 675 days. An increase in production(cycles 1 and 2) of 506,230 Bbls was observed and acumulative production reached 1,089,730 Bbls, in other words an increase of 75% of production that the field would have had in primary recovery. The average OSR for wells was 0,25, reaching higher than 0,5 in some wells. Percentage injectivity for this first cycle was 90% and injected energy on the average was 165 million BTU/FT.
Third injection cycle. The injection schedule is shown in Table 10.
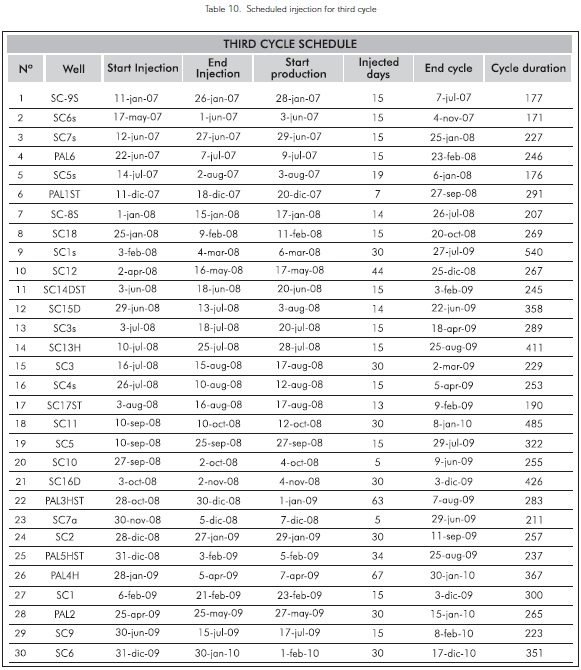
The top half of the table shows the accumulated results for all cycles.
CONCLUSIONS
-
A history for fluid production and pressure behavior was excellent, clearly representing the behavior of the reservoir.
-
The sensitivity for cyclic steam injection parameters for the 28 adjusted wells and the new SC-8S and SC-9S indicates a process of three injection cycles, one injection at 3250 Bbls/day and using an injection pressure of 1500 psi.
-
Reservoir response to steam injection is very favorable, showing a better response at the Palermo wells.
-
The ratio of oil produced to steam injected into the project was good, and it was within the expected range of 0,25 - 0,5.
-
It is estimated that for each steam injection cycle, an approximate 500,000 additional barrels of oil would be recovered as compared to cold production and by primary processes.
-
It was observed that reservoir injectivity improves as the number of cycles increase.
-
The lab tests showed a decrease in residual oil saturation due to steam displacement the values obtaining values between 13 and 6%.
-
Due to the estimated volumes to inject are so high and based on the probability from which the reservoir accept it at working conditions, it has been seen that this volume is much smaller than the one obtained in the laboratory, so it is advisable to previously evaluate in the field the optimal rate of injection by means of injectivity test.
ACKNOWLEDGMENTS
The authors wish to express their gratitude to Dr. Farouq Ali for his guidance and consulting provided for the project; we would also like to thank the technical personnel at Computer Modelling Group (CMG) -Venezuela, to the personnel of the Superintendencia de operaciones Huila-Tolima (SOH) to Reservoir Management (PYA) at Ecopetrol S.A. Lastly, we would like to thank the Grupo de Recobro Mejorado from the Universidad Industrial de Santander, Bucaramanga, Colombia.
REFERENCES
Amaya, C. H. (2004). Influencia de la temperatura en las permeabilidades relativas inyección de vapor Santa Clara. Informe de Laboratorio, Ecopetrol S.A. Instituto Colombiano del Petróleo (ICP). [ Links ]
Barrios, W., Páez, J. D., Gómez, M. P., Ordoñez, A., Saavedra, N. F., Pérez, E. R., Duarte, A., & Rondon, V. (2003). Screening EOR campos de la gerencia del alto Magdalena (GAM- ECP)- fase II. Evaluación Técnico Económica del Piloto de Inyección Cíclica de Vapor a Pozos del Campo Santa Clara. Ecopetrol S.A. [ Links ]
Barrios, W. (2004). Reporte PVT Santa Clara 13H. Reporte Interno, Ecopetrol S.A. - Instituto Colombiano del Petróleo (ICP). [ Links ]
Boberg, T. C. (1988) Thermal methods of oil recovery, John Wiley & Sons, New York. [ Links ]
CMG - Computer Modelling Group - (2005). Technical attendance in thermal composicional simulation, May. Ecopetrol S.A. [ Links ]
Farouq, Ali. (1983). Improve oil recovery IOCC. Oklahoma, USA. [ Links ]
Farouq, Ali. ( 2003). Evaluación preliminar de inyección de vapor (cíclica y contínua) campo Santa Clara, Informe Técnico, Agosto. Ecopetrol. S.A. [ Links ]
Prats, M. (1986). Thermal recovery. Monography of SPE AIME, Henry L. Doherty series (Vol. 7), New York. [ Links ]
Saavedra, N. F., & Pérez, E. R. (2003). Screening EOR fields of the management of the high Magdalena (Gam- Ecp)- Phase I. Final Report, Ecopetrol. S.A. [ Links ]
Soto, C. (2005). Aplicación de analogías para procesos de recobro mejorado Versión 1.2., Proyecto, Instituto Colombiano del Petróleo (ICP) y Universidad Industrial de Santander (UIS). [ Links ]

