


Services on Demand
Journal
Article
 English (pdf)
 Article in xml format
 Article references
 Send this article by e-mail
Indicators
-
 Cited by SciELO
 -
 Access statistics
Related links
-
 Cited by Google
 -
 Similars in
SciELO
Similars in
SciELO -
 Similars in Google
Share

 Permalink
CT&F - Ciencia, Tecnología y Futuro
Print version ISSN 0122-5383On-line version ISSN 2382-4581
C.T.F Cienc. Tecnol. Futuro vol.3 no.5 Bucaramanga Jan./Dec. 2009
MULTI-SOLID MODEL MODIFIED TO PREDICT PARAFFIN PRECIPITATION IN PETROLEUM FLUIDS AT HIGH TEMPERATURES AND PRESSURES
Juan-Carlos-M. Escobar-Remolina1*, Wilson Barrios-Ortiz1 and Gildardo Santoyo-Ramírez2
1 Ecopetrol S.A. - Superintendencia de Yacimientos, Bogotá, Colombia
2 Gems Ltda, Bucaramanga, Santander, Colombia
e-mail: juan.remolina@ecopetrol.com.co
(Received April 2, 2008; Accepted November 25, 2009)
* To whom correspondence may be addressed
ABSTRACT
A thermodynamic structure has been modified in order to calculate cloud point, fluidity and amount of precipitated wax under a wide range of temperature conditions, composition, and high pressures. The model is based on a combination of ideal solution concepts, fluid characterization, and formation of multiple solid phases using Cubic State Equations. The experimental data utilized for testing the prediction capacity and potentiality of a model exhibit different characteristics: continuous series synthetic systems of heavy alkanes, discontinuous series, and dead or living petroleum fluids with indefinite fractions such as C7+, C10+, C20+, and C30+. The samples were taken from the literature, petroleum fluids from the main Colombian reservoirs, and some samples of Bolivian fluids. Results presented in this paper show the minimum standard deviations between experimental data and data calculated with a model. This allows a progress in decision-making processes for flow assurance in reservoirs, wells, and surface facilities in the petroleum industry.
Keywords: multi-solid model, paraffin precipitation, high pressure and temperature, flow assurance.
RESUMEN
En el presente trabajo se ha modificado una estructura termodinámica para el cálculo del punto de nube, de fluidez y cantidad de cera precipitada en un amplio rango de condiciones de temperatura, composición y altas presiones. El modelo se fundamenta en una combinación de los conceptos de solución ideal, caracterización del fluido y de formación de fases sólidas múltiples empleando ecuaciones de estado cúbicas (EDEC). Los datos experimentales usados para probar la capacidad de predicción del modelo y su potencialidad tienen características variadas: sistemas sintéticos de series continúas de alcanos pesados, series discontinuas y fluidos del petróleo vivo y muerto con fracciones indefinidas como C7+, C10+, C20+, y C30+. Las muestras se tomaron de la literatura, fluidos de petróleos de los principales yacimientos Colombianos y algunas muestras de fluidos Bolivianos. Los resultados que se presentan en este trabajo muestran desviaciones mínimas entre los datos experimentales y los calculados con el modelo. Lo anterior permite por tanto, un avance en la toma de decisiones para aseguramiento del flujo en yacimiento, pozos y facilidades de superficie en la industria petrolera.
Palabras Clave: modelo multi-sólido, precipitación de parafinas, elevadas presiones y temperaturas, aseguramiento del flujo.
RESUMEN
No presente trabalho modificou se uma estrutura termodinámica para o cálculo do ponto de nuvem, de fluidez e quantidade de cera precipitada em uma ampla categoria de condiçóes de temperatura, composição e altas pressóes. O modelo fundamentase em uma combinação dos conceitos de solução ideal, caracterização do fluído e de formação de fases sólidas múltiplas empregando equaçóes de estado cúbicas (EDEC). Os dados experimentais usados para provarem a capacidade de predição do modelo e a sua potencialidade têm características variadas: sistemas sintéticos de séries contínuas de alcanos pesados, séries descontínuas e fluídos do petróleo vivo e morto com fraçóes indefinidas como C7+, C10+, C20+, e C30+. As amostras foram tomadas da literatura, fluídos de petróleos das principais jazidas Colombianas e algumas amostras de fluídos Bolivianos. Os resultados que se apresentam neste trabalho mostram desvios mínimos entre os dados experimentais e os calculados com o modelo. O anterior permite portanto, um avanço na toma de decisóes para asseguramento do fluxo em jazida, poços e facilidades de superfície na indústria petroleira.
Palavras Chave: modelo multisólido, precipitação de parafinas, elevadas pressóes e temperaturas, asseguramento do fluxo.
INTRODUCTION
Fluids produced from petroleum reservoirs contain paraffin compounds of high molecular weight. At low temperatures (and even at high temperatures), heavier paraffin molecules crystallize and block production pipes and surface lines. Furthermore, some paraffin molecules "precipitate" in the internal fluid mass and are transported in a suspended manner. Suspended particles increase apparent fluid viscosity, thus modifying flow properties in a dramatic manner. Therefore, the potential cost generated by paraffin deposits has become a standard for most of petroleum field studies. Precipitation of solids such as paraffin and asphaltene compounds represents an endless operational challenge at petroleum fields. Crude oil production fields are permanently affected by plugging at pipelines, well production lines and surface facilities. Both the reservoirs and the formation side that faces the bottom of the well reduce their flow capacity due to precipitation and further depositing of paraffin compounds and other solids. Paraffin precipitation (commonly referred to as waxes) is a problem present since several decades (Fagin, 1945; Ford, Ell, & Russell, 1965) although its strictly thermodynamic interpretation has been posed just recently (1980’s) (Hansen, Fredenslund, Pedersen, & Ronningsen, 1988; Reddy, 1986; Won, 1986). The two main forms for calculating the wax-liquid equilibrium are the solid solution (Won, 1986) or assuming a multisolid character, where pure solid compounds do not intermix (Lira-Galeana, Firoozabadi, & Prausnitz, 1996). These two concepts have generated a series of stages regarding paraffin precipitation thermodynamics and a large amount of models with their advantages, limitations, and assumptions (Reddy, 1986; Won, 1986; Erickson, Niesen, & Brown, 1993; Pedersen, 1993; Lira-Galena et al., 1996; Nichita et al., 2001; Hong-Yan et al., 2004; Escobar-Remolina, 2006).
Petroleum fluids contain paraffin waxes that precipitate as a solid phase when the temperature drops below the cloud point or Wax Precipitation Point (WPP). Evaluating the imminent possibility for wax deposit is a standard procedure of most studies in the development of petroleum fields and flow assurance (Gonzáles, Jamaluddin, Solbakken, Hirasaki, & Chapman, 2007). The simplest and most important property required to be known is WPP. WPP and the amount of precipitated wax evaluations are based on the measurement of dead oil (gas-free oil). This can lead to conservative estimations and potentially expensive solutions in flow lines transporting non-stabilized petroleum, particularly regarding insulation and decision making processes related to flow assurance. Therefore, highly reliable measurements of WPP, the amount of precipitated para-ffin and other properties in living oils are considered of great importance.
Wax precipitation data have been published for stable oils at atmospheric pressure (Ronningsen et al., 1991; Pedersen et al., 1991; Hansen, Larsen, Pedersen, & Nielsen, 1991; Dauphin, Daridon, Coutinho, Baylère, & Potin - Gautier, 1999; Pauly, Dauphin, &. Daridon, 1998). This data material has been used in the estimation of several thermodynamic model parameters related to paraffin precipitation (Lira-Galena et al., 1996; Vafaie - Safti, Mousavi-Dehghani, & Mohammad-Zadeh Bahar, 2000; Escobar-Remolina, 2006; Dalirsefat & Feyzi, 2007). Unforunately these data do not provide information regarding the effect of pressure and dissolved gas on wax formation conditions and posterior precipitation at high pressure and temperature values. Few studies reporting experimental data for living oils have been published recently (Ronningsen, Somme, & Pedersen. 1997; Pan et al., 1997; Martos et al., 2008).
The sections below present experimental data related to fluidity points, cloud points, and precipitated wax taken from the literature, petroleum fluids from the main Colombian reservoirs and some samples of Bolivian fluids of gas-free and living oils. These data have been used for the modification, improvement and testing the prediction capacity of a paraffin precipitation thermodynamic multi-solid model in petroleum fluids at high pressures and temperatures. (Lira-Galena et al., 1996; Escobar-Remolina, 2006).
OILS USED IN THE STUDY AND THEIR DATA
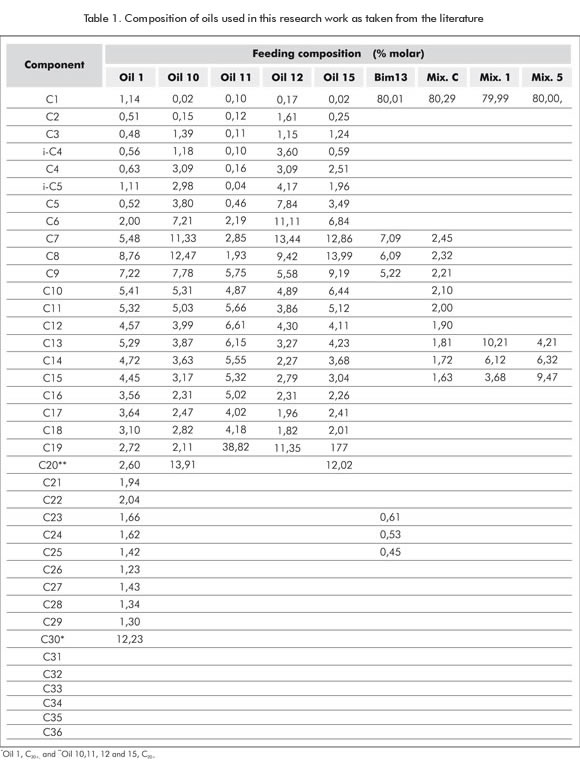
The nine oils shown in Table 1 are taken from the literature (Ronningsen et al., 1991; Pedersen et al., 1991; Hansen et al., 1991; Duaphin et al., 1999; Pauly et al., 1998). Experimental data regarding precipitated wax vs. temperature and WPP are available for these oils. All compositions include fluids without dissolved gas (dead oils). Table 1 also includes mixtures with significant content of C20+, C30+ fractions and discontinuous mixtures with pure components up to C36.
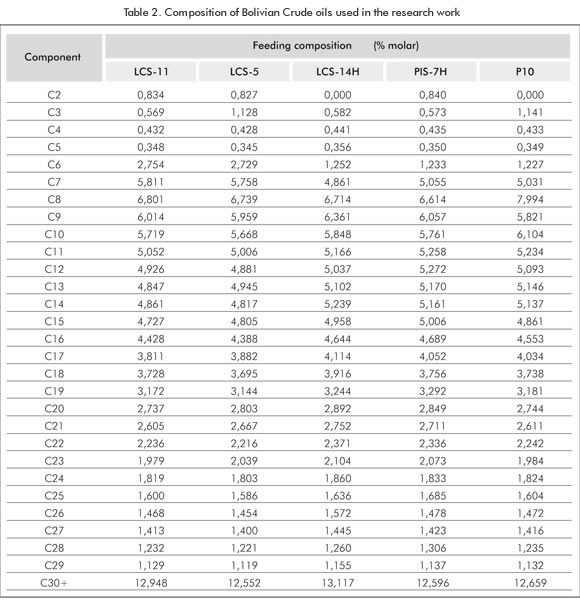
Table 2 shows the composition of 5 Bolivian reservoir crude oil fluids (% molar), analyzed in the ICP laboratory. Their composition, until the C30+ fraction, was found for these fluids by means of a simulated distillation. The values measured for all samples were: fluidity points (ASTM D 5853-95 Method), API gra-vity (ASTM D 287-92). The samples were submitted to rheological trials in order to detect the cloud point by viscometry.
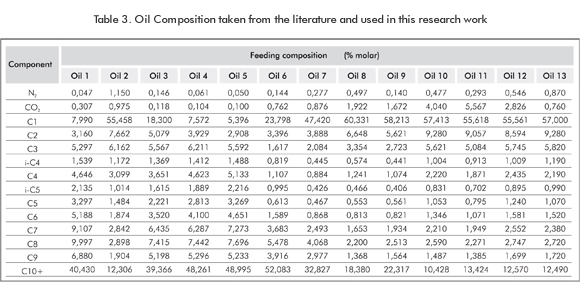
Table 3 shows the composition of 13 samples of living oil taken from the literature. (Ronningsen et al., 1997). Wax precipitation temperatures WPT are available for these samples and these values were measured at different saturation points and at dead crude oil conditions. Ronningsen et al., (1997) analyzed these 13 samples and compared their WPT of gas-free oils obtained with the filter method to the values measured by polarization microscopy. WPT measured are also compared to the wax deposit threshold values in a coaxial laboratory cell (rotating cell). It is found that WPT values are very well correlated to the deposit threshold in most cases.
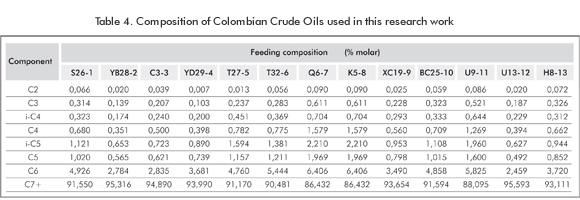
Table 4 shows 13 mixtures of Colombian crude oils as reported by Escobar and Peláez (2000). The composition up to the carbon C30+ was found through simulated distillation. Table 4 shows the grouped composition at C7+. The following values were determined for these samples: The Fluidity Point temperature (ASTM D 5853-95 Method) and API gravity (ASTM D 287-92) of the crude oil taken at the well’s head. In addition, the Cloud Point Temperature (WPT) was found using a microscope, Pedersen and Christensen (2007).
THERMODYNAMIC MODEL
This section considers the fundamental theoretical concepts regulating the solid-liquid-gas equilibrium that are the foundation of this paper. In addition, a characterization methodology is presented, and equations for the critical properties of substances and their fusion properties are developed. These values are required in the calculations using state cubic equations.
Theoretical concepts
From the stability criterion, it is defined that any component i can exist as a pure solid if it conforms to the following Equation 1:

Where fi (P,T,z) is the fugacity of the i component with zi feeding composition. At a fixed pressure and temperature for any i component, the multi-solid phase model must fulfil the following Equation 2:

In this paper, Equation 1 does not exactly determine the number and identity of precipitating pure solids, as in the original work (Lira - Galeana et al., 1996) and further publications (Pan et al., 1996; Vafaei - Sefti et al., 2000). Instead, a more continuous character is given to the solid precipitation process, as shown below: From Equations 1 and 2 and considering that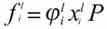 (definition of the liquid fugacity at a pressure P) and
 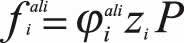 (definition of feeding fugacity), we obtain a function per each component denomineted: αis

Where φ refers to the fugacity coefficient and "x" and "z" refer to the liquid and feeding compositions, respectively. The first important characteristic of the above mentioned function is that its units are given in moles. As observed in the Equation 3, the calculation of the function value corresponding to each component requires the knowledge of xil y φil values. The following variables are obtained: the solid-liquid equili-brium constant, considering the equal fugacity values between a State Equation and an Activity Coefficient Model. This is defined as:

where f spuroi and φil are evaluated at the mixture temperature and pressure; γis ysi is the activity coefficient and the solid fraction, respectively. As it is assumed, pure solid (si=1) and ideality of the solid phase (γis=1), then γis si=1. This is called the complete immiscibility value for all species at solid state (Smith, Van Ness, & Abbott, 1996). From Equation 4 and the assumptions, it is obtained:

The following can be demonstrated through a thermodynamic cycle (Prausnitz, Lichtenthaler, & Azevedo 1986):
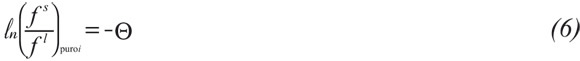
Where θ is equal to:
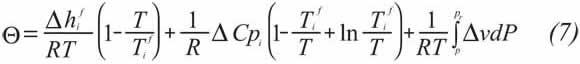
Considering f spuro,i = φlpuro,i P. Based on Equations 5, 6 and 7 it is obtained:
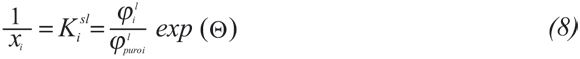
Equation 8 allows the calculation of the liquid composition and the fugacity component, xil and φil, by an iterative process. These values are replaced in Equation 3 and the values αis are determined for all the components whether precipitated or not. Finally, a simple material balance is conducted to establish concluding analogies with the αis function. For N components that can "potentially" form a solid, pure and inmiscible phase with each remaining component:

where L is the liquid fraction. A feeding mole is assu-med. The above mathematical scheme represents a continuous wax precipitation phenomenon, that is, it does not define a limit between precipitating and not precipitating components, as in the former multi-solid models. For instance, let us imagine a hydrocarbon mixture where operation conditions lead to precipitation of all components, and other mixture where only some of them form a solid phase. In both cases, Equations 3 and 9 (αis and si) give a real value, including zero (0), from the amount of precipitated substances. Based on the above, it is possible to assume that if (φil/ φiali) L then αis si.
Characterization of the heaviest fraction
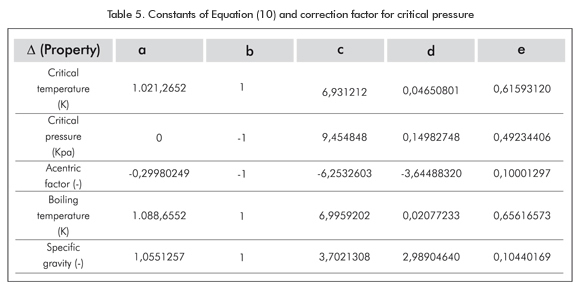
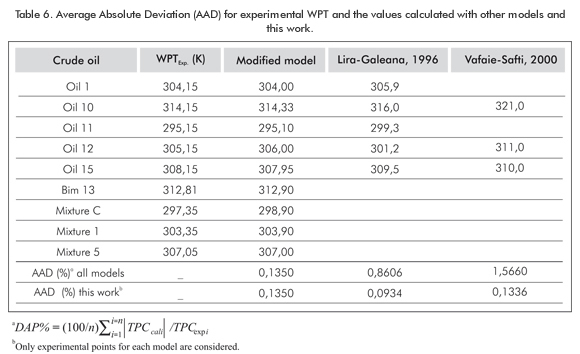
C7+, C20+, and C30+ (the heaviest fractions) of the mixtures treated in this work can be characterized using the method proponed by Peláez & Escobar (1995). This assumes a direct grouping (of any number of pseudos-components) by Gauss quadrature combined with the Whitson’s three-parameter Gamma function (1983). Several publications state that the Paraffin, Naphthene, and Aromatic (PNA) distribution, or precipitating and non-precipitating components of each pseudo-component, is a key issue in the modelling of paraffin precipitation (Hansen et al., 1988; Pedersen, 1993; Pan et al., 1997; Vafaie-Sefti et al., 2000). Hydrocarbon compounds making up naturally occurring crude oil, has been grouped chemically into several series of compounds. Each series consists of those compounds similar in their molecular makeup and characteristics. Within a given series, the compounds range from extremely light, or chemically simple, to heavy, or chemically complex. In general, it is assumed that the undefined hydrocarbon fractions are composed of three hydrocarbon groups: paraffins (P), naphthenes (N), and aromatics (A). The PNA content of the plus fraction of the undefined hydrocarbon fraction can be estimated experimentally from distillation. This type of analysis provides information valuable for use in characterizing the plus fractions. This research work assumes average physical properties for each pseudo-component; additionally simulated distillation experiments are not present in the data used in mixtures in this work. Therefore, there is no PNA division. The following correlations were developed for the calculation of average physical properties such as Critical Pressure(Pc), Critical Temperature (Tc), Acentric factor ω, boiling temperature (Tb) and specific gravity (γ), based on hundreds of experimental data and correlations taken from the literature and databases; for instance, NIST; (Riazi & Al-Sahhaf, 1995, 1996), as shown in Equation 10 and Table 5. δ is any of the above mentioned properties and is a function of the molecular weight Mi.

Fusion properties
Fusion properties are necessary for the calculation of pure solid fugacity, Equation 7. These amounts have been evaluated using different procedures inclu-ding PNA analysis in former publications. This work takes the correlations proposed by Escobar-Remolina (2006):


Where δCpi [=] cal/mol-K, δ hif [=] cal/mol, Tif [=] K, and Mi is the molecular weight in g/mol.
RESULTS AND ANALYSIS
Crude oils presented in Table 1
The WPT of the nine oils shown in Table 1 as taken from the literature was compared to the modified model (presented in this paper) and to other models commonly used in the calculation of the solid-liquid equilibrium.
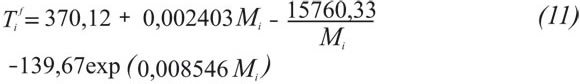
Table 6 compares the modification to other well-known models such as Lira-Galeana et al., 1996; Vafaie-Safti et al., 2000. The average absolute deviation percentage between the experimental WPT value and the value calculated with the models was found (%). The calculated WPT together with the model AAD are shown in Table 2. According to Table 6, in general terms, the modified model is better than the former model. This model has an AAD value that does not exceed 0,14% regarding the experimental model. There is no difference for many of the fluids studied in this work. Even though the atmos-pheric pressure is the value used in calculations, data and results show a model improvement that is consistent with former models. It is also strong and competitive in this type of complex phenomena.
Crude oils presented in Table 2
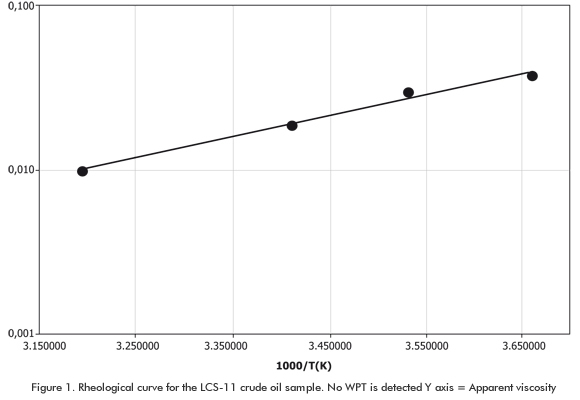
Table 2 shows the composition (% molar) of 5 crude oil fluids from Bolivian reservoirs that were analyzed at MAGCOP - ICP. As mentioned above, the fluidity points, API gravity, BSW values were measured to all of these Bolivian crude oils. They were also submitted to rheological tests in order to detect the cloud point or WPT by viscometry. The viscometry technique consists in the construction of a viscosity logarithm value graph against the inverse value of the absolute temperature. The Newtonian fluid property at high temperature is used (straight line). Once temperature decreases and minute wax crytals precipitate, the Newtonian fluid property is lost and a deviation with regard to the straight line is observed. This point of change represents the WPT. Figure 1 shows an example for each Bolivian crude oil samples studied. In Figure 1, the wax precipitation point is not clear. The WPT could not be estimated either in the viscosity tests applied to the rest of the crude oil samples. This is one of the disadvantages of the viscometry method: the first paraffin crystals can be formed at higher temperatures, in this case, above 40°C (313,16K). Due to this complication, the next step was to predict the Wax Precipitation Points (WPT) as well as precipitation and crystallization rates for Bolivian crude oils with the improved version of the model. The objective of this was flow assurance and cooperation in decision - making processes regarding oil production.
Paraffin compounds of Bolivia LCS-11
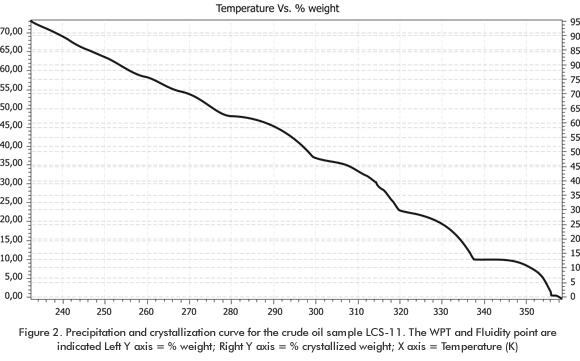
Figure 2 shows the unified curve for precipitation, crystallization, cloud and fluidity point for the sample LCS-11. It is worth mentioning that this precipitation property unification is a new concept applied to this work. The curve shows a cloud point of 356,3 K (83,1°C), and WPT could not be determined by experimental rheological analysis. This value indicates that precipitation for this crude oil is initiated by the high-molecular weight paraffin molecules (around 1.200 g/mol), thus generating the first solid cores that join other precipitating compounds (present in greater amount) as temperature lowers to produce the operation problems at the known temperature values in the production pipelines and surface facilities.
Paraffin Precipitation Lcs-11
The experimental fluidity temperature value (FT) of 237,2 K (-36 °C) was compared to the FT calculated in the graph. For this sample, FT is within the crystallization range of 90 to 95% (right axis of the graph). This is a very good approximation since there is not any technique or graph available at the moment that can determine this point accurately.
The fluidity point and the other characteristics in the graph are indicators of rheological change severity (no Newtonian behavior) when precipitation processes begin. This is the reason why their determination is important. The left axis named Total Precipitation, increases drastically as from 25°C (308,15 K), thus demonstrating the plugging potentiality due to paraffin precipitation. The graph leaps correspond to the initiation of precipitation for each component depending on their concentration in the mixture and fusion point, among other properties. The rest of the samples studied show similar rheological, compositional and thermodynamic behavior and, therefore, a similar analysis is valid for them. It is then deduced that the model improvement allow the prediction of wax precipitation points or temperatures in many cases. This agrees with recent publications about oil fields that experience paraffin or wax problems (Barker, Sharum, & Brewer, 1999; Barker, Bliger, Hake, & Sallee, 2003).
Crude oil samples in Table 3.
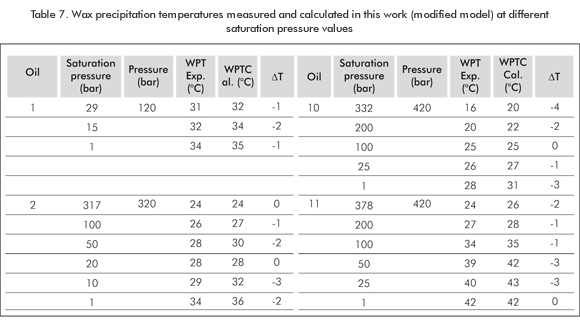
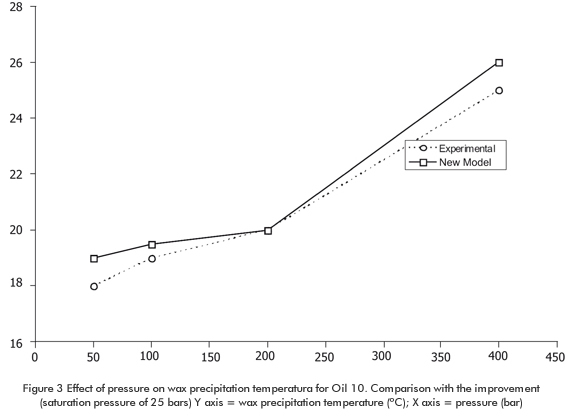
Table 3 shows the composition for 13 samples of living oil taken from the literature. Wax precipitation temperature data corresponding to 20 oil mixtures including samples 1, 2, 10 and 11 of Table 3 are su-mmarized in Table 7. The same general trend for all oil samples is observed, that is, decrease of WPT as dissolved gas content increases. Table 7 also shows the data calculated based on the modification proposed in this paper. The model reproduces WPT experimental data very well both at low and high saturation pressure values, from the minimum to the maximum dissolved gas content. The temperature difference (δT) does not exceed 3°C to 4°C (276,15 K to 277,15 K) for the four selected oil samples and their mixtures. In some cases, this difference is equal to zero. Figure 3 illustrates the pressure effect for Oil 3. Experimental WPT increases approximately 2°C (275,15 K) per each 100 bars. This completely agrees with the data for pure alkanes and living oil reported in the literature. It is highlighted here that the composition of Oil 10 remains constant in "pure" pressure effects. Figure 3 shows a predictive trend of the pressure improved multi-solid model. The two effects mentioned above have been simulated by this model without any data or parameter adjustment and omitting PNA characterization.
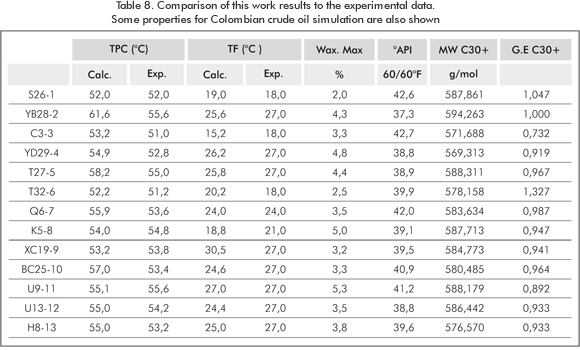
Crude oil samples in Table 4.
Table 4 shows 13 Colombian crude oil mixtures from one of the main Colombian reservoirs. WPT was determined using the microscopic technique. Simulation results with this model are presented in Table 8. The margin of error between calculated values and experimentally-found values for fluidity point temperature (FT) is ± 3°C (276,15 K). Samples are characterized with the known properties of the C30+ fraction. The average physical properties found for the 15 pseudo-components of this fraction include the following: molecular weight, specific gravity, boiling temperature, fusion and enthalpy temperature, calorific capacity, acentric factor, temperature and critical pressure.
For the FT calculation, the precipitation range of the carbon number C36 was used, which was calculated by overlying the fluidity point temperatures found experimentally in each paraffin precipitation graph, corres-ponding to the 13 samples of the Colombian crude oil wells. For all oil wells, the WPT threshold begins in the carbon number C44 and the fluidity point occurs in C36. Normal pressure and temperature values were also calculated for crude oils and, for instance, an experimental comparison was made with samples S26-1 and YB28-2. In this case, the difference is 0 and 6°C (273,15 K and 279,15 K), respectively (Table 8). In addition, Table 8 shows the maximum amount of precipitated wax, API, weight and specific gravity of the C30+ fraction for each sample studied.
CONCLUSIONS
- An improvement to a multi-solid thermodynamic model for paraffin precipitation was developed in this work, describing this phenomenon at high pressure and temperature values in petroleum reservoirs. Predictions made with this modification were compared to experimental data for different crude oil samples and similar results were obtained with percentages below 0,15%. Analyses with this improved model facilitate decision-making processes under different circumstances for flow assurance at petroleum locations. Furthermore, comparisons to other commonly used models were established. The modification resulted in better predictions with regard to the calculated experimental data. New correlations among pseudo-component physical properties were generated by this work and these values were used in fluid compositional simulation. Experimental data were obtained from the literature and from analyses conducted to Colombian and Bolivian crude oil samples.
ACKNOWLEDGEMENTS
The authors express their gratitude to Ecopetrol S.A - Instituto Colombiano del Petróleo.
REFERENCES
Barker, K. M., Bliger, J. M. , Hake, K. & Sallee, D. C. (2003). Paraffin Problems in Gás Systems. SPE Soc. Of Pet. Engrs., Pittsburgh, Pennsylvania. SPE 84827. [ Links ]
Barker, K. M., Sharum, D. B. & Brewer D. (1999). Paraffin Damage in High Temperature Formations, Removal and Inhibition. SPE Soc. Of Pet. Engrs., Oklahoma, Oklahoma. SPE 52156. [ Links ]
Dauphin, C., Daridon. J. L., Coutinho, J., Baylère, P. & Potin - Gautier, M. (1999). Content Measurements in Partially Frozen Paraffinic Systems. Fluid Phase Equilibria, 161: 135-151. [ Links ]
Dalirsefat, R. & Feyzi, F. (2007). A thermodynamic model for wax deposition phenomena. Fuel, 86: 1402-1408. [ Links ]
Erickson, D. D., Niesen, V. G. & Brown, T. S. (1993). Thermodynamic Measurement and Prediction of Paraffin Precipitation in Crude Oil. SPE Annual Technical Conference and Exhibition, Houston, TX, October 3 - 6. SPE, 26604 [ Links ]
Escobar-Remolina, J. C. M. (2006). Prediction of Characterics of Wax Precipitation in Synthetic Mixtures and Fluids of Petroleum: A New Model. Fluid Phase Equilibria, 240 (2): 197-203. [ Links ]
Escobar-Remolina, J. C. M. & Pelaez C.V. (2000). Informe Interno, Ecopetrol S.A.-Instituto Colombiano del Petróleo (ICP). Cod. 13040. [ Links ]
Fagin, K. M. (1945). Automatic Scrapers Used in West Edmond Oil Wells. Pet. Eng., June.105. [ Links ]
Ford, P. E., Ell, J. W. & Russell R. J. (1965). Frequent Pigging Helps Move Waxy Crude Below Its Pour-Point.Oil & Gás J., May 10, 183 - 189. [ Links ]
Gonzáles, D. L., Jamaluddin, K. M., Solbakken, T., Hirasaki, G. J. & Chapman, W. G. (2007). Impacto Flow Assurance in the Development of a deepwater Prospect. SPE Soc. Of Pet. Engrs., Anaheim, California. SPE 110833. [ Links ]
Hansen, A. B., Larsen E., Pedersen, W. B. & Nielsen A. B. (1991). Wax Precipitation from North Sea crude Oils. 3. Precipitation and Dissolution of Wax Studied by Differential Scanning calorimetry. Energy & Fuels, 5 (6), 914 - 923. [ Links ]
Hansen, J. H., Fredenslund, Aa., Pedersen, K. S. & Ronningsen, H. P. (1988). A Thermodynamic Model For Predicting Wax Formation in Crude Oils. AIChE Journal, 34: 1937-1942. [ Links ]
Hong-Yan J., Bahman T., Ali D. & Adrian, C. T. (2004). Wax phase equilibria developing a thermodynamic model using a systematic approach. Fluid Phase Equilibria, 216: 201-217. [ Links ]
Lira-Galeana C., Firoozabadi A. & Prausnitz J. M. (1996). Thermodynamics of Wax Precipitation in Petroleum Mixtures. AIChE Journal, 42 (1): 239. [ Links ]
Martos, C., Coto, Baudillo., Espada, J. J., Robustillo, M. D., Gómez S. & Peña, J. L. (2008). Experimental Determination and Characterization of Wax Fractions Precipitated as a Function of Temperature. Energy and Fuels, 22: 708 - 714. [ Links ]
Nichita, D. V., Gousl, L. & Firoozabadi, A. (2001). Wax Precipitation in Gas Condensate Mixtures. SPE 74686, SPE Annual Technical Conference and Exhibition, Houston, TX. [ Links ]
Pan, H., Firoozabadi, A. & Fotland, P. (1996). Pressure and Composition Effect on Wax Precipitation: Experimental Data nd Model Results. SPE 36740, SPE Annual Technical Conference and Exhibition, Denver, CO. SPE 110833. [ Links ]
Pauly, J., Dauphin, C. & Daridon, J. L. (1998). Liquid-Solid Equilibria in a Decane + Multi-ParaffinsSystem. Fluid Phase Equilibria, 149, 191. [ Links ]
Pedersen, K. S. (1993). Prediction of Cloud Point Temperatures and Amount of Wax Precipitated. Soc. Pet. Eng., Richardson, TX. SPE 27629. [ Links ]
Pedersen, K. S. & Christensen P. L. (2007). Phase behavior of petroleum reservoir fluids. Boca Raton, USA : CRC Press. [ Links ]
Pedersen, K. S. & Skovborg, P. (1991). Wax Precipitation from North Sea Crude Oils. 4. Thermodynamic Modeling. Energy & Fuels, 5: 924- 932. [ Links ]
Pedersen, W. B., Hansen, A. B., Larsen, E., Nielsen, A. B. & Roenningsen, H. P. (1991). Wax Precipitation from North Sea Crude Oils. 2 Solid-Phase as Function of Temperature Determined by Pulsed NMR. Energy and Fuels, 5: 908-13. [ Links ]
Pedersen, W. B., Hansen, A. B., Larsen, E. & Nielsen, A. B. (1991). Wax Precipitation from North Sea Crude Oils. 2. Solid-Phase Content as Function of Temperature Determined by Pulsed NMR. Energy & Fuels, 5:913. [ Links ]
Peláez C. V. & Escobar-Remolina J. C. M. (1995). Un simulador para el estudio del comportamiento de fases basado en la ecuación de estado de soave y cálculos de balances de materia. CTYF, Ciencia, Tecnología y Futuro, 1 (1): 83-94. [ Links ]
Peng, D. & Robinson, D. (1976). A New two-constant equation of state. Eng. Chem. Fund. April 28. 59-64. [ Links ]
Prausnitz, J. M., Lichtenthaler, R. N. & Azevedo, E. G. (1986). Molecular Thermodynamics of Fluid Phase Equilibria. NJ, USA :Prentice-Hall Inc. [ Links ]
Reddy, S. R. (1986). A Thermodynamic Model for Predicting n-Paraffin Crystallization in Diesel. Fuel, 65: 1647-1652. [ Links ]
Riazi, M. R. & Al-Sahhaf, T. A. (1995). Physical Properties of n-Alkanes and n-Alkylhydrocarbons: Applications to Petroleum Mixtures. Ind. Eng. Chem. Res. 34: 4145. [ Links ]
Riazi, M. R. & Al-Sahhaf, T. A. (1996). Physical properties of heavy petroleum fractions and crude oils. Fluid Phase Equilibria, 117: 217-224. [ Links ]
Ronningsen, H. P., Somme, B. F. & Pedersen, K. S. (1997). An improved themodynamic model for wax precipitation: experimental foundation and application. 8th International Conference on Multiphase 97, Cannes, France . [ Links ]
Ronningsen, H. P., Bjoerndal, B., Hansen, A. B. & Pedersen, W. B. (1991). Wax Precipitation from North Sea Crude Oils. 1. Crystallization and Dissolution Temperatures, and Newtonian and Non-Newton Flow Properties. Energy and Fuels, 5: 895 - 908. [ Links ]
Smith, J. M., Van Ness, H. C. & Abbott, M. M. (1996). Introduction to Chemical Engineering Thermodynamics. Chapter 14. McGraw-Hill. [ Links ]
Vafaie-Safti, M., Mousavi-Dehghani, S. A. & Mohammad-Zadeh Bahar, M. (2000). Modification of multisolid phase model for prediction of wax precipitation: a new and effective solution method. Fluid Phase Equilibria.173: 65. [ Links ]
Whitson, C. H. (1983). Characterizing Hydrocarbon Plus Fractions. Soc. Pet. Eng. J., 23: 683 - 694. [ Links ]
Won, K. W. (1986). Continous Thermodynamics for Solid Solution - Liquid - Vapor Equilibria: Wax Phase Formation From Heavy Hydrocarbon Mixtures. Fluid Phase Equilibria, 30: 265 - 279. [ Links ]

