


Services on Demand
Journal
Article
 English (pdf)
 Article in xml format
 Article references
 Send this article by e-mail
Indicators
-
 Cited by SciELO
 -
 Access statistics
Related links
-
 Cited by Google
 -
 Similars in
SciELO
Similars in
SciELO -
 Similars in Google
Share

 Permalink
CT&F - Ciencia, Tecnología y Futuro
Print version ISSN 0122-5383On-line version ISSN 2382-4581
C.T.F Cienc. Tecnol. Futuro vol.3 no.5 Bucaramanga Jan./Dec. 2009
PREDICTION OF THE FCC FEEDSTOCKS CRACKABILITY
Francy-L. Martínez-Cruz, Gustavo Navas-Guzmán* and Juan-Pablo Osorio-Suárez
Ecopetrol S.A. - Instituto Colombiano del Petróleo, A.A. 4185 Bucaramanga, Santander, Colombia
e-mail: gustavo.navas@ecopetrol.com.co
(Received April 30, 2008; Accepted July 17, 2009)
* To whom correspondence should be addressed
ABSTRACT
This paper presents a statistical model for prediction of feedstock’s crackability (potential to generate va-luable products on catalytic cracking process), based on experimental reactivity data by microactivity test (MAT - Microscale Fixed Bed Reactor) and detailed physicochemical characterization. A minimum amount of experimental tests corresponding to feed properties (typically available at refinery) is used to build a more complete description of feedstocks including chemical composition and hydrocarbon distribution. Both measured and calculated physicochemical properties are used to predict the yields of main products at several MAT reaction severities. Different well known functions correlating yields and conversion (previously tested with experimental data MAT) allows the evaluation of maximum point of gasoline yield. This point is used like a crackability index and qualitative point comparison of feedstock’s potential. Extensive feedstocks data base from Instituto Colombiano del Petróleo (ICP) with a wide range of composition were used to build the model, including the following feeds: 1. Light feedstocks - Gasoils of refinery and laboratory cuts from different types of Colombian crude oils and 2. Heavy feedstoks - Residues or feedstocks combined (blending of gasoil [GO], atmospheric tower bottom [ATB], demetallized oil [DMO] and demetallized oil hydrotreated [DMOH] in several proportions) from the four fluid catalytic cracking units (FCCU) at Ecopetrol S.A. refinery in Barrancabermeja - Colombia . The results of model show the prediction of valuable products such as gasoline for different refinery feedstocks within acceptable accuracy, thus obtaining a reliable ranking of crackability.
Keywords: catalytic cracking, crackability, predicting properties, statistical model.
RESUMEN
En este trabajo se presenta un modelo estadístico para la predicción de la craqueabilidad de cargas (potencial para generar productos valiosos en el proceso de ruptura catalítica), basado en datos experimentales de reactividad, obtenidos por pruebas de microactividad (MAT - Reactor de Lecho Fijo de Laboratorio) y caracterización fisicoquímica detallada. Se utiliza una cantidad mínima de mediciones experimentales disponibles en una refinería promedio, a partir de las cuales se construye una descripción más completa de la carga. Esta descripción fisicoquímica es usada para predecir los rendimientos de los principales productos en un amplio rango de severidades. Diferentes funciones que relacionan los rendimientos con la conversión (previamente probadas con los datos experimentales MAT), permiten evaluar el punto de máximo potencial a gasolina y comparar cualitativamente la craqueabilidad de un conjunto de cargas. Una extensa base de datos del Instituto Colombiano del Petróleo (ICP) con un amplio rango de composiciones fue usada para construir el modelo, la cual incluyó: 1. Cargas livianas - Gasóleos de refinería y cortes de laboratorio de diferentes tipos de crudos Colombianos y 2. Cargas pesadas - Residuos o cargas combinadas (mezcla de gasóleo [GO], fondo atmosférico de vacío [ATB], aceite desmetalizado [DMO] y aceite hidrotratado desmetalizado [DMOH] en diferentes proporciones) de las cuatro unidades de ruptura catalítica (FCCU) de la refinería de ECOPETROL S.A de Barrancabermeja-Colombia. Los resultados muestran una aceptable precisión en la predicción del potencial de distintas cargas de refinería, respecto a productos valiosos como la gasolina, obteniéndose una clasificación confiable de su craqueabilidad.
Palabras Clave: ruptura catalítica, craqueabilidad, predicción de propiedades, modelo estadístico.
RESUMEN
Neste trabalho apresenta-se um modelo estatístico para a predição da craqueabilidade de cargas (potencial para gerar produtos valiosos no processo de ruptura catalítica), baseado em dados experimentais de reatividade, obtidos por provas de micro-atividade (MAT - Reator de Leito Fixo de Laboratório) e caracterização físico-química detalhada. Utilizase uma quantidade mínima de medições experimentais disponíveis em uma refinaria média, a partir das quais se constrói uma descrição mais completa da carga. Esta descrição físico-química é usada para predizer os rendimentos dos principais produtos em uma ampla categoria de severidades. Diferentes funções que relacionam os rendimentos com a conversão (previamente provadas com os dados experimentais MAT), permitem avaliar o ponto de máximo potencial a gasolina e comparar qualitativamente a craqueabilidade de um conjunto de cargas. Uma extensa base de dados do Instituto Colombiano do Petróleo (ICP) com uma ampla categoria de composições foi usada para construir o modelo, a qual incluiu: 1. Cargas leves - Gasóleos de refinaria e cortes de laboratório de diferentes tipos de crus Colombianos e 2. Cargas pesadas - Resíduos ou cargas combinadas (mistura de gasóleo [GO], fundo atmosférico de vácuo [ATB], óleo desmetalizado [DMO] e óleo hidrotratado desmetalizado [DMOH] em diferentes proporções) das quatro unidades de ruptura catalítica (FCCU) da refinaria da ECOPETROL S.A de Barrancabermeja-Colômbia. Os resultados mostram uma aceitável precisão na predição do potencial de diferentes cargas de refinaria, em relação produtos valiosos como a gasolina, obtendose uma classificação confiável da sua craqueabilidade.
Palavras Chave: ruptura catalítica, craqueabilidade, predição de propriedades, modelo estatístico.
INTRODUCTION
The process of catalytic cracking is one of the most important conversion processes in a petroleum refinery. It plays a key role in the production of valuable fuels such as high octane gasoline from feedstocks with high boiling point and low economic value. The effect of the processed feedstock quality on the yields is very important and has been frequently studied in order to predict the potentiality of the feedstock in terms of its chemical composition. Although different methods have been proposed to achieve this aim, one can distinguish two major trends reported in the literature: the first one uses a pseudo reactive model whose kinetic parameters represent conversion velocity among actual yields, according to boiling point products and nature feeds (lumps). The objective in this case is to correlate feedstock characte-ristics with those parameters. Voltz, Nace, & Weekman (1971) and Ancheyta, López, & Aguilar (1998) used a three-lump model and correlated its parameters with structural properties in order to calculate the yield of cracking vacuum gasoils. The second and more common alternative consists in the direct correlation of properties with yields. The advantage in this case is the possibility to infer the impact of feedstock in products in one single step. Some authors like Bollas, Vasalos, Lappas, Latridis & Tsioni (2004) use a simple model reactor to involve cracking conditions (residence time and temperature) furthermore to correlate crackabilty with the feed characteristics.
Fisher (1990) conducted a pioneer study to understand the influence of different types of carbon and aromatic structures on the catalytic cracking products, thus proposing the well-known concept of precursors. By performing mass spectrometry studies on different vacuum gasoils, he found a direct correlation between the paraffin, cycloparaffin, and monoaromatic content with the gasoline and conversion yield at the maximum point gasoline yield, obtained in MAT tests. He concluded that this point can be utilized as a comparative parameter for feedstock quality. Similarly, Lerner & Himpsl (1997) observed that the condensation degree of aromatic compounds plays a direct role in feedstock crackability. The relation between the reaction parame-ters from the threelump models and the ratio aromatic to naphthenic structures and paraffinic to naphthenic carbon published by Voltz, Nace, & Weekman, (1971) and Ancheyta, López, & Aguilar, (1998) respectively, coincide with the conclusions of Fisher (1990) and Lerner, & Himpsl (1997). Sheppard, Al-Alloush, Green, Zagula, Young, & Wisecarver (2003) used the hydrogen to carbon plus sulfur ratio as a key factor of gasoline yield, corrected by hydrocarbon and sulfur compounds that boil below the reaction temperature (determined by mass spectroscopy studies) and affected by total nitrogen and metals. The coke yield was expressed in function of the residual microcarbon content (MCR) and on exponential equation of basic nitrogen, sulfur, and me-tals. The gas, LCO (Light Cycle Oil) and HCO (Heavy Cycle Oil) yields also were predicted with multiple linear correlations of MCR, metals, sulfur, nitrogen, and hydrogen. Mariaca, Rodriguez, & Maya (2003) proposed the reactive hydrogen like crackability index, determined by mass spectroscopy on vacuum gasoils. This was correlated in linear form with saturated content, hydrogen, and Kw factor (Watson’s characterization factor) and expressed the cracking yields by inverse polynomial equation.
Improvement in instrumental techniques and new data processing methods have made possible the direct use of spectroscopic signals (which respond in an unique manner to the composition of a petroleum fraction) in order to infer feed properties and variation of products characteristics in conversion processes. Baldrich, & Novoa (2007) presented a recent application of visible UV spectroscopy to infer structural properties of medium distillates and light gasoils (performed by high-resolution mass spectrophotometry) with excellent predicting results. However, the instrumental techniques are strongly limited for light and medium feedstocks analysis, their availability, cost and usefulness.
Instrumental measurements are indispensable in the above mentioned works. However, parallel efforts have been made to correlate bulk properties with basic structural and molecular characteristics, in order to predict the feed crackability. This aim is better applicable to the scope of a refinery, because bulk properties are easy to measure and they are typically used in the control of processes. Shi, Xu, Cheng, Hu & Wang (1999) related gasoline and vacuum coke residues crackability by a new characterization index (KH), defined by the molecular weight, density, and atomic H/C ratio of the feedstock. Bollas et al. (2004) determined an index crackability and coking tendency as a function of carbon atoms number subject to cracking (non-aromatic carbon obtained by the ndM empirical method) and nitrogen atoms number. The feedstock was divided in pseudo components in order to reconstruct light and heavy fractions that exhibit better correlation with the indexes mentioned above, and whose sum represented the characteristics of the whole feed. Ng, Wang, Fairbridge, Zhu, Yang, Ding, & Yui (2004) reintroduced the concept of precursors and corre-lated in linear form, the maximum gasoline yield with the saturated and monoaromatic compounds and LCO yield with the diaromatic and triaromatic compounds. Xu, Gao, Zhao, & Lin (2005) developed empirical corre-lations to predict gasoline and coke yields as a function of the SARA (Saturates-Aromatics-Resins-Asphaltenes) fraction composition in vacuum deasphalted residues.
In this work, bulk properties, and structural characteristics are correlated with MAT yields, for numerous gasoils and combined feedstocks. The objective of this work was to develop a physicochemical and crackability prediction for studying and evaluating the impact of feedstock composition variability in the FCC process. Reactivity data are related with simple linear functions between yields and conversion in order to: get a graphical description of feedstock reactivity and establish the maximum gasoline yield point. This point is utilized like a crackability index to define the potential feed quality.
Crackability is defined as the maximum potential of a feedstock to generate valuable products. This characteristic is closely related to feedstock structural composition due to the fact that each hydrocarbon family tends to react in similar way, having a preferential contribution to certain yield. In all cases, the increment of molecular size or carbons number facilitates the cracking of molecule. In the catalyst takes place multiple reactions like cracking, hydrogen transfer, isomerization, dehydrogenation, polymerization and condensation. Even the catalytic cracking of a linear paraffinic molecule is complex. Some authors as Dewachtere, Santaella & Fromen (1999) use sophisticated kinetic models, which involve a great number of compounds on chemical reaction networks to approach the effect of feed composition on yields and products quality. However, it is possible to highlight some general characteristics for the three main hydrocarbon families present in petroleum. Para-ffin molecules produce olefins and smaller paraffins. Linear and low molecular weight paraffins do not react easily and their crackability increases with the presence of tertiary carbons, and decreases with quaternary carbons. Naphthenic molecules tend to crack to gasoline in large proportion. The quality (Octane Number) of this gasoline is higher than the gasoline generated by paraffins, with an important content of aromatic molecules as a result of naphthenic ring dehydrogenation. Aromatic molecules are considered as hardbreaking structures. However, alkylic chains more frequent in low condensed aromatics (mono and diaromatics) can be easily detached from the aromatic ring. Aromatic molecules without lateral chains are important generators of coke and gas as the rings condensed number increases in their structure. Large molecules such as resins and asphaltenes exhibit a direct trend toward the generation of heavy fractions and coke. Therefore, the feedstocks for catalytic cracking undergo a pre-treatment process to withdraw these compounds.
The presence of contaminants, such as nitrogen, is also related to feedstock crackability due to its neutralizing effect of catalyst acidity. Metals such as Vanadium and Nickel act as strong poisons that destroy the zeolite structure. However, unlike nitrogen, their effect is not instantaneous and is reflected at long term, destroying the crystalline catalyst network. Sulfur affects mainly the distribution and quality of products, although it does not affect crackability in a significant manner. In general, the increment of these elements in the feedstock is related to the increase of aromatic structures because they represent their structural composition indirectly and can therefore correlate their reactivity. Bulk properties such as density, index refraction, and distillation curve also reflect the feedstock structural character, particularly when they are used conjointly in the classification factors (KUOP factor, Correlation Index, ndM Method, molecular weight - see annex).
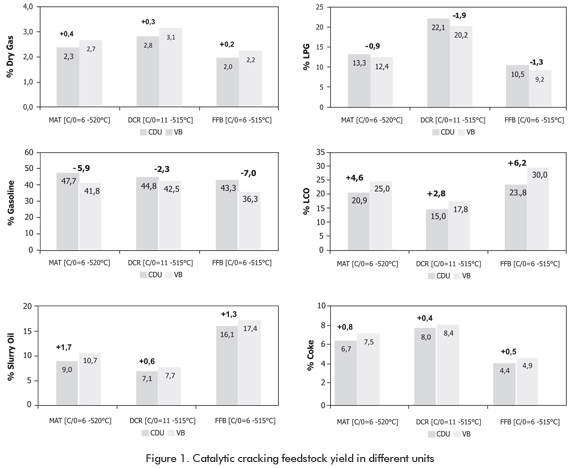
When the catalytic cracking products of two feeds are compared, the relative differences between yields are maintained (the qualitative tendency not the quantitative difference of values), independently of the unit in which they are evaluated. Of course this crackabilty concept is true only if the catalyst and reaction conditions used on two feedstocks were the same. This suggests that there is some relation between yields obtained in different units. Ng et al. (2004) found a linear correlation between the yields obtained in a Riser and MAT yields at constant conversion (Riser-Yield = b + m * MAT-Yield). Figure 1 illustrates the crackability of two gasoils (CDU = gasoil from a crude distillation unit and VB = gasoil from a visbreaker unit), evaluated in three different units from ICP (MAT- microscale fixed bed reactor, DCR - fluidized bed pilot unit and FFB - fluidized fixed bed laboratory reactor) with the same catalyst. It is evident that relative yields between the two feedstocks are maintained, even though reactions severities are not comparable from one unit to the other.
EXPERIMENTAL WORK
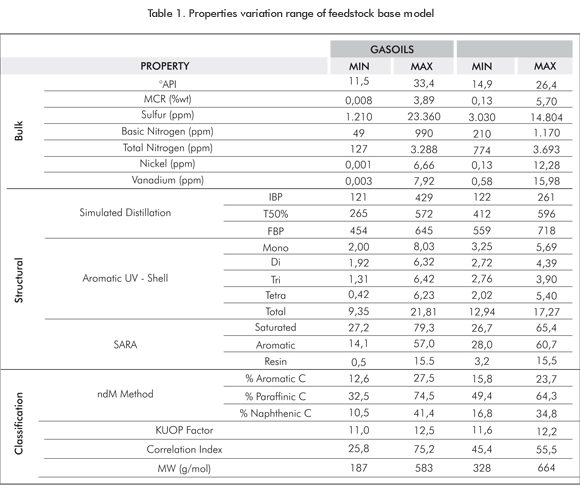
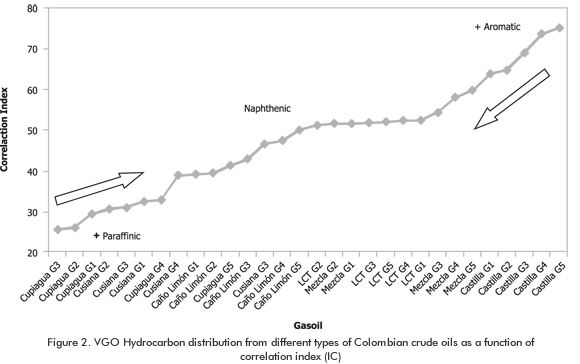
The feedstocks used for model development were divided in two groups (light and heavy feedstocks). The first group corresponded to gasoils obtained through sampling procedures in refinery and laboratory cuts from Colombian crude oils of different nature (from highly paraffinic crude oil - Cusiana to highly aromatic crude oil - Castilla, Figure 2). Among refinery gasoils, most of them virgins (atmospherics and vacuum), were included gasoils from visbreaking and hydrotreating process. As a result, 82 gasoils with detailed physicochemical information constituted the database of light feedstock. The second group corresponded to residues selected from ICP database. This database covers detailed five year physicochemical information of both individual and combined feeds of the four Barrancabermeja refinery FCC units. Principal component statistical analysis (PCA) was applied to identify those feeds with large physicochemical variability. Additionally, five typical individual feeds were selected: light and heavy vacuum gasoils (LVGO, HVGO), atmospheric tower bottom (ATB), demetallized oil (DMO), which correspond to lighter fraction from deasphalted vacuum tower residue, and hydrotreated DMO (DMOH). As a result, 21 residues with several compositions constituted the database of heavy feedstocks. Table 1 shows the wide range of physicochemical characteristics of gasoils and residues used in the construction of the model.
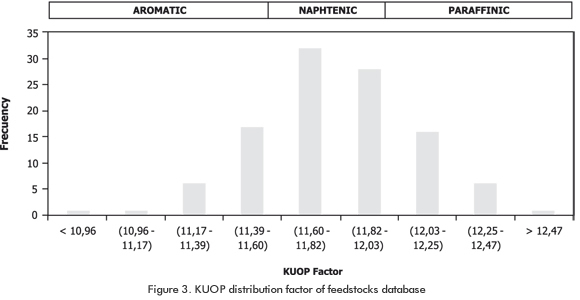
The different characteristics of feedstocks ensured a strong structural variability, reflected in its hydrocarbon distribution (paraffinic, naphthenic and aromatic - Figure 3). It promoted marked differences in the yield products distribution and permitted the model to take into account different types of feedstock that a FCCU is able to process.
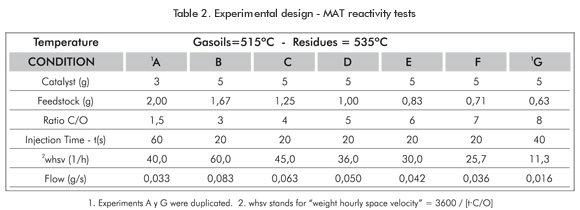
Reactivity experimental design used for the evaluation of feedstocks crackability (Table 2) was the result of previous experimental analysis using as starting point the conclusions of sequential design of experiments technique conducted by Reina & Osorio (2005) in the same unit. The MAT unit operating conditions (Cat/Oil ratio, injection time and feedstock flow) were optimized keeping repeatability values less than 1% in the gasoline yield variation and mass balance between 98 and 102%. The objective was to obtain a product yield curve profile in a wide reaction conditions range. However, the temperature was fixed at 515°C for gasoils and 530°C for residues. Two base equilibrium catalysts (ECAT) from the FCCU Barrancabermeja refinery were selected, one for gasoils and other one for residues, considering good industrial performance in terms of activity and coke selectivity. In conclusion, with the MAT experimental design, it was possible to obtain complete product yield selectivity curves accor-ding with the feedstock reactivity.
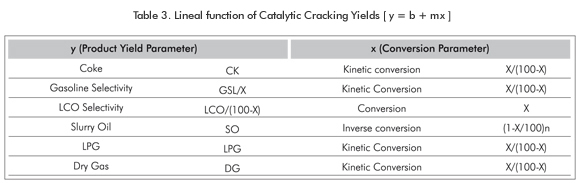
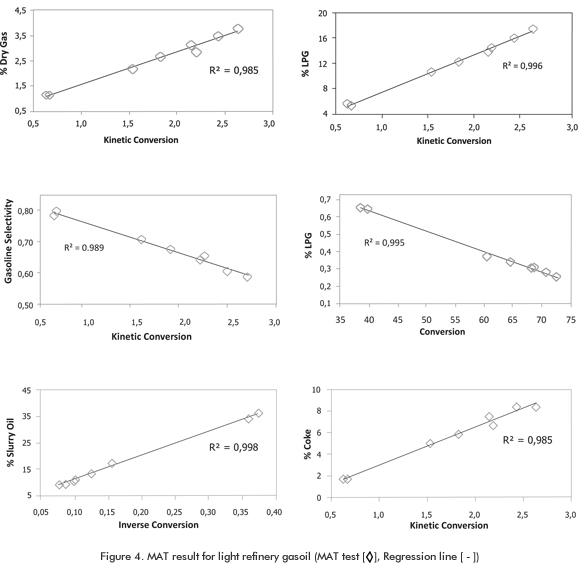
Linear functions between product yields and feedstock conversion (Table 3), some of them frequently used to check the coherence of experimental results, are utilized as interpolation tool. Figure 4 shows an example of the MAT tests for a light gasoil, exhibiting excellent adjustment for each function. The gasoline conversion curve is fit by the linear function between its selectivity and the kinetic conversion. Its optimum point corresponds to the maximum gasoline yield that can be obtained from the feedstock at the MAT unit. The conversion at this point can be replaced in the other functions to estimate the yields else. This maximum point is used for the construction of a feedstocks crackability ranking.
RESULTS
Prediction of Physicochemical Properties
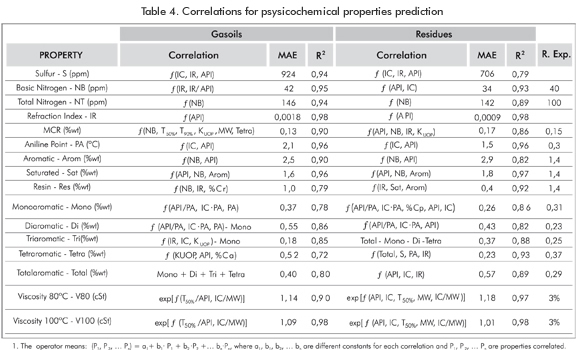
Correlations were developed for gasoils and combined feedstocks separately, by multiple linear regressions. The objective was to predict full physicochemical characteristics from a minimum number of basic properties. A set of equations was established to estimate bulk (Aniline point, MCR, Viscosity and Refraction Index), structural (Shell aromatics and SAR distribution) and composition characteristics (Nitrogen and Sulfur), from only two basic feedstock properties (API and Distillation Curve). Table 4 shows the mean absolute errors (MAE) obtained with the correlations and experimental repeatability values of each laboratory test (R. Exp.). The correlation for sulfur exhibits the largest mean error. Considering that sulfur concentration in feedstocks to FCCU is about 8.000 ppm, the estimation relative error would be 11%, which is acceptable. Regarding the remaining correlations, a better adjustment to the experimental data was achieved with relative errors below 5%, and absolute average error close to experimental repeatability value for each test.
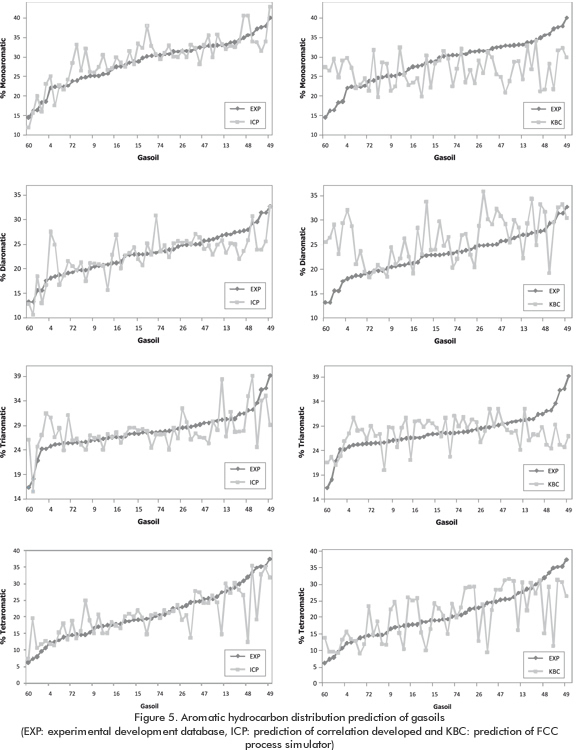
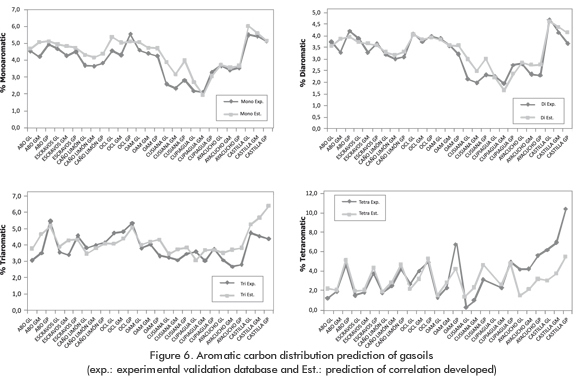
Due to the importance of the aromatic fraction and its distribution (mono, di, tri and tetra aromatics) in feedstock crackability, prediction and validation results of this property are presented. Figure 5 compares the estimation from the FCC-SIM ® rigorous commercial simulator of the catalytic cracking process by KBC Profimatics (Copyright © KBC Advanced Technology plc Version 2004-1.5) with the correlation developed. Better adjustment of the correlation to experimental data (values are showed in ascending order and graphic scales are identical) is clearly observed. Figure 6 shows the validation conducted with gasoils outside development database (validation database). Good predictive results were attained, including two foreign gasoils from imported crude oils (ABO and Escravos gasoils -Six first points on the graphics).
Prediction of Crackability
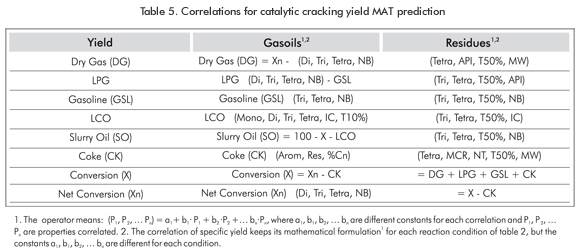
Yields estimated at different reaction severities (Table 2) in the MAT unit were directly correlated to feedstock properties by multiple linear regressions (Table 5). The correlated properties and mathematical formulation obtained for each yield correlation were kept independently of reaction condition. Therefore, only the constants reflected the effect of severity changes. This indicates that the correlated properties have strong influence on the corresponding yields, despite their selection was only consequence from statistical criteria. Differences between correlated properties for gasoils and residues are reasonable because of high boiling points and mixed composition of residues in contrast with the more defined origin of gasoils and its lower boiling points. However, the correlation for gasoline prediction results in function of condensed aromatic compounds with 3 and 4 rings, and basic nitrogen for both cases. This result seems to contradict the influence of saturated precursors found by Fisher (1990) and Ng et al. (2004), and it partially agrees with Voltz et al. (1971) and Ancheyta et al. (1998) regar-ding the aromatics and nitrogen, respectively. Results obtained by Xu et al. (2005) also show an acceptable trend with SARA distribution. However, prediction is not sufficiently good, reporting a mean absolute error higher than 2% in gasoline for a small set of feedstocks (6 deasphalted residues), as compared to 0,86% for the correlation obtained for the wide range composition of feedstocks (98 altogether).
The aromatic distribution has an important impact in general feedstock conversion. As Lerner & Himpsl (1997) concluded, there is a great influence of the feedstock condensation degree on crackability and it is more applicable for residues due to its highest poliaromatics content. This conclusion is observed in the participation of each type of aromatic structure in correlations: monoaromatic (1 correlation), diaromatic (3 correlations), triaromatic (8 correlations) and tetraromatics (11 correlations).
The influence of classification factors was very low and no correlation between the ndM classification and cracka-bility was observed, as Ancheyta et al. (1998) and Bollas et al. (2004) found it. For gasoils, whose MCR content is very low, aromatics and resins influenced coke prediction severely, while residues were better correlated with tri and tetraromatics, MCR, molecular weight, boiling point, and Total Nitrogen. All these compounds are indicators of a feedstock coking tendency.
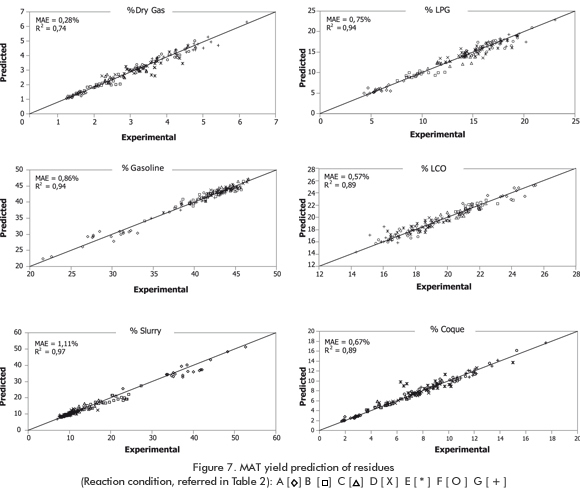
The only heteroatom that had an impact on cracka-bility was nitrogen, particularly its basic character content. Sulfur and metals did not exhibit any relation to catalytic reactivity. Figure 7 shows parity plots for the prediction of different yields of combined feedstocks. An acceptable correlation and very low prediction average absolute error is observed, comparable to the experimental repeatability of MAT tests.
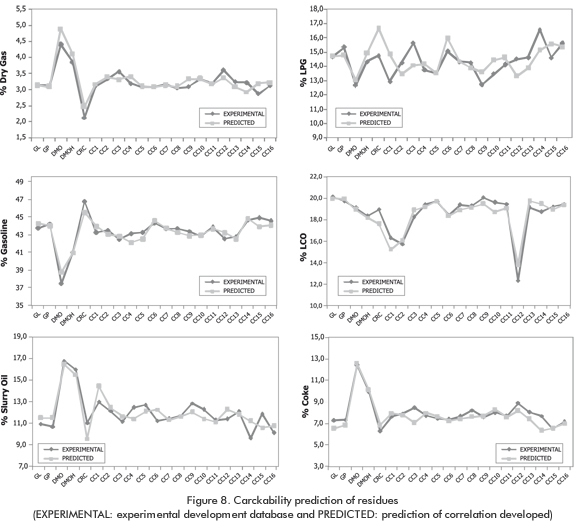
Evaluation of maximum yield gasoline was conducted on each feedstock, according to the following procedure:
· The slope and intercept of the linear relation between gasoline selectivity and kinetic conversion was calculated.
- A theoretical gasoline selectivity curve was obtained replacing, in the previously equation, conversion values between 0% and 100%.
- The maximum point of gasoline yield is calculated from gasoline selectivity curve optimization.
- The conversion obtained was used in the other selectivity curves to calculate the yield of re-maining products (dry gas, LPG, LCO, slurry oil and coke).
Figure 8 shows the yields at the maximum gasoline point, estimated from MAT experimental data and from calculated values applying the developed correlations. The model responds satisfactorily to the experimental trend observed and highlighted with excellent fit Gasoline, LCO and Coke prediction. Particularly, for the first five points of each graph that correspond to individual feedstocks, whose chara-cteristics represent extreme of possible feedstocks to FCCU.
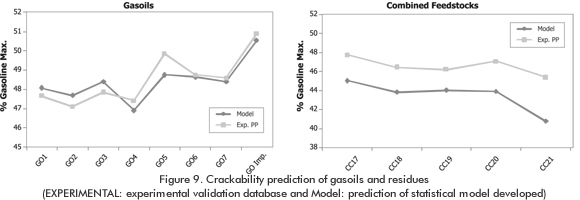
The concept of crackability used in this work and the statistical model (physicochemical estimation correlations, crackability estimation correlations, and estimation of maximum gasoline potential) were validated with two different feedstock groups: the first group corresponds to a set of processed gasoils of historical background FCCU Cartagena Refinery (ECOPETROL S.A.) and an imported gasoil (API = 26, NB = 210 ppm, MeABP = 790 °F, and Total Aromatics = 11,3%). The second group consists of different and more recently combined feedstocks outside of development database (validation database). These feeds were evaluated at the ICP FCC pilot plant (DCR), at different severities. Gasoils were evaluated with a diffe-rent catalyst to the one used in the MAT reactivity tests of developed model, while the same catalyst was used with the combined feedstocks.
With only two basic available properties in refinery (distillation curve and API gravity), the remaining charac-teristics and the MAT yields of each feedstock were calculated. The procedure to evaluate maximum yield of gasoline was then applied on experimental DCR pilot plant data and estimated MAT data by statistical model. Figure 9 compares the results. It is observed that the relative variation of gasoline potential at the pilot plant is very similar to the variation estimated by the model in both cases. It is important to highlight that the use of a different catalyst for gasoils did not affect such trend and values proximity is only coincidental. Even for imported gasoils, whose nature and origin is unknown and almost certainly is different with respect to gasoils of Colombian crude oils, the relative gasoline potential is well predicted. On the other hand, combined feedstocks (evaluated with the same base catalyst used in the development model) show Riser gasoline yields higher than estimated values for MAT, but alike gasoils the relative variation is very similar. These results are consistent with the crackability concept and evaluation proposed in this work, in which the maximum gasoline yield is a key parameter to evaluate the potential of feedstocks on catalytic cracking process, independent from the inherent conditions of unit and catalyst.
Applied cases
The following three illustrative cases show the influence predicted by the model of different feeds on catalytic reactivity.
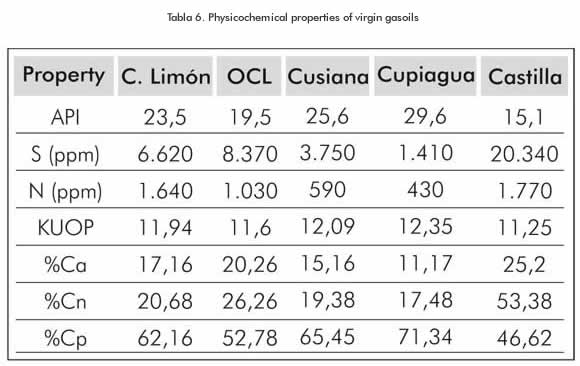
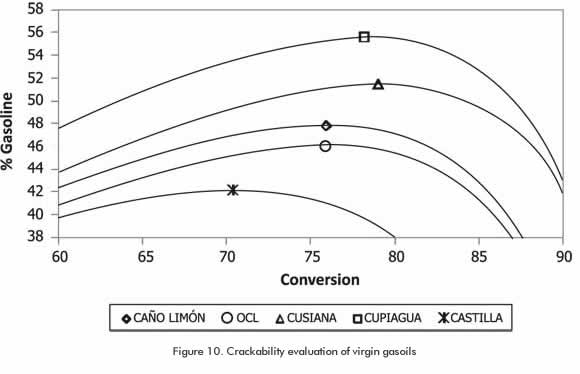
Case I: Five full range vacuum gasoils from Colombian crude oils, with widely different characteristics, showed a trend that is coherent to their nature (Table 6 and Figure 10). For the Cupiagua crude oil gasoil, higher gasoline yield is observed since this is a highly paraffinic feedstock (KUOP = 12,35 and %Cp = 71,34). On the contrary, the gasoil from the Castilla crude oil exhibits lower gasoline yield, due to its high aromatic nature (KUOP = 11,25 and %Ca = 25,2). The gasoil from the Cusiana crude oil is highly paraffinic and reach similar conversions as well as Cupiagua. However, its higher nitrogen content affects its gasoline selectivity. The remaining gasoils (OCL and Caño Limon) are characteristic of intermediate - type crude oil (naphthenic oils), as it was estimated by the model.
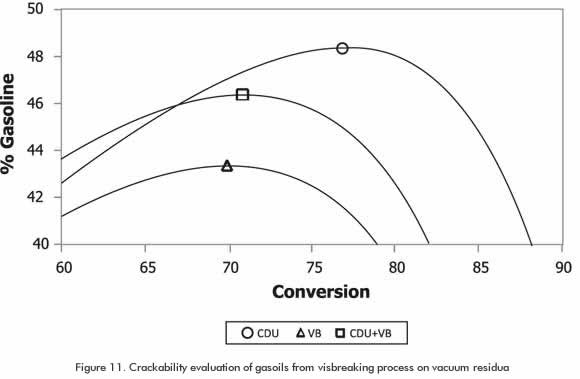
Case II: A virgin gasoil from crude distillation unit (CDU) is compared to gas oil from the visbreaking process on vacuum tower residua (VB) and with a blend of 80% weight of CDU + 20% weight VB (Figure 11). It is then coherent that the maximum gasoline point and its conversion for the virgin gasoil are greater than visbreaking gasoil point. Obviously, the blend should be in between. Besides, it is observed that even thought the VB gasoil fraction is only 20%, it exerts a much greater influence over blend crackability, affecting its selectivity to gasoline severely.
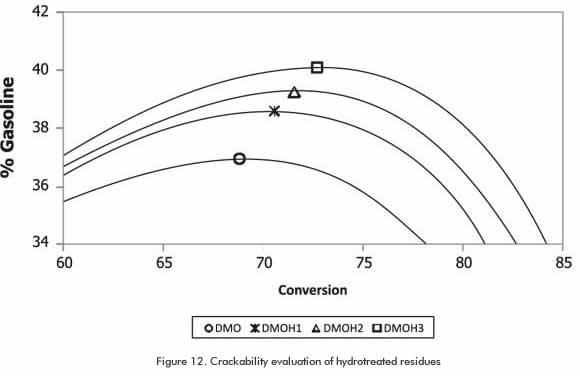
Case III: A demetallized residue (DMO) is hydrotreated at three different temperatures. Its quality for catalytic cracking increases with the hydrotreatment severity because of replacement of contaminant elements such as sulfur, nitrogen and metals by hydrogen and because of saturation of aromatic rings. Therefore, the gasoline potential of the feedstock also increases with the severity of the hydrotreatment (Figure 12), where DMOH 1, 2, and 3 were processed at 330, 350 and 370 °C temperatures, respectively.
CONCLUSIONS
- A statistical model for physicochemical properties and crackability prediction of feedstocks for fluid catalytic cracking process was completed. The model exhibits acceptable description and agreement with the experimental data of a broad set of feedstock from different origins and characteristics. Basic properties such as distillation curve and density allow calculating structural and composition properties such as the content of basic nitrogen, distribution of aromatic carbon and SAR distribution, among others. The correlations developed suggest that these properties are strongly related to the capability of feedstocks to catalytic cracking, especially the condensation degree or the presence of 3 or more aromatic ring structures.
- The use of linear functions between conversion and products is a simple but effective way to obtain the maximum gasoline potential point. This parameter was correctly estimated by the model and its use as a crackability index was found independent from reaction conditions, catalytic unit and catalyst. In conclusion, even an absolute devoid of detailed physicochemical and catalytic reactivity data (typical at refinery because of logistic and economic inconveniences), can be solved by models based on basic feedstock properties.
ACKNOWLEDGMENTS
The authors express their gratitude to the Catalysis Laboratory Team of Instituto Colombiano del Petróleo (ICP), led by Carlos Medina (Chemist MSc), for the cooperation provided and the conjoint work in the MAT microactivity tests used in this research. Special gratitude to researchers Carlos Baldrich (Chemist MSc) and Uriel Navarro (Chemist PhD) for their advising and valuable knowledge that enriched the content of this document.
ANNEX
Characterization factor (KUOP). [Referred by Algelt & Boduszinski (1994)]: This factor determines the dominant hydrocarbon family in the composition of a petroleum fraction. Values equal to or greater than 12 indicate paraffinic nature. Values equal to or less than 11,5 indicate aromatic nature and values of between 11,5 and 12 indicate a naphthenic or intermediate nature.
KUOP = (CABP +459,7)1/3/SG (1)
SG = Specific gravity at 60 °F
CABP = Cubic Average Boiling Point in °F
Correlation Index (IC). [Referred by Speight (1991)]: This index was developed by the U.S.B. of Mines, based on the graph of specific gravity and the reciprocal value of the boiling point (K) of pure hydrocarbons. It indicates the type of hydrocarbon prevailing in a feedstock, using a wider range of values than the KUOP factor and marked by the most paraffinic structure (the hexane with a IC of 0) and the most aromatic structure (the benzene with a IC of 100). The cyclohexane have a IC value of 50.

MeABP = Mean Average Boiling temperature in K
ndM Method. [Referred by Algelt & Boduszinski (1994)]: It estimates the aromatic carbon (%Ca), para-ffinic carbon (%Cp), and naphthenic carbon (%Cn) distribution from the refraction index (n), density (d), and molecular weight (M). The following correlations must be used with measurements at 70°C.
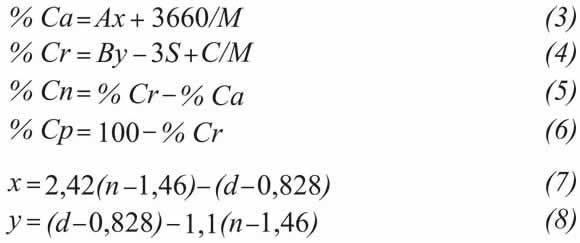
x > 0, A = 410
x < 0, A = 720
y > 0, B = 775 y C = 11500
y < 0, B = 1440 y C = 12100
S= Sulfur content (% weight)
Molecular Weight (MW). According to the UOP 375-86 method.
MV = anti log [IxM+J+(L/M)] (9)
I = -0,000067214393D2-0,0013189667D+ 0,002322975 (10)
J = 1,496307D2-2,4028499D+2,7013135 (11)
L = -166,84095D2-240,43988D-92,008149 (12)
M (MeABP) = Mean Average Boiling Point in °F
C (CABP) = Cubic Average Boiling Point in °F
D = Specific gravity at 60 °F
REFERENCES
Algelt, K. H. & Boduszinski, M. M. (1994). Composition and analysis of heavy petroleum fractions. 115, 161-168. New York: Marcel Dekker Inc. [ Links ]
Ancheyta, J., López, F. & Aguilar, E. (1998). Correlations for predicting the effects of feedstock properties on catalytic cracking kinetic parameters. Ind. Eng. Chem. Res. , 37 (12): 4637-4640. [ Links ]
ASTM D3907-03. Testing Fluid Catalytic Cracking (FCC) Catalysts by Microactivity Test (2003). [ Links ]
Baldrich, C. A. & Novoa, L. A. (2007). Detailed chemical characterization of petroleum middle fractions by chemometrics analysis of their ultraviolet spectrum. CTYF- Ciencia, Tecnología y Futuro. 3(3): 173-190. [ Links ]
Bollas, G. M., Vasalos, I. A., Lappas, A. A., Latridis, D. K. & Tsioni, G. K. (2004). Bulk molecular characterization approach for the simulation FCC feedstocks. Ind. Eng. Chem. Res. , 43 (13): 3270-3281. [ Links ]
Dewachtere, N. V., Santaella, F. & Froment, G. F. (1999). Application of a single-event kinetic model in the simulation of an industrial riser reactor for the catalytic cracking of vacuum gas oil. Chem. Eng. Sci., 54 (15-16): 3653-3660. [ Links ]
Fisher, I. P. (1990). Effect of feedstock variability on catalytic yields. Applied Catalysis, 65: 189-210. [ Links ]
Lerner, B. A. & Himpsl. (1997). Feed molecular properties explain cracking results. Oil Gas, 95 (48): 61-67. [ Links ]
Mariaca, E., Rodriguez, S. & Maya, R. (2003). Reactive hydrogen content: A tool to predict FCC yields. Int. J. Chem. React. Eng., 1: A46. [ Links ]
Ng, S. H., Wang, J., Fairbridge, C., Zhu, Y., Yang, L., Ding, F. & Yui, S. (2004). Study of Canadian FCC feeds from various origins and treatments. 2. Some specific cracking characteristics and comparisons of products yields and qualities between reactor and MAT Unit. Energy & Fuels, 18 (1): 172-187. [ Links ]
Reina, E., Osorio J. V. (2005) Modelamiento teórico de un reactor de lecho fijo en estado no estacionario para la ruptura catalítica y la desactivación de cargas. Tésis de Grado: Escuela de Ingeniería Química. Universidad Industrial de Santander. Bucaramanga, Colombia. [ Links ]
Sheppard, C. M., Al-Alloush S. S., Green, J. B., Zagula, E. J., Young, L. L. & Wisecarver, K. D. (2003). Relating feedstocks composition to product slate and composition in catalytic Cracking. 6. Feedstocks derived from Merey, a Venezuelan crude. Energy & Fuels, 17 (5): 1360-1366. [ Links ]
Shi, T. P., Xu, Z. M., Cheng, M., Hu, Y. X. & Wang R. A. (1999). Characterization index for vacuum residua and their subfractions. Energy & Fuels, 13 (4): 871-876. [ Links ]
Speight, J. (1991). The chemistry and technology of petroleum. New York. Marcel Dekker Inc, 199-201. [ Links ]
UOP 375-86. (1986). Characterization Factor and Estimation of Molecular Weight of Petroleum Oils. Method 375-86. [ Links ]
Voltz, S. E., Nace, D. M. & Weekman, V. W. (1971). Application of a kinetic model for catalytic cracking - Some correlations of rate contants. Ind. Eng. Chem. Process Des. Dev., 10 (4): 538-541. [ Links ]
Xu, C., Gao, J., Zhao, S. & Lin, S. (2005). Correlation between feedstock SARA components and FCC product yields. Fuel, 84 (6): 669-674. [ Links ]

