


Services on Demand
Journal
Article
 English (pdf)
 Article in xml format
 Article references
 Send this article by e-mail
Indicators
-
 Cited by SciELO
 -
 Access statistics
Related links
-
 Cited by Google
 -
 Similars in
SciELO
Similars in
SciELO -
 Similars in Google
Share

 Permalink
CT&F - Ciencia, Tecnología y Futuro
Print version ISSN 0122-5383On-line version ISSN 2382-4581
C.T.F Cienc. Tecnol. Futuro vol.4 no.1 Bucaramanga Jan./July 2010
e-mail: cbaldrich@intercable.net.co lnovoa@intercable.net.co alexis.bueno@ecopetrol.com.co
(Received, April 25, 2009; Accepted May 27, 2010)
* To whom correspondence may be addressed
ABSTRACT
In this paper a comparison is made between the performance of models developed by applying chemometric analysis to NIR and UVVIS spectral data obtained from feedsctock samples corresponding to the different Ecopetrol S.A., Barrancabermeja Refinery FCC units for predicting some important physicochemical properties. The results show the utility of both methodologies here evaluated to follow up the quality of these types of refinery streams and present the advantages and disadvantages of each methodology for predicting the feedstock properties here evaluated.
Palabras clave: chemometrics, feedstock, NIR, UVVIS, spectroscopy.
RESUMEN
En este artículo se hace una comparación entre el desempeño de modelos desarrollados aplicando el análisis quimiométrico a la información espectral en la región del infrarojo cercano (NIR) y en el ultravioleta visible (UVVIS) para predecir algunas de las más importantes propiedades fisicoquímicas de las cargas al proceso de ruptura catalítica. Las muestras utilizadas se obtuvieron directamente de las diferentes unidades de ruptura catalítica en lecho fluidizado (FCC) que posee Ecopetrol S.A., en su refinería de Barrancabermeja. Los resultados muestran la utilidad de las dos metodologías aquí evaluadas para hacer un seguimiento a la calidad de estos tipos de corrientes de refinería y presenta las ventajas y desventajas de cada metodología para predecir las propiedades fisicoquímicas aquí evaluadas.
Key words: Quimiometría, carga, infrarojo cercano, espectrofortometría ultravioleta visible.
INTRODUCTION
The development of faster analytical techniques for quality control of process and products has become very important in the petrochemical industry because, generally, the routine analyses are time consuming and require special conditions for their application. In recent years Nir spectrophotometry, combined with multivariate calibration techniques, has been used as a tool to predict simultaneously several chemical and physical properties in crude oil (Falla, Larini, Le Roux, Quina, Moro & Nascimento, 2006) and the different derived products such as gasoline (Bohács, Ovádi, & Salgó, 1998), diesel (Breitkreitz, Raimundo, Rohwedder, Pasquini, Dantas, Joséb & Araújo, 2003), kerosene (Chung, Ku & Lee, 1999) and other products. The development of optical fiber working in NIR range makes it possible to derive on line applications for identifying petroleum products (Chung, Choi & Ku, 1999), controlling distillation processes (Pasquini & Scali, 2003) and catalytic reforming units (Xiaoli, Hongfu & Wanzhen, 2005). NIR on line applications for light and middle petroleum products (Zanier-Szydlowski, Quignard, Baco, Biguerd, Carpot & Wahl, 1999) do not require sample preparation and are easily developed, but a sample pretreatment to the working conditions of the spectrophotometer is a required step (filtering and temperature conditioning). For heavier samples like FCC feedstocks, it is often difficult to develop on line applications due to the viscosity of these highly colored samples which contaminate the sample cells and the sample pretreatment systems. Nuclear magnetic resonance NMR is another technology that competes with NIR for online applications (Gilbert, Bueno & Lima, 2003).
On the other hand, UV spectroscopy has been used for hydrocarbons type estimation in light gas oils and diesel fuels (Wentzell, Andrews, Walls, Cooley & Spencer, 1999), for monitoring the naphthalene content in jet fuel (ASTM D 1840, 2007), for complex aromatic systems characterization (Loppnow, Shoute, Schmidt, Savage, Hall & Bulmer, 2004), for crude oil classification and evaluation (Evdokimov & Losev, 2007) and to analyze and predict chemical composition of FCC feedstocks (Baldrich & Novoa, 2007). Unfortunately, this technology could not be applied for on line monitoring because of the sample preparation requirements.
Operational analysis of FCC industrial units requires knowing at least the following variables of the feedstocks: microcarbon residue for the heat balance, nickel and vanadium content for defining the catalyst addition rate to the unit, basic nitrogen for estimating the partial deactivation of the catalyst and sulphur content to estimate the amount of sulfur in the regenerating flue gas.
Most of the analytical tests for characterization of FCC feedstocks are performed at the laboratory scale using standard test methods that are time consuming. It is necessary to determine these properties more quickly for improving refinery operations. This requirement has stimulated the development of alternative methods that allow obtaining this information more quickly. NIR spectrometry has been considered here as an alternative because it meets these needs and requires no sample pretreatment.
Authors of this paper have been working with UVVIS spectrophotometry to obtain some of the chemical properties of this type of sample but up to this time no models for predicting the above mentioned properties have yet been developed.
In this work UVVIS spectrophotometry is used to predict properties required for routine analysis of FCC feedstocks and we compare this technique with the results from NIR spectrophotometry.
EXPERIMENTAL SECTION
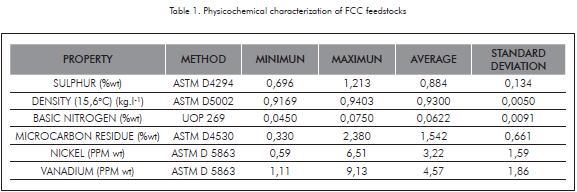
This study includes 89 samples obtained directly from the ECOPETROL S.A. Refinery located at Barrancabermeja where there are 4 different fluid catalytic cracking (FCC) units. One of them is a MODEL IV which processes a mixture of gas oils and a paraffinic reduced crude oil. Another one is the ORTHOFLOW FCC unit whose feedstock is a mixture of vacuum gas oils and demetallized oil (DMO) obtained by an extraction process with light solvents (propane and butanes) of vacuum tower bottoms as feedstock. There is also one UOP 1 FCC unit which processes a blend of vacuum gas oil, paraffinic reduced crude oil, hydrotreated demetallized oil (DMOH), and visbreaking nafta as feedstock. The last one is UOP2 FCC unit which processes paraffinic reduced crude oil, DMOH and vacuum gas oil. Table 1 summarizes some statistical parameters of physicochemical properties (sulphur, density, API gravity, basic nitrogen, microcarbon resid, nickel and vanadium) of the samples used in this research, determined by using standard test procedures.
NIR spectrums were collected over the 3600 to 8000 cm-1 spectral region with an ABB FTLA2000-154 NIR spectrophotometer equipped with a CSi source and a Deuterated triglycine sulfate (DTGS) detector. Each NIR spectrum corresponded to an accumulation of 32 scans with a 4 cm-1 resolution and using an optical path length of 0,5 mm. For NIR analysis, there was no any sampling preparation step. The temperature of the measurement cell was maintained at 40°C during the experiments. The UVVIS spectrum was obtained in a HP8453 spectrophotometer with a diode arrangement detector. Spectrums were obtained over solutions of the samples in cyclohexane spectroscopic grade. The thickness of the used sample cells were 1mm or 2mm. All the spectra were normalized taking into account the mass of the analyzed sample and the cell thickness (Baldrich, 2008).
The normalized UVVIS and NIR spectra and the properties of different samples were input to the Unscrambler v.9.7. Partial least squares regression (PLSR) was used as the technique for generating all the predictive models, and principal components analysis (PCA) was performed to determine the discrimination power of NIR and UVVIS techniques.
RESULTS AND DISCUSION
Figures 1 to 4 present the statistical analysis of all the measured properties for all of the sample groups. The graphs show the lower and higher limit for each property. The lower limit of the box corresponds to the highest property values for 25% of the samples and the higher limit is the maximum property value for 75% of the samples. The central line is the average value for each property.
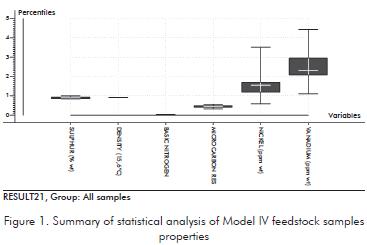
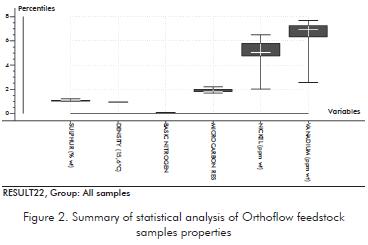
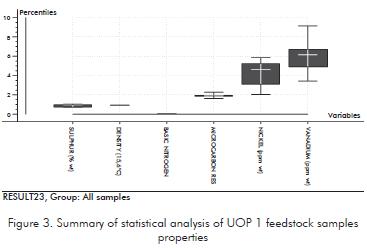
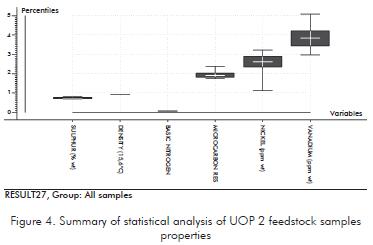
It can be seen on these graphs that the model IV samples have the lowest contents of microcarbon residue and metals (Ni and V). Orthoflow samples are characterized by the highest content of metals. The content of metals of UOP 1 samples is lower than those of orthoflow samples. UOP 2 samples have a lower concentration of metals than UOP 1 samples.
Statistical analysis indicates that Model IV samples have the lowest content of basic nitrogen. UOP 1, Orthoflow and UOP 2 samples have similar concentration of basic nitrogen.
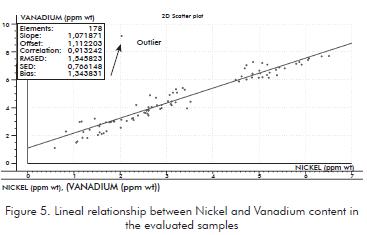
Analytical results were inspected to evaluate the general consistency of the data. The interdependence between properties was determined. The only one found was that between Nickel and vanadium content. Figure 5 shows the correlation between these two variables. One of the samples was an outlier and was not taken into account in developing the prediction models for the content of metals.
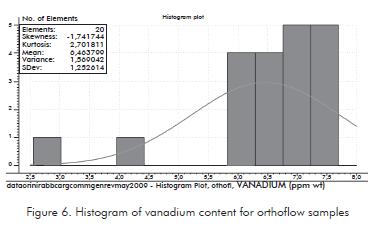
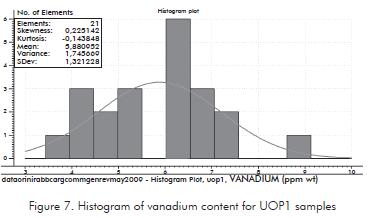
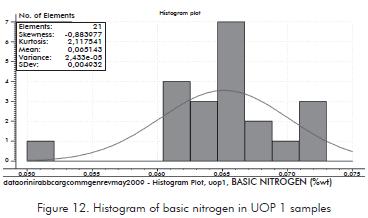
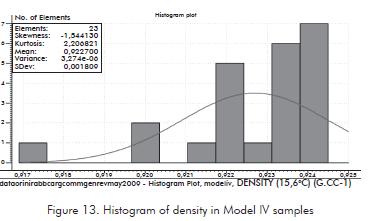
Histograms for the different properties for all of sample were plotted to assess the data consistency. Extreme samples that were different from the average were neglected in the development of the models.
Histograms for the different properties for all of sample were plotted to assess the data consistency. Extreme samples that were different from the average were neglected in the development of the models.
Figures 6 to 13 are examples of these type of graphs used for data consistency analysis. For example in Figure 6, 2 samples with vanadium content lower from the average of the Orthoflow samples were neglected in the development of vanadium predicting model. In a similarway, in Figure 7 one UOP 1 sample with a very high content of vanadium was neglected in the model. This sample corresponds to the one observed as outlier in Figure 5.
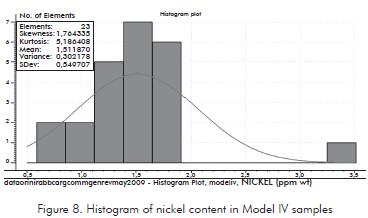
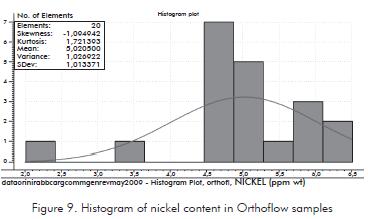
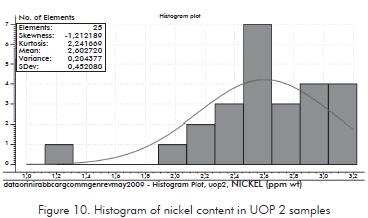
Based on Figure 8, one of the Model IV samples was rejected for developing the model for predicting nickel content. Three more samples were rejected for developing this model from results presented on Figures 9 and 10.
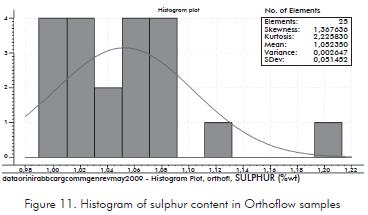
Based on Figure 11 one sample was removed for developing and testing the Sulphur content models. Taking into account the results presented in Figure 12 one sample was removed for developing and testing basic nitrogen predictive models.
Finally, based on Figure 13 results one sample was removed for developing and testing density predictive models.
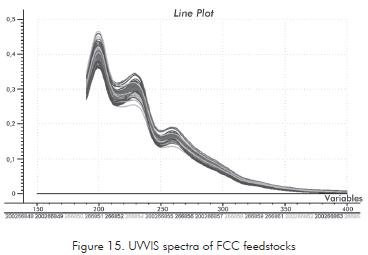
Figures 14 and 15 show the NIR and UVVIS spectra of the samples used in this research. According to these graphs UVVIS spectra show more leverage than does NIR spectra.
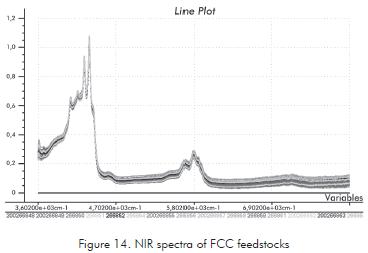
In NIR spectra bands related to combination and overtones of C-H bonds in the different compounds (paraffins, cycloparaffins, aromatics and resins) are observed.
The bands observed in UVVIS spectra are related to different aromatic compounds (mono, di, tri, tetra and more complex aromatics) present in the samples.
Principal component analysis was performed from the whole UVVIS spectra and from the region 3983 to 4412 cm-1 of the NIR spectra. The score plots obtained by this technique are shown in Figures 16 and 17 for UVVIS spectral data and NIR spectral data respectively.
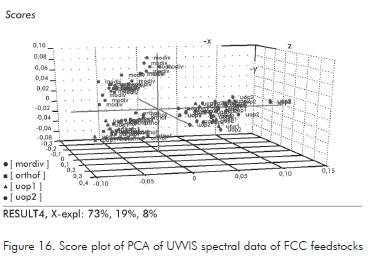
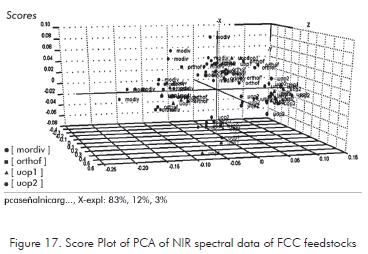
Inspection of these figures shows better discrimination between the lighter feedstocks (model IV) and the others by Uvvis spectrophotometry. In Figure 16, Model IV samples, appears as a separated cluster whilst in Figure 17 they appear together with orthoflow samples. Four clusters appear in this figure indicating an important mixing of samples in the different clusters. For example orthoflow samples appeared in two clusters together with Model IV samples in one of them and with UOP1 samples in the other. Two separated clusters also appear in this figure which contains samples of UOP1 and UOP2 feedstocks.
For the development and testing of the predictive models, samples were arranged in two sets: the calibration and validation data sets the first one with 45 samples and the second one with 44 samples. Both of the signals (NIR and UVVIS) were correlated with the properties of the feedstocks using the Unscrambler software v.9.7. Models were developed by PLS using the options cross validation and center data. All the available samples were sorted in ascending order by microcarbon residue content using the Unscrambler software. Samples with odd number in this arrangement were selected for the calibration data set and samples with even number were used for the validation data set.
All the statistical results that indicate the performance of the different models are presented in Table 2 which shows the square of correlation coefficient for calibration and prediction, the number of components required to explain the data variance, the Root mean Square error of calibration (RMSEC) and the Root Mean Square Error of Prediction (RMSEP). These data were obtained using the developed model to predict all the calibration data set samples as unknown samples by the cross validation procedure. RMSEC was interpreted as the average error of calibration and RMSEP was interpreted as the average error of prediction.
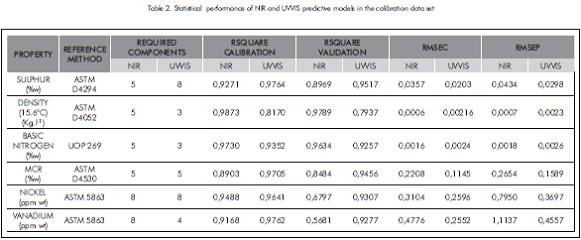
The best models were obtained without making any additional signal pretreatment to centering data that is a default option of the Unscrambler software.
According to the data presented in Table 2, both UVVIS and NIR models have high values of R squared correlation for calibration and prediction for Sulphur content, Microcarbon residue and basic nitrogen prediction. This indicates that in all the cases there is a strong correlation between the spectra and the property.
The calibration and validation errors of both methods using the calibration data set are lower than the analytical reproducibility defined in Table 3 for Sulphur content prediction at the different levels shown in Table 1. UVVIS model for predicting Microcarbon residue shows errors near the standard analytical reproducibility for the lower level indicated in Table 1. Nevertheless this method may be used with confidence for higher levels of Microcarbon residue in the samples. The analytical reproducibility values were calculated using the equations given in the standard methods that were previously reported (Baldrich, 2008).
The variation between Root mean Square error of calibration (RMSEC) and RMSEP in Table 2 shows the robustness of the models. Metals predictions by the NIR models presented the higher relative difference between RMSEC and RMSEP. This indicates that these models are the least robust of all the evaluated models. UVVIS models for predicting the content of metals are stronger and show a smaller variation in these parameters.
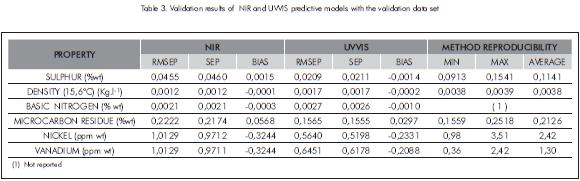
Table 3 and Figures 18 to 23 show the results obtained when the models were applied to samples not contained in the calibration data set. The RMSEP values in Table 3 are mostly higher than those in Table 2. The RMSEP values of Table 3 could be considered as the expected errors when the methods are applied to routine sample analysis.
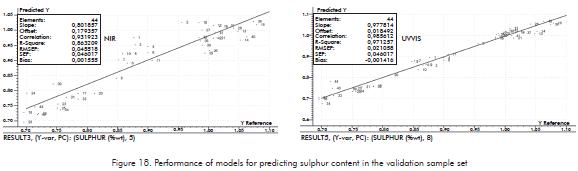
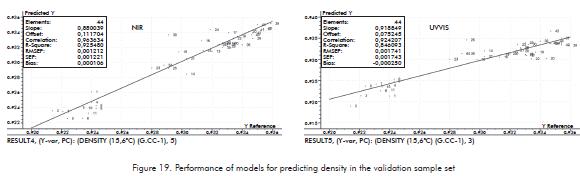
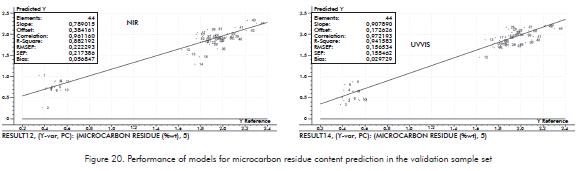
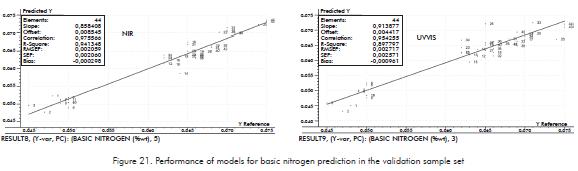
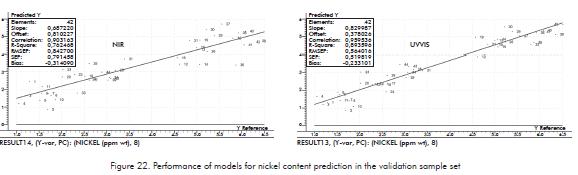
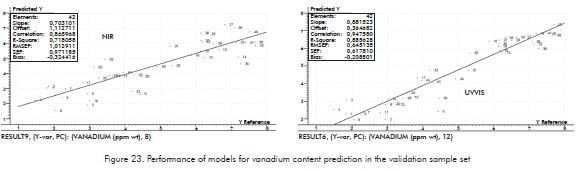
From the tabulated data of validation results (See Table 3), it was observed that UVVIS method gave the lower values of RMSEP for sulphur, microcarbon residue, Nickel and Vanadium. NIR models give lower RMSEP for density and basic nitrogen.
As it was pointed out before, metals prediction models by NIR have a lower R squared value in the parity plots and also has the highest RMSEP values. The limitations of NIR models for predicting metals are related to the sensitivity of NIR to these properties. Also the bias reported in Table 3, indicates that the metal predicted values are systematically different from to the measured values. Use of these methods would need a bias correction.
Table 4 shows the relationship between measured value of the properties specified on Table 1 and RMSEP values of the same properties tabulated in Table 3. Since RMSEP represents the prediction errors it is expected that the prediction accuracies increase at higher value of the relationships between measured value and RMSEP. This is observed for sulphur, density and basic nitrogen predictions using the both of the methods evaluated at the different measurement levels used in this research. For microcarbon residue MCR contents near 0,35%w, the relationships are 1,5 and 2,1 for NIR and UVVIS models respectively indicating predictions of low accuracy. Where the measured values are higher (higher than 1,5% w), the accuracy of the predictions increase for both of the methods.
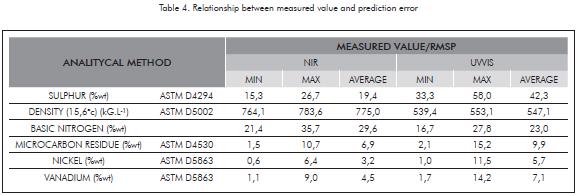
Metals contents are predicted with low accuracy. According to the tabulated values for metal content near 1 ppm the expected relative errors could be higher than 100% for NIR models. At higher level (higher than 5 ppm) the expected relative prediction error is acceptable. UVVIS models for predicting metals (Ni and V) show better accuracy in Table 4, but are limited for low metal content as NIR models.
Because the average expected errors for metals content by NIR are around or greater the analytical reproducibilities given in Table 3, it is recommended that this method be used for following trends of differences of these properties but not as standard test methods. UVVIS models could be used with confidence for predicting metals content of samples with contents of nickel and vanadium of the order of 3 ppm or higher.
Comparing the RMSEP values obtained in the validation step with the analytical reproducibility it could be said that UVVIS and NIR predictive models could be used with confidence to follow the sulphur content, the density, and the basic nitrogen of FCC feedstocks.
MCR predictions by both of the methodologies are expected to be accurate when the MCR content of the samples is at least 1,5% w. For lower concentrations the predictions of this property should be used carefully.
CONCLUSIONS
- Comparing the validation results of the chemometric analysis of UVVIS and NIR spectra of FCC feedstocks, mathematical processing of UVVIS spectrum gives more accurate results in the prediction of Sulphur, Microcarbon residue (MCR), nickel and vanadium of FCC feedstock. The processing of NIR spectrum gives more accurate results in the prediction of basic nitrogen and density.
- Inspection of the data presented in Tables 3 and 4, indicates that the accuracy of the predictions of sulphur content and density by both of the evaluated methodologies are lower than the reproducibility of the respective analytical methods. This indicates that either could used for measuring these properties.
- From the values of prediction errors and reproducibility of the methods presented in Table 3 the UVVIS spectrophotometry may be used as a reliable analytical tool for operational analysis.
- UVVIS spectrophotometry allows better discrimination between different feedstocks than does NIR spectrophotometry as was shown by the PCA analysis of the spectral data.
ACKNOWLEDGMENTS
To the Coordinator of analytical labs of ECOPETROL S.A. - ICP and the Spectroscopy lab staff for providing the spectrum of the samples used in this research. To Ian Fisher for helping us to improve the english version.
REFERENCES
ASTM D1840 (2007). American Society for Testing and Materials. Naphthalene hydrocarbons in aviation turbine fuels by ultraviolet spectrophotometry. Philadelphia, 5pp. [ Links ]
ASTM D4294 (2008). American Society for Testing and Materials. Standard test method for sulfur in petroleum and petroleum products by energy dispersive x-ray fluorescence spectrometry. Philadelphia, 9pp. [ Links ]
ASTM D4530 (2007). American Society for Testing and Materials. Standard test method for determination of carbon residue (micro method). Philadelphia, 20pp. [ Links ]
ASTM D5002- 99 (2005). American Society for Testing and Materials. Standard test method for density and relative density of crude oils by digital density analyzer. Philadelphia, 5pp. [ Links ]
ASTM D5863 (2000). American Society for Testing and Materials. Standard test methods for determination of nickel, vanadium, iron and sodium in crude oils and residual fuel oils by flame atomic absorption spectrometry. Philadelphia. 7pp. [ Links ]
Baldrich, C. (2008). Prediction of physicochemical properties of FCC feedstock by chemometric analysis of their ultraviolet spectrum. CT&F - Ciencia, Tecnología y Futuro. 3 (4), 143-156. [ Links ]
Baldrich, C., & Novoa, L. (2007). Detailed chemical characterization of petroleum middle fractions by chemometrics analysis of their ultraviolet spectrum. CT&F - Ciencia, Tecnología y Futuro. 3 (3), 173-190. [ Links ]
Bohács, G., Ovádi, Z., & Salgó, A. (1998). Prediction of gasoline properties with near infrared spectroscopy. J. Near Infrared Spectrosc, 6: 341-348. [ Links ]
Breitkreitz, M., Raimundo, I., Rohwedder, J., Pasquini, C., Dantas, H., Joséb, G., & Araújo, M. (2003). Determination of total sulfur in diesel fuel employing NIR spectrophotometry and multivariate calibration. Analyst. 128: 1204-1207. [ Links ]
Chung, H., Choi, H., & Ku, M. (1999). Rapid Identification of Petroleum Products by Near-Infrared Spectroscopy. Bull. Korean Chem. Soc, 20: 1021-1025. [ Links ]
Chung, H., Ku, M., & Lee, J. (1999). Comparison of nearinfrared and mid-infrared spectroscopy for the determination of distillation property of kerosene. Vib. Spectrosc, 20: 155-163. [ Links ]
Evdokimov, I., & Losev, A. (2007). Potential of uv-visible absorption spectroscopy for characterizing crude petroleum oils. Oil and Gas Business: Electronic Scientific Journal, 21pp. http://www.ogbus.ru/eng/authors/Evdokimov/Evdokimov_1e.pdf. [ Links ]
Falla, F., Larini, C., Le Roux, G., Quina, F., Moro, L., & Nascimento, C. (2006). Characterization of crude petroleum by NIR. J. Petrol. Sci. and Eng, 51: 127- 137. [ Links ]
Gilbert, W. R., Bueno, A. F., & Lima, F. S. G. (2003). Comparison of NIR and NMR spectra chemometrics for FCC feed online characterization. Int. Symp. on Advances in Fluid Cracking Catalysts (FCC's) Technology, N°6. New York, NY, September 7-11: 48 (2), 220-223. [ Links ]
Loppnow, G. R., Shoute, L., Schmidt, K. J., Savage, A., Hall, R. H., & Bulmer, J. T. (2004). UV Raman spectroscopy of hydrocarbons. Phil. Trans. R. Soc. Lond. A. 362: 2461-2476. [ Links ]
Pasquini, C., & Scali, S. (2003). Real-time monitoring of distillations by near-infrared spectroscopy. Anal. Chem, 75: 2270-2275. [ Links ]
UOP Method 269-10. Nitrogen bases in hydrocarbons by potentiometric titration.Philadelphia. 10pp. [ Links ]
Wentzell, P., Andrews, D., Walls, J., Cooley, J., & Spencer, P. (1999). Estimation of hydrocarbon types in light gas oils and diesel fuels by ultraviolet absorption spectroscopy and multivariate calibration. Can. J. Chem, 77: 391-400. [ Links ]
Xiaoli, C., Hongfu, Y., & Wanzhen, L. (2005). In-line monitoring of several pilot scale catalytic reforming units using a short-wavelength near infrared analyser. J. Near Infrared Spectrosc, 13: 37-45. [ Links ]
Zanier-Szydlowski, N., Quignard, A., Baco, F., Biguerd, H., Carpot, L., & Wahl, F. (1999). Control of refining processes on mid-distillate by near infrared spectroscopy. Oil & Gas Sci. and Technol., 54: 463-472. [ Links ]

