


Services on Demand
Journal
Article
 English (pdf)
 Article in xml format
 Article references
 Send this article by e-mail
Indicators
-
 Cited by SciELO
 -
 Access statistics
Related links
-
 Cited by Google
 -
 Similars in
SciELO
Similars in
SciELO -
 Similars in Google
Share

 Permalink
CT&F - Ciencia, Tecnología y Futuro
Print version ISSN 0122-5383On-line version ISSN 2382-4581
C.T.F Cienc. Tecnol. Futuro vol.4 no.2 Bucaramanga July/Dec. 2010
e-mail: escandoncarlos@hotmail.com lamontesv@unal.edu.co
(Received, Oct. 13, 2009; Accepted, Dec. 9, 2010)
* To whom correspondence may be addressed
ABSTRACT
The naturally fractured reservoirs are attractive potential zones for a successful hydrocarbon prospecting, and the variable density logs (VDL) with Chevron patterns generated by Stoneley waves is a suited tool to characterize fractures.
In this project, a simplified algorithm to evaluate fracture location using reflection coefficients and analysis of attenuation was implemented. It also uses a permeability indicator (Stoneley Slowness added by Permeability) to discriminate permeability in fractures.
The algorithm was tested in a foot hill well of the Colombian west range, detecting a previously known fractured sandstone zone and indicating its permeability. Besides, the algorithm detected other existent fractures zones with low permeability for production. Previous well flow evaluation of the localized fractures characterized them as low or no permeability fractures.
Keywords: deposits, fractures, waves, permeability, sonic log, Llanos foothills.
RESUMEN
Los yacimientos naturalmente fracturados son atractivos potenciales para la prospección de hidrocarburos, y los registros de densidad variable (VDL) con los patrones de flecha generados por las ondas de Stoneley son una herramienta apropiada para caracterizar fracturas.
En este proyecto se implementó un algoritmo que evalúa directamente la localización de las fracturas en pared del pozo mediante coeficientes de reflexión y análisis de atenuación de ondas de baja frecuencia tipo Stoneley, y utiliza la lentitud adicional por permeabilidad de Stoneley como indicador directo de fracturas para discriminar la existencia de permeabilidad en ellas.
El algoritmo fue probado en un pozo del piedemonte de la Cordillera Oriental Colombiana, en una zona de arenisca fracturada, donde localizó e indicó la permeabilidad en una zona de fracturas ya conocida y detectó otras fracturas con permeabilidades poco atractivas para la explotación, las cuales habían mostrado bajas permeabilidades durante la evaluación de flujo del pozo.
Palabras clave: yacimientos, fracturas, ondas, permeabilidad, registros sónicos, piedemonte llanero.
1. INTRODUCTION
The theory of low and high frequency waves propagating in solids with porous saturated by fluids has been well known from the researches done by Biot (1956), who considered rocks as saturated porous skeletons where viscous fluid moves free along interconnected pores. Including anisotropy and viscoelasticity, (Biot, 1962) the theory has been widely accepted and used as basis for sonic log development and interpretation (Tezuka, Endo, Miyairi, & Brie, 1995; Tezuka & Cheng, 1997), being their predictions confirmed under controlled laboratory conditions (Brown, Batzle, Dey-Sakar, & Peeters, 2000; Wisse, Smeulders, & Dongen, 1998).
Stoneley waves were proposed to measure permeability by Rosenbaum (1974), intending to establish the characteristics of an acoustic logging tool based on the behavior of a pulse emitted in a pit fluid surrounded by a porous formation. It was found that trains of low frequency wave (Tube waves, Stoneley waves) were particularly sensitive to changes in fluid transfer conditions between the formation and the well along its wall (permeability changes). In presence of fractures in the borehole wall the Stoneley waves generate chevron patterns losing energy in permeable zones; phenomena that have successfully used in detecting fractures in calcareous formations; but the technique does not behave appropriately in wells drilling sandstone type formations due to imperfections present in their walls.
Cheng-Chuen and Toksoz (1981) studied the propagation of elastic waves in a fluid-filled borehole with a tool in the center producing synthetic acoustic logs and obtaining the equations that govern the dispersive and reflected Stoneley waves. They also found that the effective radius of the well determines the relative amplitude of the generated modes and concluded that changes in the dispersion characteristics of Stoneley waves are relatively small. A conclusive relationship between permeability and wave attenuation in field data was found (Williams, Zemanek, Angona, Denis & Caldwell, 1984), allowing the development of low frequency tools to detect permeability changes. Paillet and White (1984) predicted the relative excitation of various modes (i.e. guided waves) contained in experimental wave fronts, using a single plane layer of fluid between two hemi-spaces, providing velocity dispersion curves similar to those presented in the wall of a borehole filled with fluid. They also conclude that closer the tool diameter greater the dominance of the Stoneley mode, indicating the simplest method of detecting fractures in the borehole wall.
Cheng, Zhang and Burns (1987) related Stoneley wave propagation in a cylindrical well along with in situ permeability (Rosenbaum, 1974), founding that attenuation and dispersion of the phase velocity increases when permeability and porosity increase, and decrease when frequency increases; they also detected that the change in the Stoneley wave amplitude is more sensitive to the change of permeability than to phase velocity change.
Hornby, Johnson, Winkler, & Plumb (1989) implemented the analysis technique of reflection in presence of both horizontal and dipping fractures, considering the aperture of fracture constant along it and assuming a rigid formation compared with fluid in fractures. In experimental assays they checked the relationship between the magnitude of the reflectivity and the aperture of fracture.
Endo, Ito, Brie, Badri, & El-Sheikh (1997) assessed two wells that crossed a fault, using Stoneley waves to evaluate fractures and permeability and shear mode for evaluating cross-dipole anisotropy. Comparing the results with image records they concluded that attenuation and Stoneley reflections are evidence of open fractures and fault zones. They found that modeling Stoneley waves allow identify which reflections and attenuations are due to irregularities in the borehole, and also concluded that anisotropy and images integrated with information provided by Stoneley waves offer a better understanding of fractured reservoirs. A series of numerical and analytical models were developed for use in the interpretation of Stoneley wave reflections obtained from fractures that intersect the borehole (Kosteck, Jonson, Kenneth & Hormby,1998), and also the elasto-dynamic equation that governs tube wave propagation in a borehole intercepted by fractures filled with fluid. Models for single and double fractures in the presence of washouts and breakouts were implemented in finite differences. Analytical models were developed to interpret the Stoneley wave reflections in fractures in the wall of the borehole, calculating aperture and permeability of the fractures. These models assume a rigid formation, irregularities in the well (washouts, breakouts), changes in lithology, effects of elasticity, single and multiple fractures and the effects of viscosity of fluid. It was determined that a rigid formation model is useless to evaluate fracture parameters because overestimate the value of aperture of fractures.
These techniques were mostly developed for calcareous formations deposits uncommon in Colombia where the presence of borehole wall irregularities in clastic formations could lead to misinterpretation.
A simplified algorithm was created to directly evaluate the location of fractures using a direct permeability indicator to determine the existence of permeability in these fractures. The algorithm was tested on a well, located in the foothill of the Colombian Eastern Cordillera that crosses fractured sandstone zones. It allowed identifying a known fracture zone and assessing its permeability. Besides, the algorithm localized other fractures with permeability unattractive to exploration which showed low permeability during borehole flow tests.
The algorithm is not still able to detect fractures in some cases which have been discerned by other techniques.
2. METHODOLOGY
The implemented MATLAB program follows the next sequence: a) Separation of reflected and transmitted Stoneley waves acquired by the tool by means of a running average filter, using a Hamming window to attenuate edge effects, b) Stacking of reflected and transmitted waves to enhance amplitudes and eliminate non-coherent noise. In the multi-receiver approach a first break picking of direct waves is done, then a linear move out to the 8 signals is applied to finally stack the eight wavelets improving the signal-to-noise ratio. The step is applied both to direct and reflected waves, c) Calculation of the reflection coefficients, d) Estimation of energy in the trace, e) Estimation of attenuation factor Q-1 and f) Estimation of Stonely slowness added by permeability. (See Figure 1).
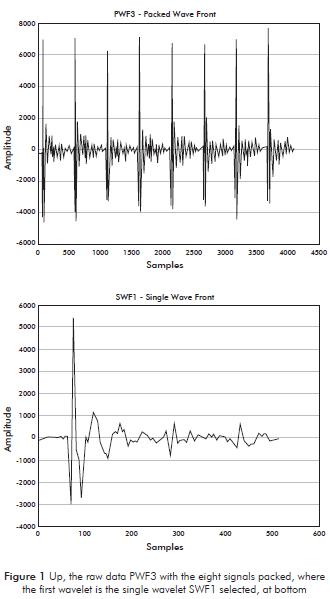
The sequence varies depending on whether the sonic tool has single or multiple receptors with simultaneous processing of Ultrasonic Borehole Imager (UBI) and also of Dipole Shear Sonic Imager (DSI) log. The UBI image processing comprises the orientation and normalization of the image and the equation of amplitudes. A window of 1% of the size of image is used to equalize the color histogram, leaving the image in a single scale. The gross data Packed Waveform PWF3 has eight vectors chained sequentially with the information of eight receptors of the sonic tool, as shown in upper image in Figure 1.
The program was applied to a 600-feet section of an exploration borehole, providing plots of reflection coefficient, energy content in traces, attenuation factor and Stoneley slowness added by permeability. These plots were correlated along with DSI (Stoneley monopolar mode) and UBI logs for interpretation.
The raw data were acquired with a 51 feet sonic tool working in low frequency Stoneley mode at 600Hz with 40μ second sample rate, providing eight 512-samples wavelets. The tool has 35/8 inch diameter and the hole a variable diameter ranging from 5,5 to 21 inch.
Data Structure
The data set includes Ultrasonic Borehole Imager (UBI) to build the well image, Dipole Shear Sonic Imager (DSI) which is the main data to be used by the algorithm, Formation Density Log and Caliper to characterize lithology and imperfections in well's wall, and Additional Data Logs to perform correlations. All these data are transformed from "dlis" to "las" format and stored as matrixes whose structures are described in the Appendix.
3. PROCESSING SEQUENCE
In the single receptor case, the receiver closest to the source is selected to perform the Stoneley wave analysis, here the first wavelet in the PWF3 (bottom image in Figure 1) corresponds to the SWF1 Wavelet. In multiple receptors case the data set stored contains eight signals as shown in at top image in Figure 1.
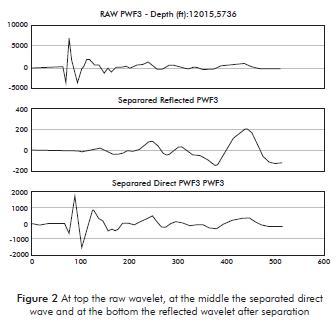
Direct and reflected wavelets separation
Through a 20 samples Moving Average filter applied within a standard Hamming window, the direct wave is enhanced whereas the reflected wave is attenuated. In a second step the reflected wave is enhanced by applying first a 30 samples Moving Average filter followed by a single flank Hamming window expressed by the equation:

Where n is the number of samples k an integer.
The direct and reflected waves provided by the separation step are depicted in Figure 2, where from the raw data at upper image, the direct wave in the middle and the reflected one at the bottom are observed.
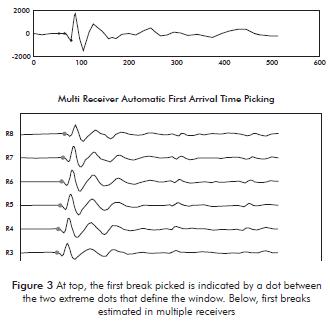
First break picking
The first break picking is performed on the direct wavelet by an automatic procedure. Initially a wavelet transform is applied to establish the limits within which the arrival of the direct wave will be located. This value defines a window where the covariance of the contained samples is calculated. The point where the value of the covariance is strongly deviated from the mean value is considered the first break time. (See Figure 3).
As is known, the Wavelet Transform (WT) captures both frequency and location information (location in time). In order to isolate signal discontinuities, WT uses very short basis functions. At the same time, in order to obtain detailed frequency analysis, WT uses very long basis functions. A way to achieve this is to have short high-frequency basis functions and long low-frequency ones. The wavelet transform decomposed both the directed and reflected wavelet in coefficients at different scales representing low and high frequencies, compressing the signals until they are matched in a time point, which is the upper limit of the window.
The result is shown in Figure 3 where the interval is defined by the two extreme dots whereas the first break time is identified by the dot within the anterior points.
Stacking
This step is applied only in the multiple receptors case. After picked the first break to the eight signals, see bottom image in Figure 3, the slope formed by the eight picked times is calculated and a Linear Move Out (LMO) is applied to finally stack the traces.
Reflection coefficients calculation (RC)
To calculate the reflection coefficients (RC) the Fast Fourier Transform (FFT) is applied separately to the both separated waves, and in the frequency domain the reflection coefficients RC(ω) are calculated by

R(ω) and D(ω) represent the respective reflected and direct waves amplitude spectra. But, because for some frequencies R(ω) may approaches zero these values are replaced with a function of maximum signal, so Equation 2 becomes

Here D*(ω) is the transpose of D(ω), (Hornby et al., 1989). The term provides the maximum peak of the direct wave power spectra and c is a factor, with a value of 1% to guarantee a robust deconvolution. The supplied reflection coefficients series is passed through a Hamming window centered at 600 Hz to taper it in the frequency domain, and the maximum value of these reflection coefficients estimated at a particular depth in the borehole is selected to make a maximum values-depth plot. The bottom image in Figure 4 shows maximum values estimated since 11 500 to 11 160 feet along the well.
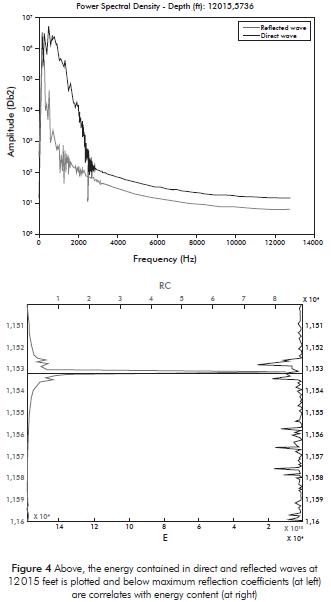
Energy variation calculation (E)
The energy contained in the trace at particular depth (E) is estimated by numerical trapezoidal integration of the area under the power spectra curve providing energy - depth plots. The energy of direct and reflected waves calculated at 12 025 feet of depth in the borehole is observed in the upper image of Figure 4. The maximum reflection coefficient series plotted in depth, estimated in the anterior step, and the energy - depth plots can then be correlated in depth, as observed in bottom image of Figure 4.
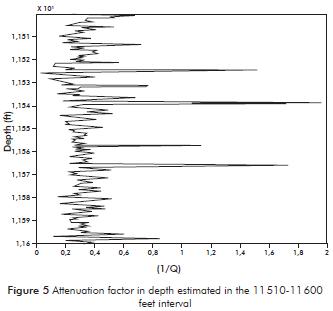
Q-1 Attenuation estimation
The attenuation of a wave is defined as the loss of energy measured over a period of time, observed as decaying amplitudes along the wavelet, it is mainly caused by the geometrical dispersion and energy absorbed by the medium. Although there are others approaches, to estimate a simplest method was applied. It calculates the ratio of two measured contiguous peak amplitudes separated by one period, according to the following approximation:

U(t) is the peak amplitude at time t and U(t+τ) is the peak amplitude a period after. In Figure 5 the Q-1 calculated at different depths since 11 510 to 11 600 feet of the borehole.
Estimation of Stoneley slowness added by permeability
When the Stoneley wave passes from a dry to a permeable area either by porosity or fracturing, the slowness becomes larger and this increment called Stoneley slowness added by permeability is used to estimate and to indicate permeability following the procedure described by Chang, Liu, & Johnson (1988).
In a well of rb radius within a permeable formation with a matrix shear module G, this indicator can be calculated when the frequency is much lower than Biot's critical frequency and the wavelength much greater than the well diameter, using:
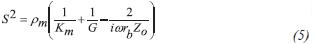
where ρm is mud density, Km volumetric module of the mud, ω = 2πf angular frequency and Zo, impedance. The successive terms are contribution due to fluid expansion, expansion of the borehole wall and fluid movement in pore space.
The impedance is written as:
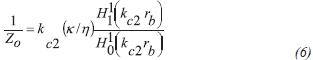
 and
and  are the zero and one order Hankel functions respectively, κ is permeability, η is viscosity and κc2 is the Biot's wave number (Biot, 1962.) The Stoneley slowness can be expressed (Latifa, Tang, & Kuijperl, 2001) as:
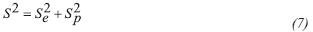
S is the measured Stoneley slowness, Sp is the Stoneley slowness added by permeability and Se is the Stoneley slowness at zero frequency associated to the wave effect in the well and corresponds to the first two terms of Equation 8. So,
Considering that in the DSI tool Se >> Sp we obtain
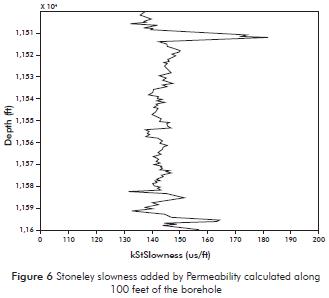
In this way the Stoneley slowness added by permeability Sp is calculated as a direct indicator of permeability, because represents the additional slowness by the intrusion of the wave in the formation's porous or fractures; this added slowness depends on frequency. Figure 6 shows the Stoneley slowness added by Permeability calculated between 11 510 to 11 600 feet of the borehole.
4. ANALYSIS OF RESULTS
The program was applied to a studied interval of 600 feet (11 500 to 12 100 feet depth) of an exploratory borehole, where the zones with permeable fractures were plenty identified and characterized. The well data includes DST pressure tests and cores, besides UBI, Gamma ray, Density, porosity, NPHI and DSI logs.
The program provided reflection coefficient, energy content, attenuation factor and Slowness added by permeability series in depth. These results were displayed together with variable density logs (VDL) and UBI images, as shown in Figure 7 with chevron patterns visible along the reflected WF (third image from left).
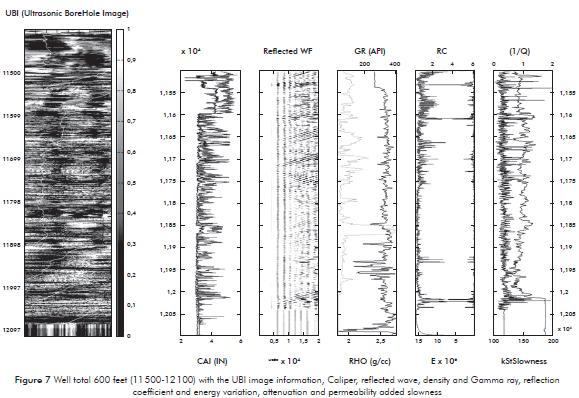
When the Stonely wave passes in front a fracture applies pressure in the crack pulling fluid inside and decreasing the pressure in the borehole, in consequence the attenuation of the direct wave increases, giving rise to a reflected wave.
The chevron patterns appeared in presence of fractures or interfaces where lithology changes (lithic contact). These points were considered in the Table 1, which contains the depths where chevron patterns were identified, caliper information, Gamma ray and Density, Reflection Coefficient, Energy in traces, Attenuation factor, Slowness added by permeability and an description of fracture or lithic contact.
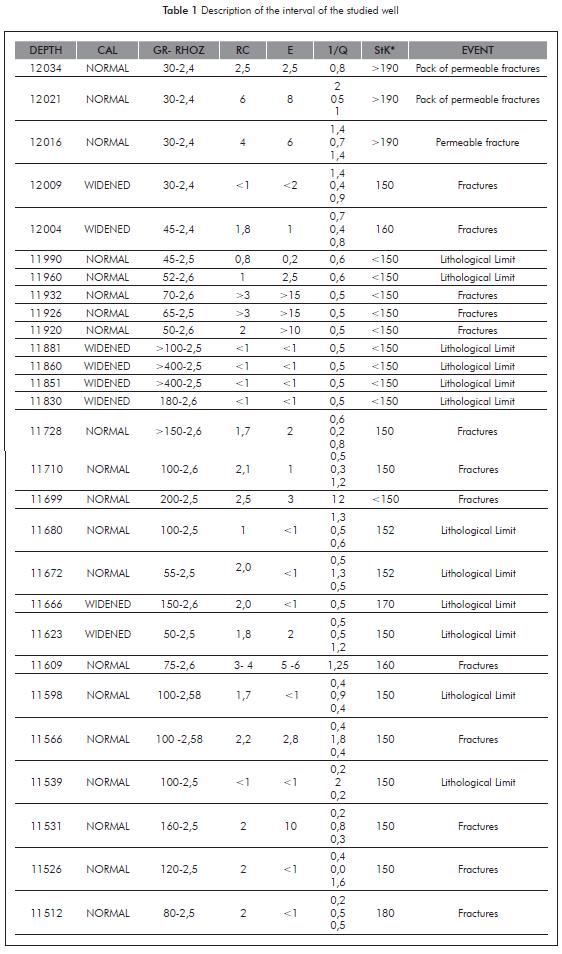
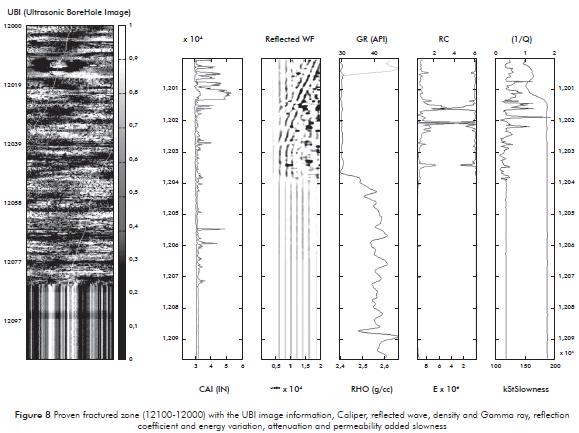
Higher peaks of Reflection Coefficients are associated to fractures and the lower to lithic contact. Highest reflection coefficients values (RC > 4) with high energy (E > 5), abrupt drop in Attenuation factor and highest values in Slowness added by Permeability indicated a fracture zone with high permeability located between 12 010 and 12 030 feet. This identification coincides with packed of great size fractures that produced 4000 barrels of fluid before be cemented and cased, shown in Figure 8.
Small Reflection Coefficients (RC < 2) with small energies (E ≤ 2) and rising Attenuation factors were associated to lithic contacts.
Relatively high Reflection Coefficients (2 < RC < 5) with moderately high energy (3 < E < 5) and mild decreasing Attenuation factors were associated to low quality fractures.
Abnormal behaviors associated to low quality fractures were observed in two intervals. In the 11,932- 11,920 feet interval, with high Reflection Coefficients (2 < RC < 5) and high energy (3 < E < 5) and with decreasing Attenuation factor. The 11 728 - 11 699 feet, with high Reflection Coefficients and high Energy and mild change in Attenuation factor. However, the absence of cores of these intervals impeded to analyze and explain the failures.
5. CONCLUSIONS
- The Stoneley wave approach to detect fractures was imbedded in a program, and applied to a clastic formation in Colombia, providing encouraging results supported by log and core analysis. The software calculated Reflection Coefficient, Energy in traces, Attenuation factor and Slowness added by permeability that used along with borelogs allowed to discriminate fractures and lithic contacts.
- Both high Coefficient Reflection and Energy indicate the presence of fractures, as long as there has been correction for irregularities and changes in lithology, as previously mentioned.
- Changes in the attenuation factor are useful in reconfirming the presence of fractures and contribute in discriminating the effects produced by accentuated lithological limits, as was demonstrated in well logs.
- The existence of significant permeability in the fracture can be determined by using the Stoneley slowness added by permeability; technique that located a great permeability zone, corroborating its usefulness as a permeability indicator. However, since the density or viscosity of the fluid is not known, it was not possible to calculate the permeability value.
- The lithology and presence of washout and washover in boreholes drilling clastic formations would contribute to explain its low use in Colombia.
- The results indicate that the simplified algorithm is effective in detecting fractures with a significant opening and permeability, but not effective in all cases of fissures and is still transparent to the effects of contrast in lithology.
- In spite of promising results, the program could not discriminate fractures detected by other techniques, whence driven research still ongoing.
ACKNOWLEDGEMENTS
The authors would like to express their gratitude to ECOPETROL for supplying the information in respect to this project, which was developed as a Geophysical Master's Degree Thesis in the Geo-Science Department of the Universidad Nacional de Colombia and to Dr. Andrés Mantilla-Zarate who offered the topic and the petro-physics support necessary to carry out this algorithm and lent support during the development.
REFERENCES
Biot, M. A. (1956). Theory of propagation of elastic waves in a fluid saturated porous solid. I. Low frequency range. J. of Accoustical Soc. of America, 28, 168-178. [ Links ]
Biot, M. A. (1962). Mechanics of deformation and acoustic propagation in porous media. J. of Applied Physics, 33, 1482-1498. [ Links ]
Brown, P., Batzle, M., Dey-Sakar, S., & Peeters, M. (2000). Shock Tube Experiments and observation of the slow Biot wave in natural rocks, SEG, 70th Annual Conference. Calgary. 6-11-August. [ Links ]
Chang, S. K., Liu, H. L., & Johnson, D. L. (1988). Low frequency tube waves in permeable rocks, Geophysics, 53, 519-527. [ Links ]
Cheng-Chuen, & Toksoz, M. (1981). Elastic wave propagation in a fluid filled borehole and synthetic acoustic logs, Geophysics, 46, 1042-1053. [ Links ]
Cheng, C. H., Zhang, J., & Burns, D. R. (1987). Effects of in situ permeability on the propagation of Stoneley wave in a borehole, Geophysics, 52, 1279-1289. [ Links ]
Endo, T., Ito, H., Brie, A., Badri, M., & El Sheikh, M. (1997). Fracture and permeability evaluation in a fault zone from sonic waveform data, in Transactions of the SPWLA (Society of Professional Well Log Analysts). Paper R. 13. Thirty-Eighth Annual Logging Symposium, Houston, Tex.: Society of Professional Well Log Analysts, June 15-18. [ Links ]
Hornby, B. E., Johnson, D. L., Winkler, K. W., & Plumb, R. A., (1989). Fracture evaluation using reflected Stoneley wave arrivals, Geophysics, 54, 1274-1289. [ Links ]
Kosteck, S., Jonson, D. L., Kenneth W. W., & Hormby, Br. (1988). The interaction of tube waves with borehole fractures. Part I: Numerical Models. Geophysics, 63, 800-808. [ Links ]
Latifa, Q., Tang X. M., & Kuijperl, A. (2001). Permeability determination from Stoneley waves in the Ara group carbonates, Oman. GeoArabia 6 (4): 649-666. [ Links ]
Paillet, F. L. & White, J. E. (1984). Acoustic modes of propagation in the borehole and their relationship to rock properties, Geophysics, 47, 1215-1228. [ Links ]
Rosenbaum, J. H. (1974). Synthetic micro seismograms: logging in porous formation: Geophyisics, 39, 14-39. [ Links ]
Tezuka, K., Endo, T., Miyairi, A., & Brie, H. (1995). Fast Stoneley modeling and its application for permeability fracture evaluation. Paper of First annual well logging symposium of Japan. Chiba, September 21-22. [ Links ]
Tezuka, K., & Cheng, C. H. (1997). Modeling of low frequency Stoneley wave propagation in irregular borehole. Geophysics, 62, 1047-1058. [ Links ]
Williams, D. M., Zemanek, J., Angona, F. A, Denis, C. L., & Caldwell, R. L. (1984). Society of Professional Well Log Analysts Annual Logging Symposium 25th, New Orleans. Transactions. p. T1-T16. [ Links ]
Wisse, C. J., Smeulders, D. M. J., & Dongen, M. E. H. (1998). Shock tube measurements on water-saturated porous cylinders, Paper presented at the 4th Biot Conference on Poromechanics, Louvain-la-Neuve, Belgium, September 14-16. [ Links ]

