Services on Demand
Journal
Article
 English (pdf)
 Article in xml format
 Article references
 Send this article by e-mail
Indicators
-
 Cited by SciELO
 -
 Access statistics
Related links
-
 Cited by Google
 -
 Similars in
SciELO
Similars in
SciELO -
 Similars in Google
Share

 Permalink
CT&F - Ciencia, Tecnología y Futuro
Print version ISSN 0122-5383On-line version ISSN 2382-4581
C.T.F Cienc. Tecnol. Futuro vol.4 no.4 Bucaramanga July/Dec. 2011
PRESSURE AND PRESSURE DERIVATIVE ANALYSIS WITHOUT TYPE-CURVE MATCHING FOR THERMAL RECOVERY PROCESSES
Freddy-Humberto Escobar-Macualo1*, Javier-Andrés Martínez-Pérez1 and Luis-Fernando Bonilla-Camacho1
1Grupo de Investigación en Pruebas de Pozos, Programa de Ingeniería de Petróleos, Universidad Surcolombiana, Neiva, Huila, Colombia
E-mail: fescobar@usco.edu.co
(Received Feb. 2, 2011; Accepted Apr. 27, 2011)
*To whom correspondence should be addressed
ABSTRACT
In recent years, a constant increase of oil prices and declining reserves of coventional crude oils have produced those deposits of lights to be considered economically unattractive to be produced as an alternative way to keep the world´s oil supply volume.
Heavy oil deposits are mainly characterized by having high resistance to flow (high viscosity), which makes them diffi-cult to produce. Since oil viscosity is a property that is reduced by increasing the temperature, thermal recovery techniques -such as steam injection or in-situ combustion- have become over the years the main tool for tertiary recovery of these oils.
Composite reservoirs can occur naturally or may be artificially created. Changes in reservoir width, facies or type of fluid (hydraulic contact) forming two different regions are examples of two-zone composite reservoirs occurring naturally. On the other hand, such enhanced oil recovery projects as waterflooding, polymer floods, gas injection, in-situ combustion, steamdrive, and CO2 miscible artificially create conditions where the reservoir can be considered as a composite system. A reservoir undergoing a thermal recovery process is typically idealized as a two-zone composite reservoir, in which, the inner region represents the swept region surrounding the injection well and the outer region represents the larger portion of the reservoir. Additionally, there is a great contrast between the mobilities of the two zones and the storativity ratio being different to one.
In this work, the models and techniques developed and implemented by other authors have been enhanced. Therefore, the interpretations of the well tests can be done in an easier way, without using type-curve matching. A methodology which utilizes a pressure and pressure derivative plot is developed for reservoirs subjected to thermal recovery so that mobilities, storativity ratio, distance to the radial discontinuity or thermal front and the drainage area can be estimated. The precedence of the heat source (in-situ combustion or hot injected fluids) does not really matter for the application of this methodology; however, this was successfully verified by its application to synthetic and field examples of in-situ combustion. The point of comparison was the input data used for simulation for the synthetic case and the results from simulation matching and from previous studies for the field cases.
Keywords: Pressure derivative, Well test, Pressure analysis, Composite reservoirs, Diffusivity ratio, Storativity ratio.
RESUMEN
En los últimos años, el constante aumento de los precios del petróleo y la disminución de las reservas de crudo convencional han convertido yacimientos que no eran económicamente atractivos para explotación en una alternativa para mantener el suministro mundial de petróleo.
Los yacimientos de crudo pesado de alta viscosidad se caracterizan principalmente por tener una alta resistencia al flujo, lo que hace que su producción sea apreciable. Puesto que la viscosidad del aceite es una propiedad que se reduce al incrementar la temperatura, las técnicas de recuperación térmica, inyección de vapor o combustión in-situ se han convertido en los últimos años en la principal herramienta para el recobro terciario de crudo pesado.
Además, los yacimientos compuestos pueden ocurrir naturalmente y pueden ser creados de forma artificial. Cuando hay cambios en ancho de yacimiento, facies o tipo de fluido (contacto hidráulico) se forman dos diferentes regiones que son ejemplos de yacimientos compuestos de dos zonas que se presentan naturalmente. Por otra parte, los proyectos de recobro secundario o terciario como inyección de agua, inyección de polímeros, inundación con gas, combustión in-situ, inyección de vapor, inyección de CO2 miscible crean las condiciones artificiales para que un yacimiento se considere como compuesto. Un yacimiento sometido a un proceso de recuperación térmica suele ser idealizado como un yacimiento compuesto por dos zonas, en el que la región interior representa la región barrida alrededor del pozo de inyección y la región externa representa la mayor parte del yacimiento. Además, existe un gran contraste entre las movilidades de las dos zonas, con la relación de almacenamiento siendo diferente a uno.
En este trabajo, se usan los modelos y técnicas desarrolladas e implementadas por otros autores, siendo mejoradas para que las interpretaciones de las pruebas de presión se hagan en forma más fácil, sin emplear curvas tipo. Por tanto, se desarrolla una metodología que utiliza un gráfico de presión y derivada de presión para interpretar pruebas de presión en sistemas sometidos bajo recobro térmico, de modo que se pueden estimar las movilidades, la relación de almacenamiento, la distancia a la discontinuidad radial o frente térmico y el área de drenaje. Lo anterior sin importar de dónde proceda la fuente de calor (combustión en sitio o inyección de fluidos calientes) para la aplicación de esta metodología. Sin embargo, ésta se verificó con éxito por su aplicación en ejemplos sintéticos y reales de combustión en sitio. El punto de comparación fueron los datos de entrada al simulador para para el caso sintético y resultados de simulación y estudios previos para los casos de campo.
Palabras claves: Derivada de Presión, Prueba de pozo, Análisis de presión, Yacimiento compuesto, Relación de movilidad, Relación de difusividad.
RESUMO
Nos últimos anos, o aumento constante dos preços do petróleo e a diminuição das reservas de cru convencional têm convertido jazidas que não eram economicamente atrativas para exploração em uma alternativa para manter o fornecimento mundial de petróleo.
As jazidas de cru pesado de alta viscosidade são caracterizadas principalmente por ter uma alta resistência ao fluxo, o que faz que sua produção seja apreciável. Posto que a viscosidade do óleo é uma propriedade que é reduzida ao aumentar a temperatura, as técnicas de recuperação térmica, injeção de vapor ou combustão in-situ converteram-se nos últimos anos na principal ferramenta para a recuperação terciária de cru pesado.
Além disso, as jazidas compostas podem ocorrer naturalmente e podem ser criadas de forma artificial. Quando há mudanças em largura de jazida, fácies ou tipo de fluido (contato hidráulico) são formadas duas regiões diferentes que são exemplos de jazidas compostas de duas zonas que se apresentam naturalmente. Por outra parte, os projetos de recuperação secundária ou terciária como injeção de água, injeção de polímeros, inundação com gás, combustão in-situ, injeção de vapor, injeção de CO2 miscível criam as condições artificiais para que uma jazida seja considerada como composta. Uma jazida submetida a um processo de recuperação térmica geralmente é idealizada como uma jazida composta por duas zonas, na qual a região interior representa a região varrida em volta do poço de injeção e a região externa representa a maior parte da jazida. Além disso, existe um grande contraste entre as mobilidades das duas zonas, com a relação de armazenamento sendo diferente a uma.
Neste trabalho, são usados os modelos e técnicas desenvolvidas e implantadas por outros autores, sendo melhoradas para que as interpretações das provas de pressão sejam feitas de forma mais fácil, sem utilizar curvas tipo. Portanto, foi desenvolvida uma metodologia que utiliza um gráfico de pressão e derivada de pressão para interpretar provas de pressão em sistemas submetidos a recuperação térmica, de modo que podem ser estimadas as mobilidades, a relação de armazenamento, a distância à descontinuidade radial ou frente térmica e a área de drenagem. O anterior sem importar de onde procede a fonte de calor (combustão in-situ ou injeção de fluidos quentes) para a aplicação desta metodologia. Porém, esta foi verificada com sucesso por sua aplicação em exemplos sintéticos e reais de combustão in-situ. O ponto de comparação foram os dados de entrada ao simulador para o caso sintético e os resultados desimulação e de estudos prévios para os casos de campo.
Palavras-chaves: Derivada de Pressão, Prova de poço, Análise de pressão, Jazida composta, Relação de mobilidade, Relação de difusividade.
1. INTRODUCTION
The pressure behavior of composite reservoir has been extensively considered. Watenbarger and Ramey (1970) modeled a finite-thickness skin region as a composite system and obtained pressure transient behavior for such systems using finite differences. Their solutions correspond to a range of mobility ratio from 0,1 to 3,6. Brown (1985) investigated pressure derivative behavior of composite reservoirs but limited his study to mobility and storativity ratios in the order of 0,4 to 2 and 0,3 to 30, respectively.
Gates and Ramey (1978) showed that the fuel concentration of an in situ combustion oil recovery process is an important parameter which can control the economic results of this kind of operation. It is shown that fuel concentration may be estimated by a number of methods. The total fuel consumption may be divided by the swept volume to obtain field estimates of the fuel concentration.
A complex process like in situ combustion is a non-uniform temperature reservoir within the swept volume. It would be expected that the temperature in the region adjacent to the well would be low after some short time from air injection, while the temperature of the burning front could be less than 1000°F. However, in order to study the most important effects, it was assumed that the swept zone is at some mean temperature. Furthermore, another assumption considered handling the fluid as a liquid of small compressibility, rather than as an ideal or real gas. The rationale for this assumption was the belief that handling the fluid even as an ideal gas would lead to a complexity that would tend to obscure the most important effects under consideration.
As far as the theme of well test interpretation is concerned, some few researches can be named. Satman, Eggenschwiler and Ramey (1980) presented an analytical solution for a two-zone, infinitely large composite reservoir undergoing a thermal recovery process. They specified constant rate as the inner boundary condition and neglect wellbore storage effects. They used the conventional straight-line method as the interpretation technique.
A year later, Walsh, Ramey and Brigham (1981) conducted an analysis of pressure fall-off testing using a simplistic model. They found a long transition zone between two semilog straight lines for the swept and upswept regions obeying a pseudosteady-state behavior. They calculated the swept zone volume using mean values of temperature and pressure by applying the conventional straight-line method.
Barua and Horne (1987) applied the automated type-curve matching to reservoirs subjected to thermal recovery. They reported an improvement in their solution compared to the conventional technique for low mobility ratios.
Ambastha and Ramey (1989), using the Satman et al.'s model, reported for the first time the application of the pressure derivative for the systems under discu-ssion. They used the conventional method and type-curve matching for estimating the mobility ratio and the distance to the front.
The above named models consider that the fluids behind the combustion front are slightly compressible which is incorrect since they are mainly inert gases. Soliman, Brigham and Raghavan (1981). These models also assume that the gas flow is restricted in the region ahead of the combustion front is also incorrect as the gases (mostly Nitrogen) goes through the front and reaches the production wells very quickly, Islam, Chakma and Farouq Ali (1989). In this sense, assuming a large mobility contrast between regions behind and ahead of the combustion front is not really accurate.
In this work, the Satman et al. (1980) model is used to generate the pressure and pressure derivative behavior for different mobility and diffusivity ratios. Therefore, a methodology with no type-curve matching to analyze well test data under thermal recovery conditions is presented.
2. THERMAL RECOVERY PROCESS
According to Stannislav and Kabir (1990), thermal recovery is defined “as a process in which a heat is generated in-situ or injected into the reservoir with the purpose of recovering more oil”. In any of these processes, a region around the injection well is mostly completed and is referred as swept volume.
Both types of thermal recovery processes are characterized by several zones of different properties. For in-situ combustion, there are areas of coke, hot water and light hydrocarbons ahead of the combustion front, followed by an oil bank. The in-situ combustion and steam stimulation technique, as opposed to water inje- ction processes, exhibit the following characteristics, as stated by Stannislav and Kabir (1990):
- The contrast between the mobilities of the two regions is very pronounced.
- The hydraulic diffusivities are signifi cantly different in the two regions.
- The two processes are accompanied by heat transfer.
- The in situ combustion is characterized by a non-isothermal temperature distribution.
Thermal systems exhibit a signifi cant difference in mobility and diffusivity between the two major areas. The length of the transition period is directly dependent on the magnitude of this contrast in mobility.
3. FORMULATION OF THE PROBLEM
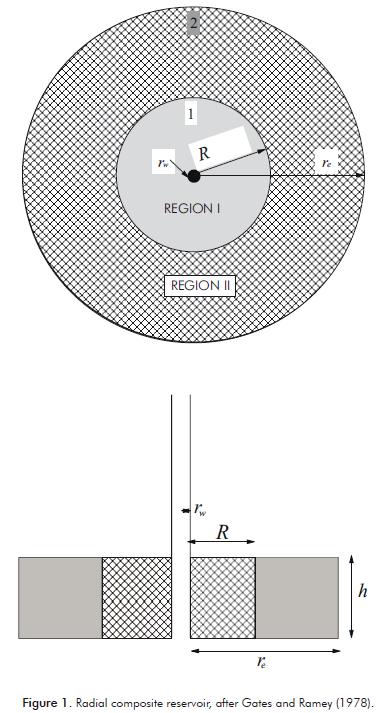
Satman et al. (1980) developed a pressure transient model for a composite reservoir which represents a ther- mal oil recovery process. Figure 1 is an idealization of the type of system under consideration. There is a swept region from the injection sandface to the displacement front. Region I is the area dominated by the injected fl uid, steam, air, or any suitable oxidizing gas in the case of s forward in-situ combustion recovery process, with R being the distance from the injection well to the front. Region II is the zone representing the zone ahead of the front.
There are several implicit assumptions in the development of the model:
- The formation is horizontal, homogeneous and uni- form in thickness.
- The front has an infi nitesimal thickness in radial direction.
- The region behind the front contains only gas, while there is gas fl ow restricted in the region ahead of the front. However, the mobility of the gas is much greater than the liquid phases, and only gas fl ow needs to be considered.
- The fl ow is radial and the effects of gravity and capillarity are negligible.
- The front can be considered stationary throughout the few hours of the testing period.
4. MATHEMATICAL MODEL
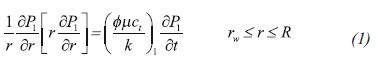
Assuming that the fluid is slightly compressible, the diffusivity equation for two different regions can be written in the following manner:
For Region I:
For Region II:
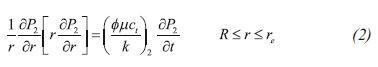
Where R is the distance to the radial discontinuity. The pressure at the radial discontinuity has the same value, with the continuity condition indicating that:
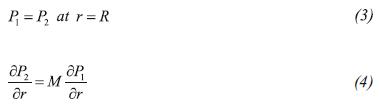
Using the Laplace transformation, Satman et al. (1980) provided an analytical solution to the given problem.
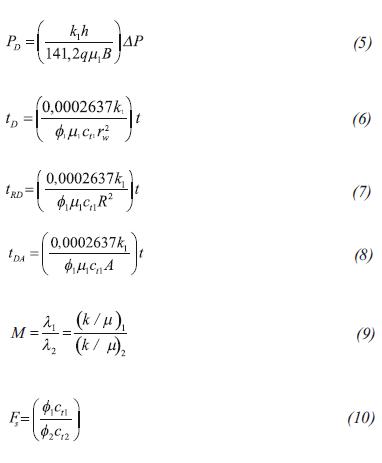
5. FUNDAMENTAL EQUATIONS
The dimensionless quantities used in this work are defined by Satman et al. (1980) as:
6. EFFECT OF MOBILITY AND STORATIVITY RATIO
Figure 2 shows the effect of mobility ratio on the pressure derivative behavior for a fixed storativi-ty of 100. After the end of first radial flow regime, the pressure derivative rises for M >1. During the pseudosteady-state period, the pressure derivative goes through a maximum value above the second radial flow regime corresponding to the outer-region mobility, if mobility ratio, storativity ratio, or both are greater than unity. For large mobility and storativity ratios, the inner region may behave like a closed system for some time during the pseudosteady-state period after the end of the first radial flow. Figure 2 shows the following characteristics:
- The first radial flow ends at tRD = 0,18 for any value of mobility ratio studied.
- There is a long transition period between the end of the first radial flow and the beginning second radial flow for large mobility ratios.
- The transition period is longer for large mobility ratios. This translates into a longer time for the beginning of the second radial flow regime for large mobility ratios.
- The time of the maximum pressure derivative and the magnitude of the maximum pressure derivative are affected by the mobility ratio.
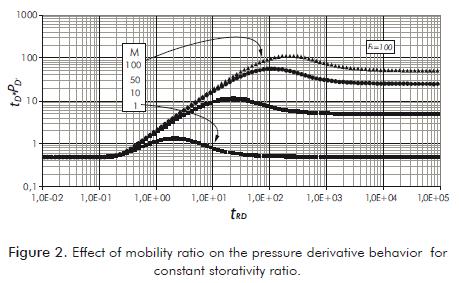
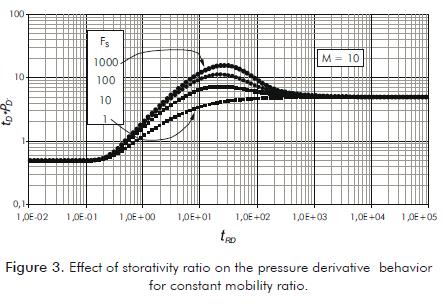
Figure 3 shows the effect of storativity ratio on the pressure derivative behavior for a mobility ratio of 10. For storativity ratios greater than unity, the pressure derivative rises above 0,5 M during the pseudosteady-state period and passes through a maximum value. Thus, a hump takes place in the pressure derivative behavior for mobility and storativity ratios larger than unity.
In Figure 3 the following characteristics are exhibited:
- Storativity ratio does not affect the time to the end of the first radial flow regime corresponding to the inner-region and mildly affects the beginning of the second radial flow corresponding to the outer-region mobility. The transition time between the two radial flows takes approximately three cycles.
- Storativity ratio affects the pressure derivative beha-vior at intermediate times. The storativity ratio mildly affects the time and magnitude of maximum pressure derivative.
7. SWEPT REGION VOLUME
The permeability of the inner zone or swept region is found using the following equation, Tiab (1993):
The pressure derivative during the pseudosteady-state between the first radial flow and the second radial flow is:
Replacing the dimensionless terms, the distance to the discontinuity or thermal front using the pressure derivative of the pseudosteady-state line extrapolated to a time of 1 hour is:
8. OUTER REGION
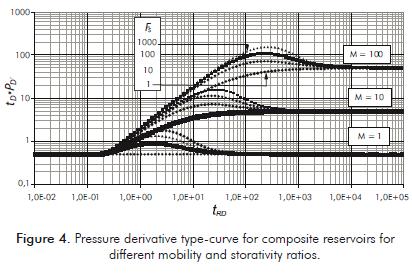
Figure 4 shows a graph of the pressure derivative vs. tRD for several mobilities and storativity ratios in composite reservoirs. The features are:
- The pressure derivative has a maximum in the transition. The developed equations of dimensionless time at this point are:
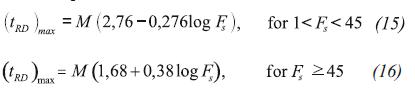
Replacing the dimensionless terms in Equations 15 and 16, the mobility in the outer region according to the value of Fs is given by:
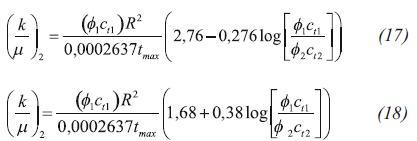

Replacing the dimensionless terms in Equation 19, it yields:
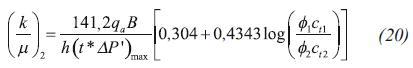
Equating Equations 17 and 20, and solving for Fs (1 < Fs < 45) yields:
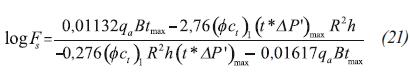
Also, equating Equations 18 and 20 (Fs > 45):
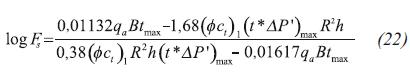
It must be clarified that the calculated value and appropriate of Fs must be in the specified range.
- During the second radial flow regime the pressure derivative is:

From this, the following expression is obtained:
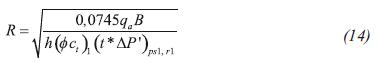
Equating Equations 13 and 23, an equation to calculate the distance to the discontinuity or thermal front with the intersection time between the second radial flow and the pseudosteady-state in the transition is developed as:
For long producing times, the pressure derivative function yields a straight line of unit slope. This line which corresponds to the pseudo-steady state flow regime starts at a tDA equal to 0,2 M/Fs. The equation of this straight line is:
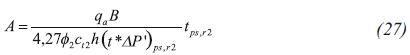
After replacing the dimensionless quantities, an expression to estimate reservoir drainage area is found:
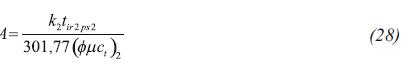
Equaling the equations 26 and 23,
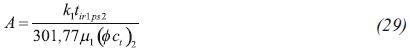
The intersection point of the first radial flow (pre-ssure derivative is 0.5) and the pseudosteady-state line, Equation 26, allows for developing another expression for the estimation of the area:
9. EXAMPLES
Field Example 1
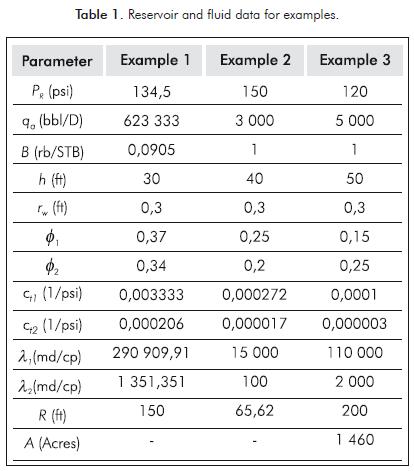
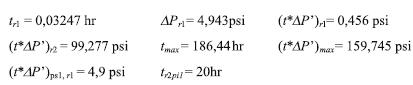
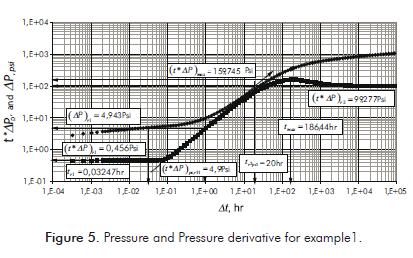
Satman et al. (1980) presented a well test during an in-situ combustion operation. Reservoir, fluids and well data are given in Table 1. Pressure and pressure derivative data are reported in Figure 5. It is required to estimate the mobility in each zone, the skin factor in the inner region and the distance to the combustion front.
Solution
The log-log plot of pressure and pressure derivative against injection time is given in Figure 5. From that plot the following information was read:
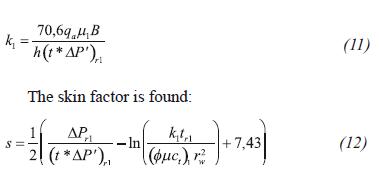
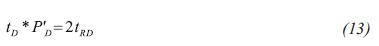
First, the mobility of the inner region is evaluated with Equation 10 and the skin factor with Equation 12.
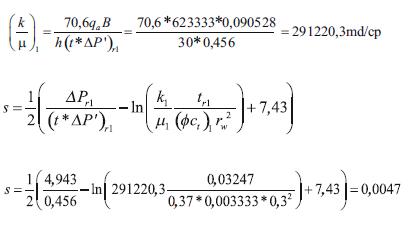
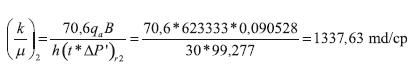
The mobility of the outer region is evaluated with Equation 24.
The distance to the discontinuity or combustion front is found with Equation 25 and re-estimated with Equation 14.
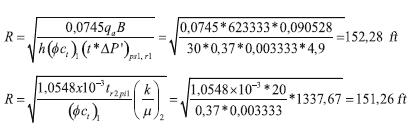
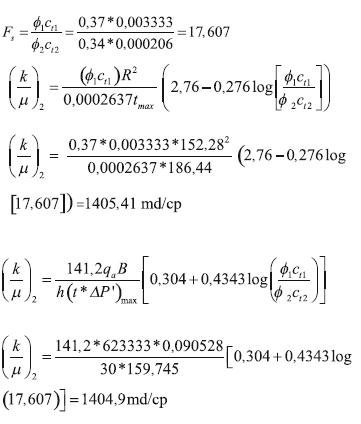
Equation 10 is used to calculate the storativity ratio, and Equations 17 and 20 are used to re-estimate the mobility of the outer region.
Field Example 2
Table 1 also contains reservoir and fluid properties for an example presented by Barua and Horne (1987). Pressure and pressure derivative data are reported in Figure 6. It is required to estimate the mobility in each zone, the skin factor in the inner region and the distance to the combustion front.
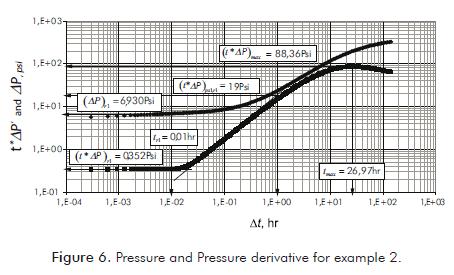
Solution
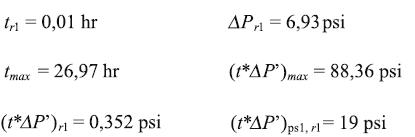
The pressure and pressure derivative log-log plot against injection time is given in Figure 6. From such plot the following information was read:
The calculations are performed in a similar fashion as in example 1. Then, the results and the number of the used equations are provided in Table 2.
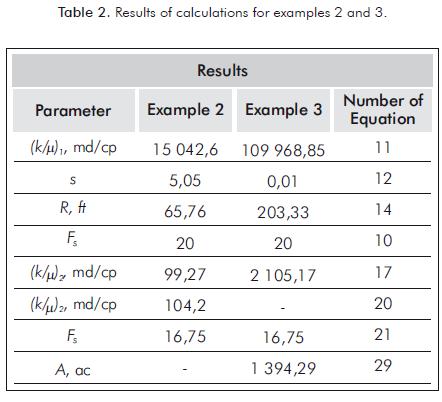
Example 3 (Synthetic)
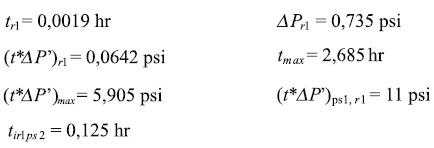
An injection test was simulated using the information from Table 1. Pressure and pressure derivative data are reported in Figure 7. It is required to estimate the mobility in each zone, the skin factor in the inner region, the distance to the combustion front and the drainage area.
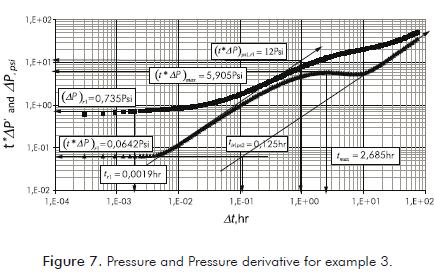
Solution
The log-log plot of pressure and pressure derivative against injection time is given in Figure 7. From that plot the following information was read:
Also, in this example the estimated values and used equations are reported in Table 2.
10. ANALYSIS OF RESULTS
For the synthetic exercise, the results from the proposed methodology matched well the input data used for the simulation as reported in column 3 of table 3. For the field cases, examples 1 and 2, the results agree very well with those reported in the respective studies and also matched well with non-linear regression analysis.
11. CONCLUSIONS
- Pressure derivative behavior for composite reservoirs with mobility and storativity ratio contrast of typical thermal recovery process was studied and a metho-dology to estimate front position, mobility ratios, di-ffusivity ratios and drainage area were introduced and successfully tested with synthetic and field examples. The methodology assumed slightly compressibility ahead of the combustion front which is not the real case for in-situ combustion cases where inert gases are involved. Therefore, a modeling using pseudopressure should be recommended for future work.
- Good transition of pseudosteady-state between the two zones is seen, with a mobility ratio higher than 50 and a storativity ratio greater than 10.
- In the absence of the second radial flow, mobility and storativity ratio are found using the maximum of pressure derivative of the outer region.
ACKNOWLEDGMENTS
The authors are grateful to Universidad Surcolombiana for providing support in the completion of this work.
REFERENCES
Ambastha, A. K. & Ramey, H. J. Jr. (1989). Thermal Reco-very Well Test Design and Interpretation. SPE Formation Evaluation, 4 (2), 173-180. [ Links ]
Barua, J. & Horne, R. N. (1987). Computerized Analysis of Thermal Recovery Well Test Data. SPE Formation Evaluation, 2 (4), 560-566. [ Links ]
Brown, L. P. (1985). Pressure Transient Behavior of the Composite Reservoir. SPE Annual Technical Conference and Exhibition in Las Vegas, Nevada, USA. 22-25. [ Links ]
Gates, C. F. & Ramey, H. J. Jr. (1978). Engineering of in situ Combustion Oil Recovery Projects. 48th California Regional Meeting in San Francisco, California, USA. SPE 7149: 12-14. [ Links ]
Islam, M. R., Chakma, A. & Farouq Ali, S. M. (1989). "State-of-the-Art of In-Situ Combustion Modeling and Operations. SPE California Regional Meeting held in Bakersfield, CA, USA. SPE 18755: 5-7. [ Links ]
Satman, A., Eggenschwiler, M. & Ramey, H. J. Jr. (1980). Interpretation of Injection Well Pressure Transient Data in Thermal Oil Recovery. SPE California Regional Meeting in Los Angeles, California, USA. SPE 8908: 9-11. [ Links ]
Soliman, M. Y., Brigham, W. E. & Raghavan, R. (1981). Numerical Simulation of Thermal Recovery Process. SPE California Regional Meeting held in Bakersfield, CA, USA. SPE 9942: 25-26. [ Links ]
Stannislav, J. F. & Kabir, C. S. (1990). Pressure Transient Analysis. New Jersey: Prentice Hall. [ Links ]
Tiab, D. (1993). Analysis of Pressure and Pressure Derivative without Type-Curve Matching: 1- Skin and Wellbore Storage. J. Pet. Scie. Eng., 12: 171-181. [ Links ]
Walsh, J. W. Jr., Ramey, H. J. Jr. & Brigham, W. E. (1981). Thermal Injection Well Falloff Testing. SPE Annual Technical Conference and Exhibition in San Antonio, Texas, USA. SPE 10227: 4-7. [ Links ]
Watenbarger, R. A. & Ramey, H. J. Jr. (1970). An Investigation of Wellbore Storage and Skin Effects in Unsteady Liquid Flow: II. Finite Difference Treatment. SPEJ 291-297. [ Links ]
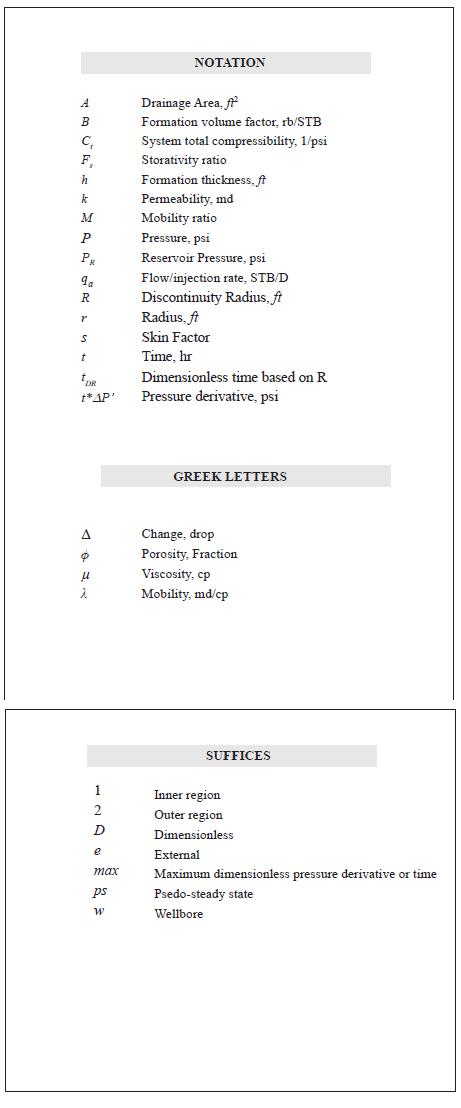
NOTATION