Services on Demand
Journal
Article
 English (pdf)
 Article in xml format
 Article references
 Send this article by e-mail
Indicators
-
 Cited by SciELO
 -
 Access statistics
Related links
-
 Cited by Google
 -
 Similars in
SciELO
Similars in
SciELO -
 Similars in Google
Share

 Permalink
CT&F - Ciencia, Tecnología y Futuro
Print version ISSN 0122-5383On-line version ISSN 2382-4581
C.T.F Cienc. Tecnol. Futuro vol.4 no.5 Bucaramanga Jan./June 2012
2Geoscience Dept., Universidad Nacional de Colombia, Bogotá, Cundinamarca, Colombia
ABSTRACT
The Llanos basin is the most prolific of the Colombian basins; however few stratigraphic plays have been explored due to the uncertainty in determining the lithology of the channels. Inside a migrated 2D section, a wide channel was identified inside a prospective sandy unit of the Carbonera Formation, composed by intercalations of sand and shale levels, and considered a main reservoir in this part of the basin. However, the lithology filling the channel was unknown due to the absence of wells. To infer the channel lithology, and diminish the prospective risk a model based pre-stack seismic inversion was proposed. However, without well logs available along the line, the uncertain initial model diminishes reliance on the inversion. To circumvent this impasse, a seismic inversion with a genetic algorithm was proposed. The algorithm was tested on synthetic seismograms and real data from an area of the basin, where well logs were available. The error analysis between the expected and the inverted results, in both scenarios, pointed out a good algorithmic performance. Then, the algorithm was applied to the pre stack data of the 2D line where the channel had been identified.
According to the inverted results and rock physics analysis of wells near the seismic line with comparative geology, classified the channel was described as to be filled by silt, shale and probably some levels of shaly sands, increasing the exploratory risk because this lithology has low porosity and permeability, contrary to the producing reservoirs in neighbor fields, characterized by clean sands of high porosity.
The algorithm is useful in areas with few or no borehole logs.
Keywords: Seismic inversion, Channel lithology, Genetic algorithm, Llanos basin.RESUMEN
La cuenca Llanos es la más prolífica de Colombia, sin embargo pocos "plays" estratigráficos han sido explorados debido a la incertidumbre en determinar la litología en esos canales. En una sección 2D migrada se identificó un canal ancho en una unidad arenosa prospectiva de la Formación Carbonera que está compuesta de intercalaciones de arenas y lutitas, y es considerada un importante reservorio en esta parte de la cuenca. Sin embargo la litología del canal era desconocida debido a la ausencia de pozos.
Para inferir la litología del canal y aminorar el riesgo exploratorio se propuso una inversión pre apilada basada en modelo. Sin embargo, sin registros de pozo sobre la línea, el incierto modelo inicial disminuía la confiabilidad en el resultado de la inversión. La solución alterna fue usar un algoritmo genético para la inversión de datos sísmicos pre-apilados.
El algoritmo se probó con sismogramas sintéticos y datos sísmicos de otra zona de la cuenca que tenía registros de pozo. El análisis de error entre los valores esperados y observados de la inversión, en ambos escenarios, indicó un buen desempeño. Luego se aplicó en la inversión de los datos sísmicos de la zona 2D donde se identificó el canal. De acuerdo con los resultados de la inversión y el análisis de física de rocas en pozos cercanos que poseen una geología comparable, se discriminó la litología del canal como limolitas y lutitas, con probables niveles de arenas con alto contenido de arcilla. Este resultado señala un incremento del riesgo exploratorio ya que estas litologías se caracterizan por su baja porosidad y baja permeabilidad, lo que contrasta con los reservorios productores en los campos cercanos que están compuestos por arenas limpias de alta porosidad.
El algoritmo es útil en zonas con escasa o nula información de pozo.
Palabras clave: Inversión sísmica, Litología de canales, Algoritmo genético, Cuenca Llanos Orientales.
RESUMO
Abacia Llanos é a mais prolífica da Colômbia, entretanto poucos "plays" estratigráficos têm sido explorados devido à incerteza em determinar a litologia nesses canais. Em uma seção 2D migrada identificou-se um canal largo em uma unidade arenosa prospectiva da Formação Carbonífera que está composta de intercalações de areias e xistos, e é considerada um importante reservatório nesta parte da bacia. Porém a litologia do canal era desconhecida devido à ausência de poços.
Para inferir a litologia do canal e diminuir o risco exploratório se propôs uma inversão pré-empilhada baseado em modelo. Entretanto, sem registros de poço sobre a linha, o incerto modelo inicial diminuía a confiabilidade no resultado do investimento. A solução alterna foi usar um algoritmo genético para a inversão de dados sísmicos pré-empilhados.
O algoritmo provou-se com sismogramas sintéticos e dados sísmicos de outra zona da bacia que tinha registros de poço. A análise de erro entre os valores esperados e observados da inversão, em ambos cenários, indicou um bom desempenho. Logo se aplicou na inversão dos dados sísmicos da zona 2D onde se identificou o canal. De acordo com os resultados da inversão e a análise de física de rochas em poços próximos que possuem uma geologia comparável, discriminou-se a litologia do canal como siltitos e xistos, com prováveis níveis de areias com alto conteúdo de argila. Este resultado sinala um incremento do risco exploratório já que estas litologias se caracterizam pela sua baixa porosidade e baixa permeabilidade, o que contrasta com os reservatórios produtores nos campos próximos que estão compostos por areias limpas de alta porosidade.
O algoritmo é útil em zonas com escassa ou nula informação de poço.
Palavras chave: Inversão sísmica, Litologia de canais, Algoritmo genético, Bacia Llanos Orientais.
1. INTRODUCTION
The exploration of traps with stratigraphic components requires the differentiation of clay levels and definition of sand bodies, in order to identify potential reservoirs and caprock. The seismic data possesses information regarding the lithology and fluid content of the rocks through which the waves propagate, described by Zoeppritz's equations, and reported in the works of Koefoed (1955) and Gassmann (1951). This information, contained in the amplitude variation with the offset, can be recovered through the inversion of pre and post stack data (Anderson, 2009). In the Putumayo basin, an inversion by means of multiple attributes estimated the properties of a reservoir, allowing the identification of formation areas and the discrimination of a channel in a transitional environment under the influence of tides (Guerrero, Vargas & Montes, 2010). Stratigraphic traps can be identified by increasing the resolution through the use of spectral inversion (Puryear & Castagna, 2008), which, along with the inversion, would allow the lithological differentiation of these traps, and thus reduce the risk of their exploration. The use of spectral inversion with a genetic algorithm in the Putumayo basin allowed the identification of thin distributary canals in a depositional cycle of the Barco Formation (Castaño, Ojeda & Montes, 2011).
It has been reported that noise generates little effect on pre-stack data inversion and provides reliable results, but it is sensitive to NMO residues and imprecisions in the wavelet estimation. Therefore, an adequate data processing and a careful sampling of the wavelet is suggested (Labat et al., 2005). In addition, the reliable product of a model-based inversion requires an initial model close to the geological model, which can only be guaranteed in the vicinity of the well. This is a nonlinear optimization problem with an irregular objective function.
Optimization methods such as matrix inversion, gradient descent, or conjugate gradient, are likely to get caught up in local minimums, with their success relying largely on the choice of the initial model (Sen, 2006). The genetic algorithms are suitable search methods for global optimization of irregular multimodal functions. They are capable of solving nonlocal, nonlinear optimization problems without the need of calculating derivatives. Moreover, since genetic algorithms are based only on the direct sampling of the area, they avoid any attempt to render the problem linear, thereby removing errors resulting from estimates. The above factors make genetic algorithms particularly attractive to address complex real world problems, including geophysical problems (Mallick, 1999; Rua, Jian-hua, Shuai-qi & Yang, 2009). A comprehensive treatise on genetic algorithms is beyond the scope of this article; hence the consult of specialized books is highly recommended (Mitchell, 1998).
In order to discriminate the lithology of a canal seen in a 2D seismic section on which no well information was available, a genetic algorithm was designed to perform a seismic inversion on the data before stacking, as this does not require any a priori information. The algorithm was tested with synthetic seismograms and real data in another area where there were well logs, and in both scenarios the algorithm showed to be robust when conducting the inversion.
The results of the inversion and the rock physics analysis of some wells in the area, allowed for the discrimination of channel lithology such as siltstones and shale, and probably including some levels of sand with high clay content- a lithology which increases the exploratory risk because of its low porosity and low permeability.
2. GEOLOGICAL SETTING
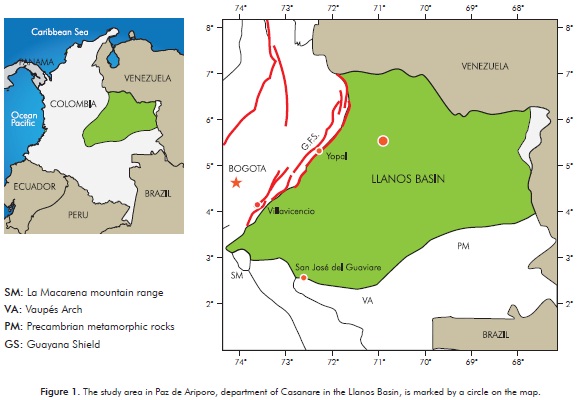
The study area is located in the municipality of Paz de Ariporo, department of Casanare (Figure 1). It corresponds geologically to the central part of the Llanos Basin, which contains several oil fields where production comes from Oligocene units.
The basin contains Paleozoic, Cretaceous, and Tertiary rocks that overlie a Precambrian crystalline basement. The Cretaceous comprises the Une Gacheta and Guadalupe Formations. The Tertiary includes the Barco, Cuervos, Mirador, Carbonera, León and Guayabo Formations; however, the first three units are not found inside the study area.
The unit of interest in the study area is the Carbonera Formation, consisting of intercalations of sand (C1, C3, C5 and C7) and clay (C2, C4, C6 and C8) levels, which act as reservoirs and seals, respectively. Those showing the highest prospectivity are C7, C5 and C3; however, the last two exhibit severe facial changes which increase the exploratory risk. Regionally, the Carbonera Formation lays above the Mirador Formation and below, is the León Formation. In the study area, the Carbonera Formation lies directly on the Guadalupe Formation. The depositional environment of the C8 is of a coastal plain with 30 m average thickness in the study area, while C7 is of fluvial origin, whose sands are channel depositions, and the clay and silt surfaces flooding depositions, with a 90 m thickness. The C6 is a coastal plain of depositional environment with 25 m average thickness. The C5 is of fluvial origin, being the sands channel deposits, and the clay and silt flooding surface depositions, with a 90 m thickness. The C4 has a coastal plain depositional environment and it is approximately 15 m thick in the study area.
The C3's sediments are of fluvial origin, as in the C1, but the sand channels are thinner and difficult to correlate between wells. This unit has a thickness of approximately 60 m. The depositional environment of the C2 is of a coastal plain with a thickness of 30 m. Unit C1 is of fluvial origin, where the sands are channel deposits and the clay and silt are flooding surface deposits. Occasionally, thin layers of coal can be found, especially towards the base of the sequence. It has a thickness of 100 m. These sequences thicken gradually towards the western part of the study area, as a result of an increase in the accommodation of the basin, reaching a thickness of over 1500 m in the foothills (Villegas, Bachu, Ramon & Underschultz, 1994).
The structural behavior observed in the seismic line of Figure 2 is that of a monocline with a gentle dip to the west. The line was acquired in the direction of dip, and on it are identified normal faults towards the eastern portion. Three episodes can be differentiated which, though they connect at some point, are actually different faults. The first fault originates in the basement and continues until the Cretaceous- this fault is almost vertical and controls the subsequent deformation. A second fault affects the Carbonera and León Formations- this fault exhibits lesser displacement than the previous fault, but has a greater dip. The third fault affects the Guayabo Formation and the top limit of the León Formation- this last one is the most recent and is probably associated with the subsidence that occurred following the elevation of the mountain range.
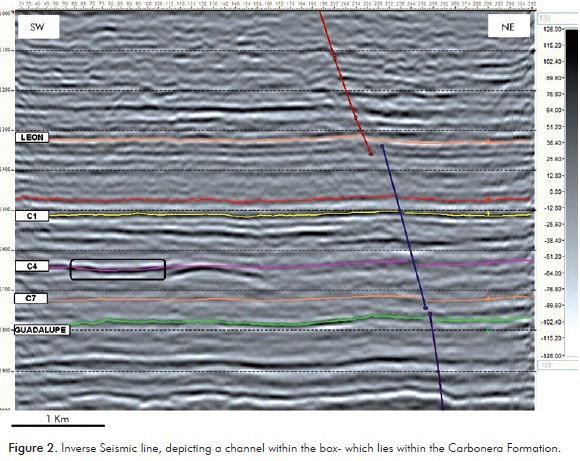
The oldest fault that affects the Paleozoic, is the one that controls the subsequent deformation, and causes a weakness area that is subsequently reactivated during different tectonic events in which the other faults are originated. The little displacement in the fault prevents major changes in the thickness of the León Formation, thus no fault shadow is observed in the recumbent block. From a stratigraphic standpoint, even though there is significant dissonance (Carbonera-Guadalupe), the reflectors are not truncated. Level C7 is identified by a positive maximum. Nevertheless, this horizon is not well defined, since the high porosity of this unit reduces the density, and consequently a low reflection coefficient is produced- thus this horizon loses continuity and changes its phase in some sectors.
Level C4 corresponds to a negative amplitude, which has been connected to a maximum flooding surface. Although it is predominantly a clayey unit, it can display facial variations in the sandy levels, resulting in some sectors, as a non-continuous horizon and presenting phase changes. Additionally, channels are common both in this unit as well as in the adjacent units C3 and C5, and these channels can be identified as amplitude anomalies.
The C1 level corresponds to a clear maximum positive, whose continuity varies in some sectors since this unit resembles a series of reflections that happen laterally without representing a coetaneous surface. Within this unit channels are common which, as in the C-4 level, manifest as amplitude anomalies.
Above the C1 level, a strong positive reflection with good continuity was identified in the whole area, which corresponds to an area consisting of limonite and fine sand, located at the base of the León Formation, which could represent a maximum flooding surface.
Some channels are observed in the western area near the C4 horizon and to the east between the C1 and C4 horizons, which produce negative amplitude anomalies or white color areas. The channel identified in the seismic data is found at the bottom left of Figure 2, between units C3 and C4.
3. METHODOLOGY
The first step involved finding the relationship between the type of lithology and information garnered from the seismic study, along with the petro-physical analysis of a few wells located in another area of the basin (P-wave velocities, S, and the density).
A pre-stack seismic inversion was done using the genetic algorithm implemented in MATLAB. The performance of the algorithm was tested with synthetic and real data from another area of the basin which had well information, for which the difference between the expected and the inverted values was analyzed.
The inversion with the genetic algorithm in the area of interest provided pseudo-records of P-wave velocities, S, and density, which were used to build the model to make the inversion of the seismic line.
The results were analyzed jointly with the petrophysical analysis to establish the relationships between the lithology and the variation of the velocities and the density.
4. ROCK PHYSICS
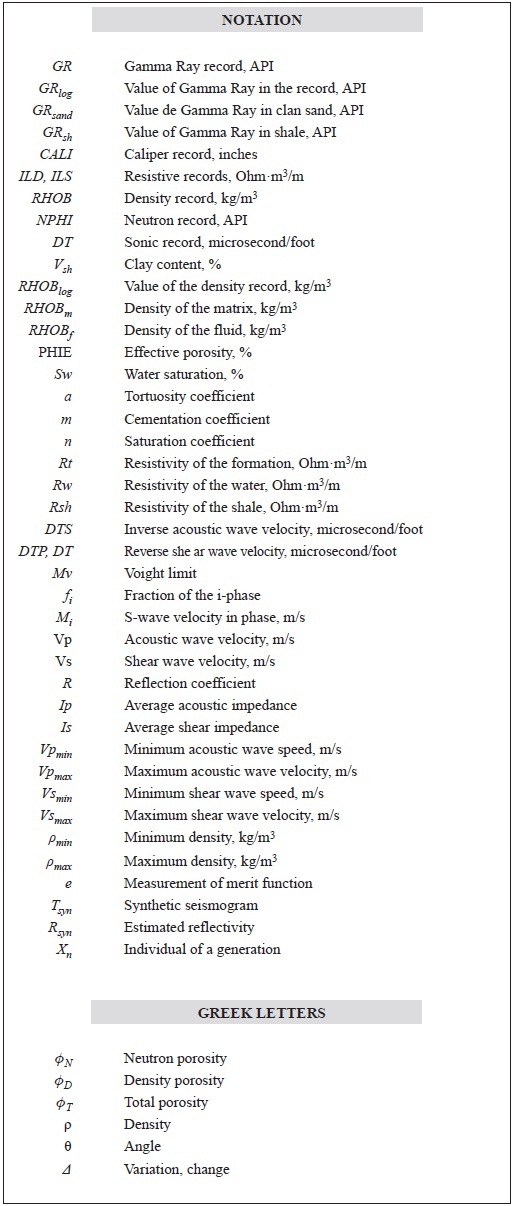
Three wells with records: Gamma Ray (GR), Caliper (CALI), Resistive (ILD, ILS), Density (RHOB), Neutron (NPH) and Sonic (DT).
The following equation was used to calculate the volume of clay (Vsh):

where GRlog corresponds to the measurement of the registry, GRsand corresponds to the GR for clean sand, assigning it a value of 20, and GRsh is the GR value of the shale, assigning a value of 130.
Using neutrón porosity (ΦN), which corresponds to the measurement of the record of the same ñame, and the density porosity (ΦD), the porosity was calculated by:

where RHOBlog corresponds to the measurement of the density record, RHOBm to the density of the matrix, with a valué of 2650 kg/m3 and RHOBf to the density of the fluid with a valué of 1000 kg/m3. The total porosity (ΦT) was calculated using the average of the porosity calculated based on the density record and the neutrón.

Finally, the Effective Porosity (PHIE) was obtained from:

The resistivity of the connate water was calculated using the Rwa method, which is based on the Archie equation:

Assuming values of 1 for the tortuosity (a), 2 for the cementation coefficient (m) and 2 for the saturation coefficient (n), in an area of 100% water saturation, the resulting Archie equation for water saturation is:

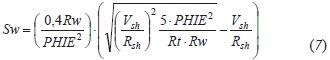
The water saturation was calculated using the Simandoux method, which works very well for shaly sands.
The resistivity of the shale (Rsh) was obtained from the record of deep resistivity with values that oscillated between 3 and 5 for the different wells.
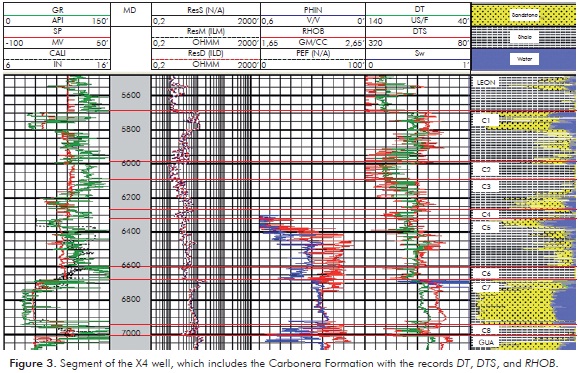
Figure 3 shows the records of a segment of the X-4 well corresponding to the sandy and clayey units interbedded with some levels of coal. Below 6700 feet is the C7 unit of the Carbonera Formation, which is a good quality reservoir with low clay content (less than 20%) and high porosity (23%). Between 5800 and 6700 feet a set of interbedded shales, silts, and shaly sands appears. Between 5700 and 5800 feet is the C1 unit, corresponding to another sandy unit with good reservoir characteristics (Vsh < 20% and high porosity). The sandy units have an average porosity of 23%, and the only sector with hydrocarbon content is at the top of the sandy unit at about 6700 feet, and corresponds to oil, which shows that there is no intersection in the density and neutron records.
Well X4 has no records of S-wave velocity; therefore this information was extrapolated from wells in the basin that do have these records. Figure 4a shows the correlation between the sonogram and the record of the S-wave for these wells, where the color scale indicates the clay volume. Two trends were established according to the lithology:
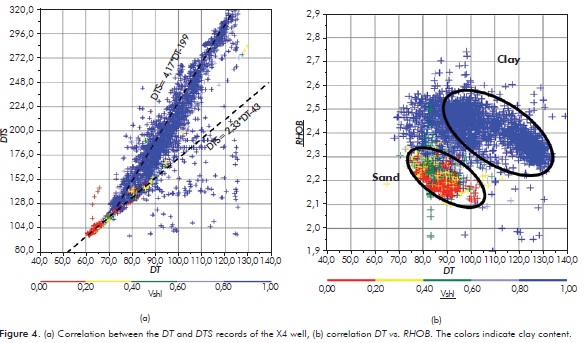


Equation 8 corresponds to sands and Equation 9 to shale; DTP and DTS indícate the inverse of the speed expressed in µs/ft. These relationships allow the estimation of S-wave velocity for different lithology when the rock is a binary compound with different proportions according to the Voight limit
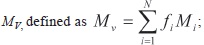
where N is the number of phases, ƒi is the fraction of t he i-phase and Mi corresponds to the velocity of the S-wave in said phase. (Mavko, Mukerji & Dvorkin, 1998). Using this procedure, S-wave velocity was estimated for the well that had the record, showing a high correlation (0,9402) between the record and the estímate.
Figure 4b correlates DT vs. RHOB, where the colors indícate the clay content. The high porosity of the sands in the study area implies that these have a lower density than shale, even though its density matrix is greater. This allows the separation into two áreas with different lithology: low density and high speed in clean sands, and high densities and low velocities in shale.
The aforementioned indicates that when using the Gardner, Gardner and Gregory (1974) relation to estímate the density, the sands must be separated from the shale, and the coefficients calibrated separately.
The p-Vs relation analysis in the well X4 allowed three categories to be defined (Figure 5). Class I, characterized by low densities and high Vs valúes, corresponds to clean sands with good porosity. Conventional reservoirs can be found within this category. Class II correspond to an área of p - Vs average composed of silt, very shaly sands, and clay with sand content.
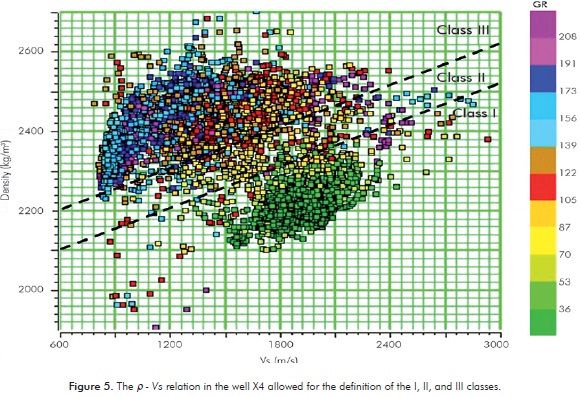
The rocks in this área have very low permeability and, although there may be some sand levéis, the clay content decreases the effective porosity thus resulting in a very poor reservoir quality. Finally, Class III corresponds to a low Vs and high ρ area, composed predominantly of shale and silt. This area has no properties to be considered a conventional reservoir-on the contrary, since its petro-physical characteristics transform it into a seal.
5. GENETIC ALGORITHM
The GA flow is presented in Figure 6, and each step is explained below. The ProMax tool "Derive Average Wavelet" provides an average wavelet in a complete gather. The spectra of the traces within a variant space time window are averaged to generate the spectra wavelet, using the inverse Fourier transform to construct the trace-wavelet. The spectrum of the minimum-phase wavelet is determined using the fact that the phase spectrum and the logarithm of the amplitude spectrum are pairs of the Hilbert Transform (Robinson & Treitel, 2000).
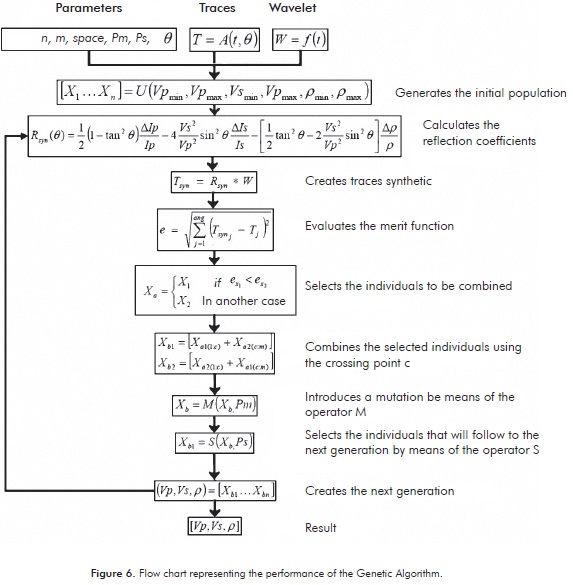
The phenotype consists of three independent binary strings. Each individual is represented by a Nx52x3 matrix where N is the number of layers, 52 bytes is the length of the chain, and the three parameters are (Vp, Vs and p). To genérate the initial population, ranges for Vp, Vs, and p, with uniform probability functions associated to the ranges of 2200 to 3800 m/s, 800 to 2200 m/s, and 2100 to 2600 kg/m3, respectively were defined.
The reflection coefficients between two media are calculated using the following equation (Fatti et al., 1994):
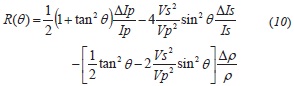
R is the reflection coefficient; θ is the average for the incident and transmitted angles; Vp, Vs, and p are the averages for the velocities P, S, and density, respectively; Ip and Is are the averages of the P and S impedances; ΔIp, ΔIs represent the variations of the P and S impedances; and Δp the density variation. The convolution between the series of coefficients and a wavelet creates the synthetic trace. The merit function estimates the RMS error between the seismic trace and the synthetic trace, generating an error trace. Those individuáis with better functions are selected to be crossed or mutated and form the new generation. The positions where the cross or the mutation is performed are selected based on probability functions. The individuáis which will pass to the next population are selected with another probability function, in order to maintain the population size. If additional individuáis are required, they will be taken from the previous generation. The cycle is repeated until a set number of generations is reached, where the individual with the best adaptive valué of the last generation is the optimal solution.
The record was divided into angle sectors and by making the inversión by sector. The time window method was tested according to the length of the wavelet and by layers. The smaller number of layers in inversión significantly reduces the performance time, slightly deteriorating the quality of the output.
6. ALGORITHM TESTS
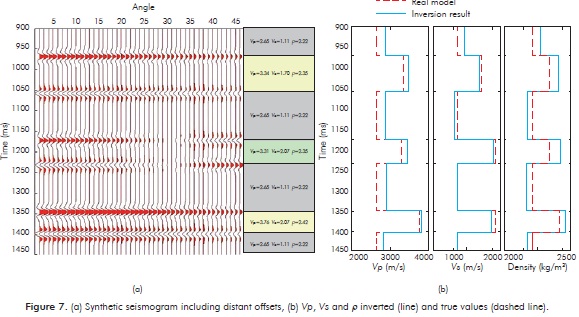
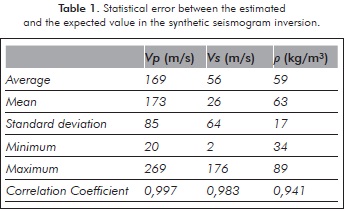
With a seven-layer model and a 30 Hz Ricker wavelet, a synthetic seismogram was created using Equation 10 (see Figure 7a). The range of the seismo-gram [1° - 45°] seeks to improve the inversion density, since its contribution to the amplitude is evident in the far offsets (Fatti et al., 1994). The population used was 600 individuals with a total of 300 iterations. As shown in Figure 7b, the inverted values of Vp, Vs and ρ (line) are quite close to the estimated (dashed line). An RMS error analysis of the inversion quantifies, by a high correlation, the good performance of the algorithm when there are far offsets and no noise. The mean errors (169 m/s; 56 m/s; 59 kg/m3) and standard deviations (85 m/s; 64 m/s; 17 kg/m3) in Vp, Vs and ρ (given in Table 1) attest to this. Noise was not included in the synthetic trace, since- according to Labat et al. (2005) - it has low impact on pre-stacked inversions.
There were two seismic lines acquired in 1989 and registered with 120 channels, with 30 m group intervals and 30 m distance between shots. The deconvolution, the calculation of static, and the NMO correction used surface consistent algorithms, in order to preserve the variation of the amplitudes of the traces with the offset and the bandwidth. Finally, the data was migrated before stacking, and using ray tracing, the maximum angle at 23° was estimated.
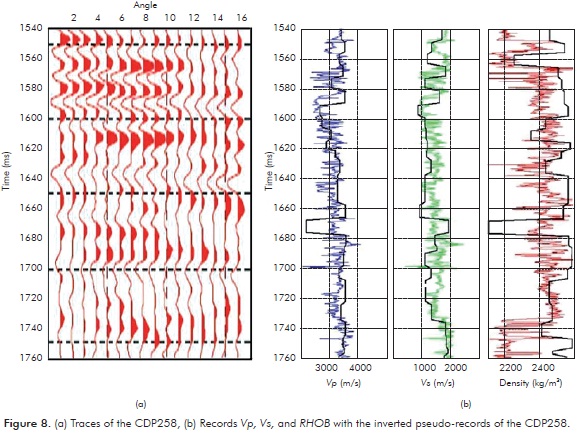
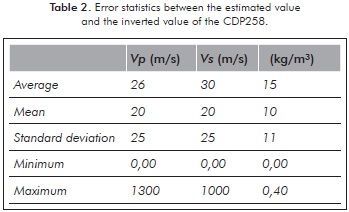
The GA was applied to the CDP258 located at the extreme end of the line that had the X4 well, further from the line than the X1, but with complete records (Vp, Vs and ρ) (see results in Figure 8). The inverted Vp and Vs are close to the expected value, but without far offsets, the estimated ρ is not reliable. An RMS error analysis between the inverted pseudo-record and the well record showed a distribution with average errors of (26 m/s; 30 m/s; 15 kg/m3) and standard deviations of (25 m/s; 25 m/s; 11 kg/m3) in Vp, Vs and ρ (see Table 2).
7. RESULTS
The GA was applied to the CDP236 gather, located in an area not affected by faults or channels. Without well records, the conversion of CDP gather to gather angle was done with regional velocity gradients. With the interpretation of the horizons in a radius of several kilometers around the study area, a depth-time function to determine the depth of the units was achieved. Finally, the interval velocities were calculated from seismic time and the depths of the formations.
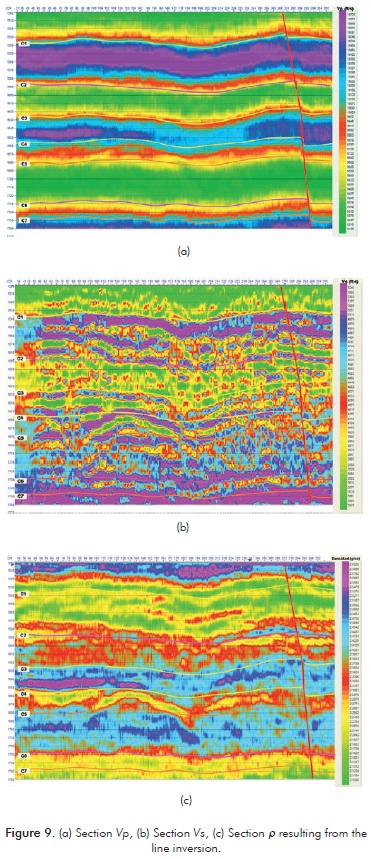
The CDP236 inversion, along with Table 2, was used to define the initial population of the GA for the inversion of the line, where the relationship ρ-Vp of the well X-4 replaced the inverted ρ. As a result of the inversion, three sections were obtained of Vp, Vs, and ρ contained in Figure 9. In the sections Vp (Figure 9a) and ρ (Figure 9c) the presence of the channel is clearer.
8. DISCUSSION OF THE RESULTS
The classification of Figure 5 was used to analyze the sectors on both sides of the fault (see Figure 2). The relation ρ-Vs of the first sector, between CDPs 250-270 with a potential structural trap, is shown in Figure 10a. The area within the red circle corresponds to a reservoir of good porosity and very low clay content. Within this category, two sectors can be found, 1522-1565 ms and 1738-1760 ms, which correspond to the C1 and C7 Carbonera Formation. These two units have sandy facies in this part of the basin, and therefore this result is consistent with the geological information. Additionally, based on the values of the density, a porosity of 25% for the C7 and 27% for C1 would be expected. The units C3 (1610-1640 ms) and C5 (1670-1720ms) are among the Class II and Class III, and would be composed of clays and silts with low sand content.
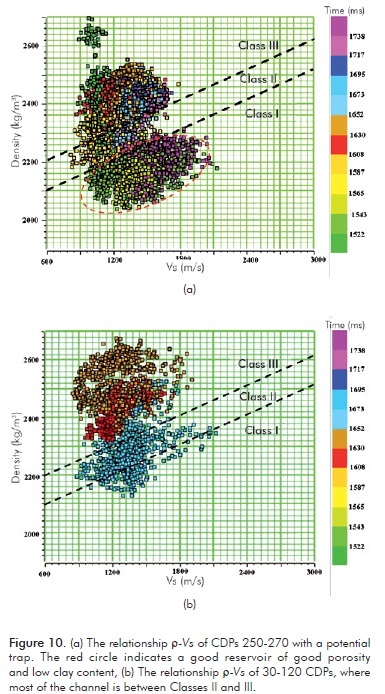
The second sector, between CDPs 30-120, is stratigraphically located between units C3 and C4 of the Carbonera Formation (Figure 10b). It is observed that most of the channel is between Classes II and III, and therefore it is interpreted that it was filled with clay and silt. With such a composition, low porosity and permeability are expected, and therefore - if there were hydrocarbons- they would be difficult to extract. Only a small part falls within Class I, very near the limit, which would make it less likely to be of good reservoir quality sand. Yet, in this case, two alternatives can be considered: the first is that this area corresponds to levels of sand containing clay, or the second option is that they correspond to silts with carbon levels of low thickness, which can reduce speed and density.
This result increases the risk associated to the reservoir of the channel, but this analysis was performed on a single 2-D line, so it should not be ruled out that another area of the same channel might have different properties.
9. CONCLUSIONS
-
To determine the lithology of the fill of a channel located in the Carbonera Formation in the basin of the Llanos Orientales (Colombia), a seismic data inversion was performed before stacking of a 2-D line. Due to the lack of well information, before making a model based inversion, a genetic algorithm was designed based on the AV O principle which did not require a priori information for the well. The algorithm performed satisfactorily in the inversion, both for synthetic seismograms as well as for real data. Although with actual data, the output quality was below that of the synthetic data, because of the absence of far offsets, the algorithm proved to be a useful tool for obtaining information about subsurface features in the absence of well information. The information obtained allowed for an inversion based on a much more reliable model than when using existing relationships in the literature because, when these relationships are not met, they lead to erroneous results.
-
The result indicated the presence of clay and silt in the channel, which does not completely rule out the channel as a reservoir, since the result is valid only for the area near the seismic line that was used. It is likely that in another area the characteristics of the channel filling are different.
-
Proper use of GA requires far offsets, so that in their absence, the density should be restricted with information from a geologically comparable well.
-
Algorithms like this one are very useful in new prospective areas or in offshore projects where no well information is available, as this case, or where drilling density is particularly low.
ACKNOWLEDGMENTS
The authors express their thanks to Petrobras for providing the data used in this project as well as the Universidad Nacional de Colombia for its support to it.
REFERENCES
Anderson, P. (2009). Comparing post-stack AVO inversion to prestack inversion for estimating rock properties. Fron. + Innova. CSPG CSEG CWLS Convention: 669-672. [ Links ]
Castaño, K., Ojeda, G. & Montes, L. (2011). Thin-layer detection using spectral inversion and a genetic algorithm. Earth Sci. Res. J., 15 (2), 121-128. [ Links ]
Fatti, J., Smith, G., Vail, P., Strauss, P. & Levitt, P. (1994). Detection of gas in sandstone reservoirs using AV O analysis: A 3D case history using geostack technique. Geophysics, 59 (9), 1362-1376. [ Links ]
Gardner, G., Gardner, L. & Gregory, A. (1974). Formation velocity and density - the diagnostic basics for stratigraphic traps. Geophysics, 39 (6), 770-780. [ Links ]
Gassmann, F. (1951). Elastic waves through a packing of spheres. Geophysics, 16 (4), 673-685. [ Links ]
Guerrero, J., Vargas, C. & Montes, L. (2010). Reservoir characterization by multiattribute analysis: The Orito field case. Earth Sci. Res. J., 14 (2), 173-180. [ Links ]
Koefoed, O. (1955). On the effect of Poisson's ratio of rock strata on the reflection of plane waves. Geophysical Prospecting, 3 (4), 381-387. [ Links ]
Labat, K., Macé, D., Bourgeois, A., Froidevaux, P., Pichard, M. & Tonellot, T. (2005). Which factors is the prestack stratigraphic inversion very sensitive to?. SEG Expanded Abstracts, 250-254. [ Links ]
Mallick, S. (1999). Some practical aspects of prestack waveform inversion using a genetic algorithm: An example from the east Texas Woodbine gas sand. Geophysics, 64 (2), 326-336. [ Links ]
Mavko, G., Mukerji, T. & Dvorkin, J. (1998). The rock physics handbook: Tools for seismic analysis in porous media. Cambridge: Cambridge University Press. [ Links ]
Mitchell, M. (1998). An introduction to genetic algorithm. Reading: The MIT press. [ Links ]
Puryear, C. & Castagna, J. (2008). Layer-thickness determination and stratigraphic interpretation using spectral inversion: Theory and application. Geophysics, 73 (2), 37-48. [ Links ]
Robinson, E. & Treitel, S. (2000). Geophysical signal analysis. Tulsa: SEG Books. [ Links ]
Rua, N., Jian-hua, Y., Shuai-qi, D. & Yang-guang, L. (2009). Wave impedance inversion in coalfield based on immune genetic algorithm. Procedia Earth and Planetary Science, 1 (1), 929-935. [ Links ]
Sen, M. (2006). Seismic Inversion. Texas: Richardson. S. of Petrol. Eng. [ Links ]
Villegas, M., Bachu, S., Ramon, J. & Underschultz, J. (1994). Flow of formation waters in the Cretaceous-Miocene succession of the Llanos Basin, Colombia. AAPG Bull, 78: 1843-1862. [ Links ]