Services on Demand
Journal
Article
Indicators
-
 Cited by SciELO
 -
 Access statistics
Related links
-
 Cited by Google
 -
 Similars in
SciELO
 -
 Similars in Google
Share
CT&F - Ciencia, Tecnología y Futuro
Print version ISSN 0122-5383On-line version ISSN 2382-4581
C.T.F Cienc. Tecnol. Futuro vol.4 no.5 Bucaramanga Jan./June 2012
2Department of Geology and Geophysics, University of Calgary, Calgary, Canada
ABSTRACT
Determination of Molecular Mass (MM) for petroleum distillates is explored for selected samples via High Temperature Simulated Distillation (HTSD). MM is determined as a by-product from routine HTSD carried out using open wall capillary columns coated with apolar stationary phases. No sample pre-separation into hydrocarbon group-types is required. Determined MM values were validated with results achieved via correlations based on specific gravity and refractive index. Furthermore, determined MM with the former methodologies were found to match mass spectrometric determinations carried out for the basic polar components present within the studied samples. Moreover, HTSD analyzed petroleum distillates are proposed as more representative calibration standards for size exclusion chromatographic separations, thus opening the feasibility of extrapolating MM determination for non volatile petroleum residua.
Keywords: Molecular mass determination, Simulated distillation, Petroleum distillates, ndM, Mass spectrometry.
RESUMEN
La determinación de Masa Molecular (MM) de destilados de petróleo es investigada para muestras selectas mediante Destilación Simulada de Alta Temperatura (iniciales en inglés: HTSD). La MM se obtiene como producto colateral de la práctica rutinaria de HTSD efectuada con columnas capilares tubulares revestidas con fase estacionaria apolar. La preseparación de muestra en grupos de hidrocarburos no es requerida para el análisis. Los resultados de MM son validados mediante comparación con los obtenidos mediante correlaciones basadas en gravedad específica e índice de refracción. Adicionalmente, se corroboró que las MMs obtenidas comparan con aquellas determinadas para los componentes básicos-polares de las muestras estudiadas, determinadas mediante espectrometría de masas. Los destilados de petróleo analizados se proponen como patrones para calibración de la Cromatografía de exclusión molecular (SEC, por las iniciales anglosajonas), extendiéndose de tal forma la posibilidad del análisis a fracciones residuales -no destilables- de petróleo.
Palabras clave: Determinación de masa molecular, Destilación simulada, Destilados de petróleo, ndM, Espectrometría de masas.
RESUMO
Adeterminação de Massa Molecular (MM) de destilados de petróleo é investigada para amostras seletas mediante destilação simulada de alta temperatura (iniciais em inglês: HTSD). A MM se obtém como produto colateral da prática de rotina de HTSD efetuada com colunas capilares tubulares revestidas com fase estacionária apolar. A pré-separação de amostra em grupos de hidrocarbonetos não é requerida para a análise. Os resultados de MM são validados mediante comparação com os obtidos mediante correlações baseadas em gravidade específica e índice de refração. Adicionalmente, corroborou-se que as MMs obtidas comparam com aquelas determinadas para os componentes básico-polares das amostras estudadas, determinadas mediante espectrometria de massas. Os destilados de petróleo analisados se propõem como padrões para calibração da cromatografia de exclusão molecular (SEC, pelas iniciais anglo-saxônicas), estendendo-se de tal forma a possibilidade da análise a frações residuais -não destiláveis- de petróleo.
Palavras chave: Determinando de massa molecular, Destilando simulada, Destilados de petróleo, ndM, Espectrometría de massas.
1. INTRODUCTION
Distillation is the core separation technology of the petroleum business since its early inception (Yergin, 1991). Distillation processes carried out in refinery facilities are mimicked in laboratories with standard physical distillation columns. However, typical laboratory distillation providing True Boiling Point (TBP) distillation curves (ASTM D 2892) requires large amounts of sample (liters) and long analysis responses spanning up to one week. A gas chromatographic alternative for physical distillation was proposed during the 60's (Eggersten, Groennings & Holst, 1960; Green, Schmauch & Worman, 1964) furthermore standardized as Gas Chromatography Simulated Distillation (GCSD) (ASTM D 2887). GCSD is very attractive for routine analysis since requires low sample amounts (mg) and analysis responses of the order of ≤60 minutes or even less (∼1 min) as recently reported (Lubkowitz & Meneghini, 2002). A HTSD was approved during 2005 as standard method (ASTM D 7169).
A general requirement for GCSD is a short column coated with an apolar stationary phase that allows analytes to elute roughly based on their Boiling Points (BP). Van der Waals are the main responsible forces retaining analytes over apolar stationary phases. From the preceding, sample molecules are expected to elute roughly as a function of their MM, since BP are primarily a function of MM. However, it has been shown that elution is slightly affected by other type of interactions caused by chemical functionalities (Coulombe & Sawatzky 1986; Coulombe & Duquette, 1988; Altgelt & Boduszynski, 1994; Chen, McLean & Hager, 2011). Aromatic rings introduce P-P forces and are more retained in comparison to paraffinic compounds (Coulombe & Sawatzky, 1986). Polar N, S, O groups are even more retained because of the polar forces derived from heteroatomic moieties (Altgelt & Boduszynski, 1994).
Attempts to correlate gas chromatography Retention times (Rt) with MM have been reported in the open literature (Coulombe & Sawatzky, 1986; Coulombe & Duquette, 1988; Osjord, Ronningsen & Tau, 1985; Durand, Fafet & Barreau, 1989; Goossens, 1996; Yucel, 2005; Chen et al., 2011). Good correlations have been presented in those arricies. However, drawbacks over the elution process introduced by chemical functionalities prompted the development of methodologies conceived for isolated hydrocarbon group-types in order to maintain constant the polar interactions (Coulombe & Sawatzki, 1986; Coulombe & Duquette, 1988). Otherwise, special soft ionization techniques in coupled Gas Chromatography Mass Spectrometry (GCMS), provided with specialized software, address these inconveniences (Chen et al., 2011).
This work explores the feasibility of determining MM for whole -unseparated- oil distillates based on HTSD data. The results determined via HTSD were further validated by comparison with those determined with correlations based on density and refractive index. Furthermore, determined MM with the former methodologies were found to match mass spectrometric determinations carried out for the basic polar components present within the studied samples. The feasibility of extrapolating MM determination for non-volatile oil residua fractions is additionally proposed, using Size Exclusion Chromatography (SEC) calibrated with the HTSD characterized distillates.
2. EXPERIMENTAL METHODOLOGY
Studied Petroleum Distillates
Athabasca bitumen provided by JACOS was distilled at preparative scale following standard TBP 15/5 (ASTM D 2892) and Pot Still (ASTM D 5236). Its Atmospheric (AGO) and Vacuum Gasoil (VGO) fractions were selected as intermediate boiling range distillates. High Vacuum Gasoil (HVGO) was included as heavy distillate (5010 standard for response factor calibration in ASTM D 7169). One pyrolysis naphtha (NOVA-Chemicals, Canada), was included as a light petroleum distillate.
Electrospray Mass Spectrometry
Broadband ESI-MS spectra (Electrospray Ionization Mass Spectrometry) were acquired with a LTQ mass spectrometer from Thermo Electron Corporation. ESI settings were as follows: positive mode, capillary temperature 275°C, capillary voltage 42V, sheath gas flow 8 (arbitrary units), source voltage was set at 5kV, while other parameters were determined by manual tuning. The mass spectrometer was configured to run in full scan (typically 150-2000 Daltons) with a 'Normalized Collision Energy' (NCE) of 100%. Sample solutions (0,5 and 0,2 mg/mL) were prepared in dichloromethane: isopropanol: H2O: formic acid composed of 50:44:5:0,1 (vol:vol) and 20:71:8:0,2 (vol:vol) respectively. Flowrates of 40 and 25 µL/min of the respectively prepared solutions were set up into the electrospray source. Spectra were acquired after 5 min conditioning time for 2 min and averaged. Less than 3% difference in the average MM using the two different solutions and flow rates were determined, therefore considered as identical.
HTSD Details and Operating Conditions
An Agilent 6890N gas chromatograph was used for HTSD analysis. Experimental conditions have been presented elsewhwere (Carbognani, Lubkowitz, Gonzalez & Pereira-Almao, 2007). However, for the present work no reference gasoil was used for signal response calibration, since distilled fractions were self-integrated in a cryogenic (-20 to 430 °C ramp) gasoil methodology.
Density and Refractive Index of Oil Distillates
Density (23°C) for studied distillates was determined by pycnometry as described elsewhere (Rogel & Carbognani, 2003). Refactive index of the samples were measured at ambient conditions (23°C) with a Reichert Arias 500 (model 1310499) refractometer.
SAR Hydrocarbon Group-type Distributions
Saturates, Aromatics and Resins contents (SAR) were determined for the heavier AGO, VGO and HVGO samples by Thin Layer Chromatography with Flame Ionization Detection (TLC-FID) as described elsewhere (Carbognani, Gonzalez & Pereira-Almao, 2007). A response factor of 0,55 for resins (corresponding to Athabasca VGO) was used for calculation of %w/w SAR distributions. SAR distribution for the pyrolysis naphtha was achieved by PONA analysis (ASTM D 6293). "Saturates" comprises Paraffins + Olefins + Naphthenes + Dienes.
Size Exclusion Chromatography
SEC experimental conditions have been presented elsewhere (López-Linares et al., 2009).
3. RESULTS AND DISCUSSION
Representativity of the Studied Distillates
In the present exploratory work, four petroleum distillates showing widely diverse boiling ranges and SAR hydrocarbon group-type distributions were selected for study. Some of their properties are included on Table 1. The point herein emphasized is the presence of different abundances of hydrocarbon types (SAR) within the selected samples.

High Temperature Simulated Distillation for Molecular Mass Determination of Oil Distillates
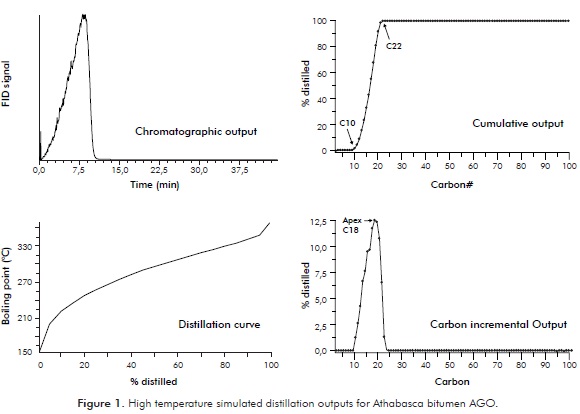
HTSD is a valuable monitoring tool for characterizing heavy oil feedstocks and upgraded products. Commonly, laboratories involved in HTSD analyses report the distillation curve which is the standard format for distillation properties of oil fractions (ASTM D7169). However, the software included in the HTSD system used for the present study provides other qualitative and quantitative outputs that can eventually be useful for additional purposes. Figure 1 presents four from the possible output forms from HTSD analysis. The first plotted output is the qualitative chromatographic trace. The second output is the distillation curve which is routinely reported for most HTSD analyses. The third output form included within the figure presents a distilled fractions cumulative report based on average carbon numbers assigned to the distillates. These carbon numbers correspond to the n-alkanes comprised within the standard calibration mixture that provides the correlation between Rt and B P. It is noteworthy to observe from this plot that the particular sample reported spans signals from about C10 to C22. The fourth plot displays the %wt determined for each carbon number interval, output that directly allows identifying the apex (MM) at the peak of the distribution (C18). The carbon number domain shown within this fourth plot overlaps, as expected, the domain indicated in the previous plot (C10 to C22 in both cases).
The information generated within the cumulative output is further detailed on Table 2. From this Table it is observed that the cumulative data provided by the software is ordered according to carbon intervals (Cn to Cn+1, n=5 to 94). Handling the data for these 94 slices within an excel spreadsheet provides the amount of material eluting within each carbon interval.
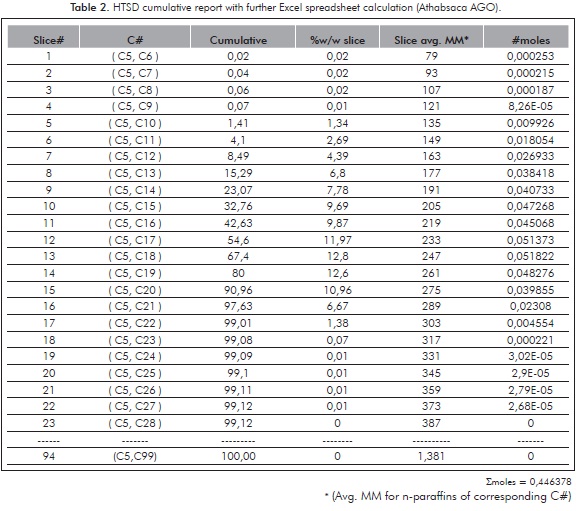
Introducing the average MM of each carbon interval ("slice") and making calculations based onEquation 1, allows the calculation of average molecular mass of the whole distillate, which in this example is 224,06 (i.e., 100 / 0,446318 according the results presented within Table 2).
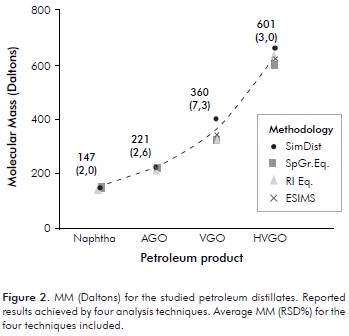
The MMs calculated via HTSD with the described slice analysis for the four studied distillates are presented on Table 3. Validation of the HTSD results was achieved by determining MM for these samples with other unrelated techniques. The values determined with these techniques are those included in Table 3. Further details on the other measurement techniques will be discussed in ensuing sections. Herein, matching of results determined with the four approaches is emphasized as a proof for the validity of the HTSD described approach. MM matching is better observed with the plotted results presented on Figure 2. Reasonable MM equivalence is observed with the repeatabilities (RSD%) presented therein. Despite the fact that the studied samples are polyfunctional (SAR distributions displaying all HC group-types, see Table 1), it appears that HTSD carbon number "slice" analysis matches the boiling and MM properties of distillates in an analogous way as the averaged response for n-alkane standards. Noteworthy is also to realize how MM agreement is observed for the basic-polar materials contained within the studied samples, since the selected ionization technique is conceived only for these species (see ensuing sections). A plausible explanation for the determined agreement is a very low interaction of sample components with the column apolar phase. Another explanation is the low content of the hydrocarbons expected to interact the most with the column stationary phase (resins), shown to be <3,1 % w/w (Table 1). Furthermore, the agreement found for determined MM for basic species suggests that the mass range spanned by these is similar to the bulk, i.e., the majority of neutral components from the studied samples and, also suggests that heteroatoms (mainly N) are not affecting measurement of MMs to a greater extent.

MM Estimation with ndM Methodologies
Estimation of MMs based on refractive index and density ("ndM") was very common in the oil industry decades ago, when conventional oils ruled the markets (Speight, 2006). Revisión of these approaches when heavy oils and heavy fractions appeared on the scene was conducted, being correlations determined with large sample numbers published by Chevron researchers (Altgelt & Boduszynski, 1994). We selected approaches described by these authors based on distillation, density and refractive index determinations. The input parameters for these calculations were already presented on Table 1. As a first approximation for this exploratory work, refractive index and refractometry data were determined at ambient conditions (23°C). Equations 2 and 3 providing MM estimation (Altgelt & Boduszynski, 1994) were followed for MM calculations·
In these equations, MW is synonym for MM, AEBP is the mid point within the Atmospheric Equivalent curve (in °F). Equation 2 requires an additional term for light boiling compounds (MM < 500 Daltons, case that applies to the naphtha, AGO and VGO samples studied in this work).
MM Determination by Mass Spectrometry
Mass Spectrometry (MS) molecular mass distribution for complex HC samples has been widely practiced in the oil business for a long time. Low fragmentation ionizing techniques are the key for producing molecular ion spectra. Probably two of the best known examples were provided by Bodusynzski and coworkers studying field ionization MS of heavy oil fractions (Boduszynski, McKay & Latham, 1980; Altgelt & Boduszynski, 1994).
Other ionization techniques able to produce molecular ions and low fragmentation are commonly described in the open literature. One has received particular interest in recent years since its inception by J. B. Fenn, that eventually led to his Nobel award in 2002. This is Electrospray Ionization (ESI) (Zhan & Fenn, 2000). In this approach, ions are produced directly from sample solutions exposed to an electrical field at the tip of a needle where a plume of small sample solution charged dropplets is created. Our set of studied distillates was analyzed by positive ESI-MS (see experimental part). Naphtha was not considered because sample representativity was compromised by volatility issues. ESI-MS set up conditions described within the experimental section are selective for basic compounds. ESI-MS results are plotted on Figure 3. Carbon number incremental abundances determined by HTSD are also plotted within this figure for comparison purposes.
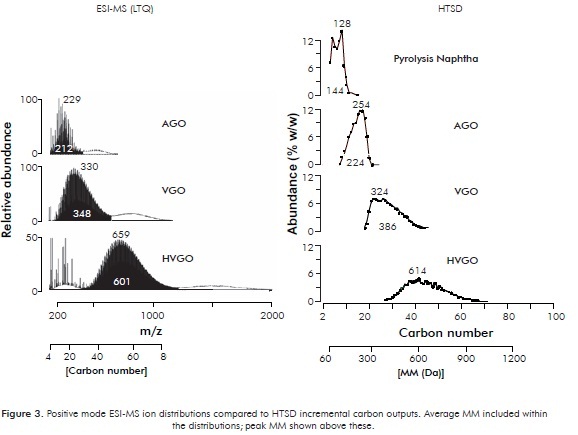
The acquired ESI-MS ion chromatograms show that for the three studied samples, ions can be grouped into three sets of signals. The most important group is the nearly Gaussian distribution observed within intermediate mass range. Then, a bunch of signals is observed at the lower mass range plus, a third set of Gaussian signals distribution appearing at higher mass range. It is known that ESI-MS spectra produce cluster ions plus n-mer ions resulting from colisions occurring within the time interval following ions generation, comprising the interval for their capture into the MS high vacuum system and finally their impact over the MS detection system. This clustering and n-merization is a function of sample concentration, as clearly demonstrated in a recent paper focused on aggregation phenomena of petroleum acids (Smith et al., 2007). Sample concentrations spanning the 0,1-1,0 mg/mL range showed that even in the low end, dimeric forms are observed. From the referred work it can be concluded that the conditions set up in the present study (0,2 - 0,5 mg/mL) favor the formation of dimeric ions, which are the Gaussian distributions observed at about double mass range of the central distribution in the mass fragmentograms presented within Figure 3. The signals observed at the low mass end can be ascribed to two causes: 1. Fragment ions that are typical of many MS techniques, 2. Multiple charged ions, which are commonly observed within ESI-MS spectra of multifunctional molecules (example: proteins). However, abundance of multifunctional molecules is not expected within the studied mid-boiling mostly apolar distillates. At present, no definitive reasons provide feasible explanations for presence of small ions observed within the determined chromatograms, demanding further study to unravel.
The results plotted on Figure 3 including ESI-MS ion chromatograms plus HTSD carbon number chromatograms provide one interesting fact for the purpose of this paper. It can be observed that central Gaussian mass distributions show peak and average masses that correspond to those determined by HTSD. Then, the low end mass ions and the high end mass ions within the ESI-MS results are deemed artifacts. As discussed above, their precise causes are uncertain so far. Experiments with larger set of samples and other MS ionization techniques are under development in order to validate the present findings with emphasis on the neutral, more abundant components present in these distillates.
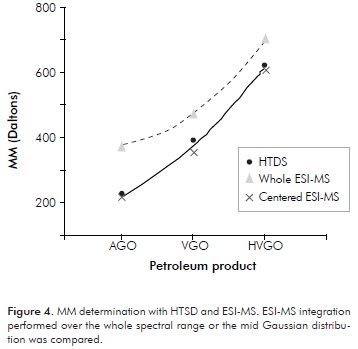
MM calculations considering the whole ESI-MS mass range or restricted only to the central Gaussian distributions were performed (Figure 4). Inclusion of the so called "artifacts" from the MS spectra, led to higher calculated results. In the present work, these artifacts were easily identified by comparison with the respective HTSD chromatograms, suggesting that the chromatographic technique is helpful in these regards.
SEC Calibration with Petroleum Distillates
Calibration in SEC has been an ever present drawback for heavy petroleum fractions, first of all because there are not representative high molecular weight HC standards (Yau, Kirkland & Bly, 1979). Widely used polystyrene standards show dramatic elution differences in SEC when they are compared with real HC isolated fractions (Bartle et al., 1984). Moreover, chemical structure of HC families affects SEC calibration with selective HC group-types as illustrated for different paraffin families (Carbognani, 1996). Despite reasonable agreement between SEC calibrated with PS standards and MMs determined by other techniques has been claimed (Islas, Suelves, Herod & Kandiyoti, 2002), from the discussed drawbacks SEC determined MM values are not deemed accurate and the technique is mostly employed for monitoring processing trends.
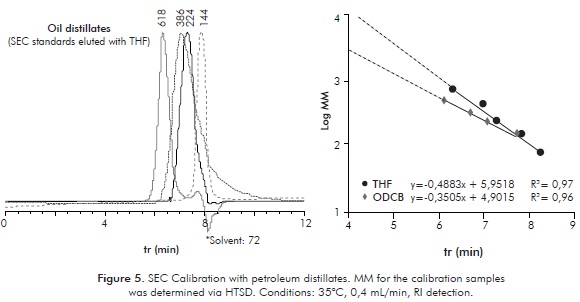
Determination of MM for petroleum distillates as a by-product from routine HTSD analysis, opens the possibility of having sets of real standards for SEC analysis. The set of four analyzed samples discussed in the preceding sections was used for SEC calibration. SEC calibrations performed with two different eluents were achieved and are presented on Figure 5. Reasonable linear responses are observed suggesting that the selected distillate calibration standards elute as a function of their average mass or, more precisely, as function of theirs hydrodynamic volumes within the separation domain of the column. Elution in the more polar ODCB (dipole moment 2,50 Debye) is observed faster compared to THF (dipole moment 1,75 Debye (CRC Handbook of Chemistry and Physics, 2003-2004)). Two causes might explain the observed elution patterns: 1. ODCB is more polar than THF, then interacts to a greater extent with the column polymeric stationary phase avoiding to a greater extent the interaction of sample components with the column; from this, sample components are less retained; 2. ODCB is a more polar and better solvating solvent for sample components, then, solvated analytes show a larger hydrodynamic volume, eluting at shorter Rt. Further applications for the discussed SEC elution and calibration for MM determination of non-volatile HCs has been reported before (López-Linares et al., 2009).
4. CONCLUSIONS
-
This work describes a HTSD approach for determining MM for totally distillable petroleum fractions, based on the carbon number cumulative report. Slice integration of FID detector signal is performed and MM calculated with the equivalent MMs for alkane carbon number standards. No prior separation of petroleum distillates into hydrocarbon groups or families is necessary.
-
HTSD determined MM values were shown to agree with those determined using correlations based on specific gravity and refractive index. Basic components from the samples were furthermore observed to span the same MM ranges determined by HTSD. The chromatographic technique was furthermore found useful for detection of cluster and fragment ions within the described electrospray ionization mass spectrograms.
-
Analyzed petroleum distillates are proposed as more representative MM calibration standards for size exclusion chromatographic separations, extrapolating this way the determination of MM for non volatile petroleum residua.
ACKNOWLEDGMENTS
Funding is acknowledged to NSERC/NEXEN/ALBERTA INNOVATES ENERGY AND ENVIRONMENT SOLUTIONS through the Industrial Research Chair in Catalysis for Bitumen Up-grading provided to Dr. P. Pereira-Almao. JACOS oil company is thanked for providing the Athabasca bitumen and NOVA Chemicals for the pyrolysis naphtha. Mr. Eumir Hernández is acknowledged for pyrolysis naphtha PONA analysis.
REFERENCES
Altgelt, K. H. & Boduszynski, M. M. (1994). Composition and analysis of heavy petroleum fractions. New York: Marcel Dekker. [ Links ]
ASTM Standard D 2887. Test Method for Boiling Range Distribution of Petroleum Fractions by Gas Chromatography. Annual Book of Standards, ASTM International, West Conshohocken, PA, 2010. [ Links ]
ASTM Standard D 2892. Test Method for Distillation of Crude Petroleum (15-Theoretical Plate Column). Annual Book of Standards, ASTM International, West Conshohocken, PA, 2010. [ Links ]
ASTM Standard D 5236. Test Method for Distillation of Heavy Hydrocarbon Mixtures (Vacuum Potstill Method). Annual Book of Standards, ASTM International, West Conshohocken, PA, 2010. [ Links ]
ASTM Standard D 6293. Test Method for Oxygenates and Paraffin, Olefin, Naphthene, Aromatic (O-PONA) Hydrocarbon Types in Low-Olefin Spark Ignition Engine Fuels by Gas Chromatography. Annual Book of Standards, ASTM International, West Conshohocken, PA, 2010. [ Links ]
ASTM Standard D 7169. Test Method for Boiling Point Distribution of Samples with Resid such as Crude Oils and Atmospheric Resids by High Temperature Gas Chromatography. Annual Book of Standards, ASTM International, West Conshohocken, PA, 2010. [ Links ]
Bartle, K. D., Mulligan, M. J., Taylor, N., Martin, T.G. & Snape, C. E. (1984). Molecular mass calibration in size-exclusion chromatography of coal derivatives. Fuel, 63 (11), 1556-1560. [ Links ]
Boduszynski, M. M., McKay, J. F. & Latham, D. R. (1980). Asphaltenes. Where are you?. Association Asphalt Paving Tech, 49: 123-143. [ Links ]
Carbognani, L. (1996). High temperature (70°C) size exclusion chromatography of petroleum waxes with ri and fid detection. J. of High Resol., 19 (10), 549-558. [ Links ]
Carbognani, L., Lubkowitz, J., Gonzalez & M. F., Pereira-Almao, P. (2007). High temperature simulated distillation of athabasca vacuum residue fractions. Bimodal distributions and evidence for secondary "on-column" cracking of heavy hydrocarbons. Energy & Fuels, 21: 2831-2839. [ Links ]
Carbognani, L., Gonzalez, M. F. & Pereira-Almao, P. (2007). Characterization of athabasca vacuum residue and its visbroken products. stability and fast hydrocarbon group-type distributions. Energy & Fuels, 21: 1631-1639. [ Links ]
Chen, J., McLean, N. & Hager, D. (2011). Prediction of molecular weight by-boiling-point distribution of middle distillates from Gas Chromatography-Field Ionization Mass Spectrometry (GC-FIMS). Energy & Fuels, 25 (2), 719-726. [ Links ]
Coulombe, S. & Sawatzky, H. (1986) H.p.l.c separation and g.c. characterization of polynuclear aromatic fractions of bitumen, heavy oils and their synthetic products. Fuel, 65 (4), 552-557. [ Links ]
Coulombe, S. & Duquette, G. (1988). Simulated distillation and molecular weight determination by supercritical fluid chromatography. Am. Chem. Soc. Prep. Fuel Chem. Div., 33 (4), 920-926. [ Links ]
CRC Handbook of Chemistry and Physics. (2003-2004). 84th ed. Boca Ratón: Lide, D. R. CRC Press. [ Links ]
Durand, J. P., Fafet, A. & Barreau, A. (1989). Direct and automatic capillary GC analysis for molecular weight determination and distribution in crude oils and condensates up to C20. J. High. Resol. Chromatogr., 12 (4), 230-233. [ Links ]
Eggersten, F. T., Groennings, S. & Holst, J. (1960). Analytical disitillation by Gas Chromatography. Programmed temperature operation. Anal. Chem., 32 (8), 904-909. [ Links ]
Goossens, A. G. (1996). Prediction of molecular weight of petroleum fractions. Ind. Eng. Chem. Res., 35 (3), 985-988. [ Links ]
Green, L. E., Schmauch, L. J. & Worman, J. C. (1964). Simulated distillation by Gas Chromatography. Anal. Chem., 36 (8), 1512-1516. [ Links ]
Islas, C. A., Suelves, I., Herod, A. A. & Kandiyoti, R. (2002). Average masses of pitch fractions of narrow polydis-persity for the calibration of sec by assessment of their MALDI-TOF mass spectra. Fuel Chem. Div. Prep., 47 (2), 638-639. [ Links ]
López-Linares, F., Carbognani, L., Sosa-Stull, C., Pereira-Almao, P. & Spencer, R. J. (2009). Adsorption of virgin and visbroken residue asphaltenes over solid surfaces. 1. Kaolin, smectite clay minerals, and athabasca siltstone. Energy & Fuels, 23: 1901-1908. [ Links ]
Lubkowitz, J. A. & Meneghini, R. (2002). Determination of boiling-point distribution by simulated distillation from n-pentane throught n-tetratetracontane in 70 to 80 seconds. J. Chromatogr. Sci., 40 (5), 269-275. [ Links ]
Osjord, E. H., Ronningsen, H. P. & Tau, L (1985). Distribution of weight, density, and molecular weight in crude oil derived from computerized capillary GC analysis. J. High. Resol. Chromatogr., 8 (10), 683-690. [ Links ]
Rogel, E. & Carbognani, L. (2003). Density estimation of asphaltenes using molecular dynamics simulations. Energy & Fuels, 17 (2), 378-386. [ Links ]
Smith, D. F., Schaub, T. M., Rahimi, P., Teclemariam, A., Rodgers, R. P. & Marshall, A. G. (2007). Self-association of organic acids in petroleum and canadian bitumen characterized by low- and high-resolution mass spectrometry. Energy & Fuels, 21 (3), 1309-1316. [ Links ]
Speight, J. G. (2006). The chemistry and technology of petroleum. 4th ed. Florida: CRC Press, Taylor and Francis Group. [ Links ]
Yau, W. W., Kirkland, J. J. & Bly, D. D. (1979). Modern size-exclusion liquid chromatography. practice of gel permeation and gel filtration chromatography. New York: John Wiley & Sons. [ Links ]
Yergin, D. (1991). The prize. The epic quest for oil, money and power. New York: Simon & Schuster. [ Links ]
Yücel, H. G. (2005). Prediction of molecular weight and density of n-alkanes (C6-C44). Analytica Chim. Acta, 547 (1), 94-97. [ Links ]
Zhan, D. & Fenn, J. B. (2000). Electrospray mass spectrometry of fossil fuels. Intl' J. Mass Spectrom., 194 (2-3), 197-208. [ Links ]


