Services on Demand
Journal
Article
 English (pdf)
 Article in xml format
 Article references
 Send this article by e-mail
Indicators
-
 Cited by SciELO
 -
 Access statistics
Related links
-
 Cited by Google
 -
 Similars in
SciELO
Similars in
SciELO -
 Similars in Google
Share

 Permalink
CT&F - Ciencia, Tecnología y Futuro
Print version ISSN 0122-5383On-line version ISSN 2382-4581
C.T.F Cienc. Tecnol. Futuro vol.4 no.5 Bucaramanga Jan./June 2012
Universidad Jorge Tadeo Lozano, A.A. 34185 Bogotá, Cundinamarca, Colombia
2ECOPETROL S.A. - Instituto Colombiano del Petróleo (ICP), A.A. 4185 Bucaramanga, Santander, Colombia
ABSTRACT
The aim of our work was to analyze the use of Gas Chromatographic (GC) data for correlating bulk properties of Colombian crude oils. Multivariate statistics regressions were applied on a set of 57 Colombian crude oil chromatograms to correlate both density and kinematic viscosity (Vk); this last one property in terms of the Refutas viscosity index (V50). Principal component analysis applied to the GC signals indicated that the responses for the more volatile compounds, which elute up to 5 min of recorded retention times, can be excluded from the data analysis to get better distribution of the score and loading plots. Principal Component Regression (PCR) and Partial Least Squares (PLS) methods were applied to the GC signals pre-processed with different strategies. Strategy of total area normalization applied on the chromatograms without the first 5 min of the recorded times produced the best performance for predicting density and V50 in both PCR and PLS (strategies named as PCR2-5 and PLS2-5, respectively). The density models using PLS2-5 required just one PC for explaining 88,6% of the total variance. However, this model generated appreciable errors compared to those reported by the Near Infrared models and the reproducibility and repeatability reported in the ASTM D5002. PLS2-5 also yielded large errors when calculating Vk from the regression of V50. Through the inclusion of the chromatographic Distillable Fraction (DF) and some mathematical transformations, the accuracy for the predictive model of Vk was improved. Notwithstanding this, performance of the regression based on GC data was lower compared to the corresponding Nuclear Magnetic Resonance models. Validations of the regressions with PLS2-5 reported average relative errors for density and kinematic viscosity (predicted in terms of DF*Ln(Vk)) of 1,4 and 29%, respectively, which are surprisingly low given the appreciable amount of chromatographic residue in several crudes. Despite having a higher experimental error in the chromatographic method in comparison to that found when using spectroscopic method in chemo-chemistry, the regression models proposed in this work can provide useful preliminary information for assay evaluation and have the potential to be improved and extended to crude oil fractions using the same FID signal recorded from the crude.
Keywords: Multivariate regression, Colombian oil, Gas chromatography, Density, Viscosity.
RESUMEN
El objetivo de nuestra investigación es analizar el uso de la cromatografía de gases en la correlación de propiedades de crudos colombianos. Diferentes análisis de estadística multivariada fueron aplicados a 57 cromatogramas de fase gaseosa de crudos colombianos para correlacionar datos de densidad y viscosidad cinemática (Vk); esta última propiedad en términos del índice Refutas (V50). Resultados del análisis por componentes principales mostraron que las señales para los componentes más volátiles, extraídos en los primeros 5 min, pueden ser descartadas del análisis para mejorar la distribución y la correlación de los datos en los cromatogramas. Regresiones por Componentes Principales (PCR) y por Mínimos Cuadrados Parciales (PLS) fueron aplicadas a los datos de los cromatogramas preprocesados con diferentes estrategias. La estrategia de la normalización del área de los cromatogramas sin los 5 primeros minutos reportó los mejores desempeños en la predicción de la densidad y el V50 en las regresiones PCR y PLS. El modelo de densidad construido mediante la estrategia PLS2-5 explicó el 88,6% de la varianza total con el primer componente principal. Sin embargo, los errores obtenidos con este modelo fueron superiores a los reportados la espectroscopia del infrarrojo cercano y con la reproducibilidad y repetibilidad definidas en la norma ASTM D5002. PLS2-5 también reportó grandes errores para Vk a través de la predicción de V50. La predicción de Vk fue mejorada con la inclusión del parámetro DF y diferentes transformaciones matemáticas. No obstante esta mejora, el desempeño del modelo basado en datos cromatogáficos no alcanzó el desempeño reportado para los modelos basados en las pruebas Resonancia Magnética Nuclear. Las validaciones aplicadas a la regresión denominada PLS2-5 reportaron errores relativos promedio para la densidad y Vk (utilizando la transformación DF*Ln(Vk)) de 1,4 y 29%, respectivamente, los cuales son sorpresivamente bajos teniendo en cuenta que varios crudos presentaron una cantidad importante de residuos cromatográficos. A pesar de que los errores obtenidos con los análisis quimiométricos basados en cromatografía de gases fueron mayores a los reportados con los procedimientos quimiométricos en señales espectroscópicas, los modelos de regresión propuestos en este trabajo pueden suministrar información preliminar útil para la evaluación de assay y tienen el potencial de ser mejorados y extendidos a las fracciones usando la misma señal del FID que se adquiere para el crudo.
Palabras clave: Regresión multivariada, Petróleo colombiano, Cromatografía, Densidad, Viscosidad.
RESUMO
Objetivo da nossa pesquisa é analisar o uso da cromatografia de gases na correlação de propriedades de crus Colombianos. Diferentes análises de estatística multivariada foram aplicadas a 57 cromatogramas de fase gasosa de crus Colombianos para correlacionarem dados de densidade e viscosidade cinemática (Vk); esta última propriedade em termos do índice Refutas (V50). Resultados da análise por componentes principais mostraram que os sinais para os componentes mais voláteis extraídos nos primeiros 5 min, podem ser descartados da análise para melhorar a distribuição e a correlação dos dados nos cromatogramas. Regressões por Componentes Principais (PCR) e por mínimos quadrados parciais (PLS) foram aplicadas aos dados dos cromatogramas pré-processados com diferentes estratégias. A estratégia da normalização da área dos cromatogramas sem os 5 primeiros minutos reportou os melhores desempenhos na predição da densidade e o V50 nas regressões PCR e PLS. O modelo de densidade construído mediante a estratégia PLS2-5 explicou o 88,6% da variação total com o primeiro componente principal. Entretanto, os erros obtidos com este modelo foram superiores aos reportados com a análise (NIR) e com a reprodutibilidade e repetibilidade definidas na norma ASTM D5002. PLS2-5 também reportou grandes erros para Vk através da predição de V50. A predição de Vk foi melhorada com a inclusão do parâmetro DF e diferentes transformações matemáticas. Não obstante esta melhora, o desempenho do modelo baseado em dados cromatográficos não alcançou o desempenho reportado para os modelos baseados nas provas (NMR). As validações aplicadas à regressão denominada PLS2-5 reportaram erros relativos média para a densidade e Vk (utilizando a transformação DF*Ln(Vk)) de 1,4 e 29%, respectivamente, os quais são surpresamente baixos tendo em conta que vários crus apresentaram uma quantidade importante de resíduos cromatográficos. Apesar de ter um maior erro experimental neste método cromatográfico ao compará-lo com o encontrado quando se usam métodos espectroscópicos em quimiometria, os modelos de regressão propostos neste trabalho pode subministrar informação preliminar útil para a avaliação de assay de crus e têm o potencial de ser melhorados e estendidos às frações de cru usando o mesmo sinal do FID que se adquire para o cru.
Palavras chave: Regressão multivariada, Petróleo colombiano, Cromatografia, Densidade, Viscosidade.
1. INTRODUCTION
Undoubtedly, petroleum crude oils are currently the most important energy source for industry and modern human life. Performance of the crude oil industrial treatments and yields of the refinery products depends on the chemical composition of the crude. Due to the importance of crude characteristics for planning refinery processes, attention is paid in estimating their properties in reduced times. Density and kinematic viscosity (Vk) are two of the main properties which define the performance of crudes in downstream processes (Riazi, 2005). These properties are the result of the composition and internal interactions inside the oils. Density and viscosity can be experimentally calculated by using the corresponding protocols of the ASTM (ASTM D5002 and ASTM D445, respectively). However, these techniques are time-consuming and carried out using different appliances and equipments. Particularly, determining viscosity of heavy oils by ASTM D445 method requires up to 150 mL of sample, mineral oil for a heating bath, and up to 3 h to completion. Predictions of density and Vk can be also performed by statistical correlations which involve other macroscopic properties (Riazi, 2005) and therefore more ASTM protocols.
Alternatively, compositional information from NIR, NMR or GC can be correlated with the global properties of crude oil (Jackson, 1991; Wold et al., 1984; Skrobot et al., 2007; Flumignan, de Oliveira- Ferreira, Tininis & de Oliveira, 2008; Crawford & Hellmuth, 1990; Bodle & Hardy, 2007). Most of the multivariate predictions reported on crude oil properties are based on NIR Spectroscopy (Hannisdal, Hemmingsen & Sjöblom, 2005; Pasquini & Bueno, 2007; Falla et al., 2006; Kallevik, 1999; Aske, Kallevik & Sjöblom, 2001; de Peinder et al., 2009a; Silva et al., 2011) and NMR (Evans, Batts & Cant, 1987; Ali, Ghaloum & Hauser, 2006; Molina, Navarro & Murgich, 2007; de Peinder et al., 2009b; Molina, Navarro & Murgich, 2010; Silva et al., 2011). Due to the complexity of the crude oils, vibrational features of the Infrared (IR) spectra can be hidden as a result of highly correlated spectral signals (overlapping) (Hannisdal et al., 2005; Kallevik, 1999; Aske et al., 2001). In case of NMR, especially proton NMR multivariate analysis of crudes has been conducted using as spectral variables the integrated regions of the 1H NMR spectrum. Although the NMR spectroscopy has been proven to be a very useful technique in the study of petroleum fractions, there are some disadvantages associated with this spectroscopic test like the high cost, the risk of magnetic disturbances, requiring magnetic shielding, and the overlap of frequency ranges (Silva et al., 2011). Conversely, in the GC columns sample components are partially separated by boiling point providing important information about composition and internal interactions which better represents the industrial process occurring downstream in refineries. Aditionally to this, GC test needs short time to be performed and required small amount of samples. Moreover, boiling point distributions of crudes obtained by gas chromatography is maybe the most important information used in crude assay generation and therefore its measurement is mandatory. These advantages made the GC test a common technique for the analysis of petroleum fractions. Crude oil assays partially take advantage of GC information in terms of simulated distillation curve (Riazi, 2005). However, there could be plenty of information, specially for light and middle crude oils, that may be capitalized for predicting acceptable values of bulk properties for different applications in the petroleum industry (for example in real-time characterization due to GC analysis is faster than ASTM techniques). Despite this potential application, we only found the quantitative structure-behavior work for crude oil viscosities of Burg, Selves and Colin (1997) which studied GC data obtained by using crude oils as stationary phase and predicted viscosities with an average error of 39%. Burg et al. (1997) adjusted the Abraham's Five Parameter Linear Solvation Energy Relationship (LSER) equation to the GC data to determine the crude oil intermolecular interaction descriptors which, in a subsequent regression step, were used to model crude oil viscosities. Thus, two consecutive regression processes, which can raise errors in the predictions, were involved in the work of Burg et al. (1997). Besides, LSER descriptors may not engage the complete range of interactions required for predicting the expected value of macroscopic properties. As an alternative, we can analyze GC signals of solute crude oils within the chemometric frame (Jackson, 1991; Wold et al., 1984; Skrobot et al., 2007; Varmuza & Filzmoser, 2009) to give a better way for estimating bulk properties of crudes.
In the present work, we report the most relevant results on the first attempt to apply chemometric analysis on GC data to predict density and Vk for a set of Colombian crude oils. Firstly, we applied Principal Component Analysis (PCA) for qualitatively determining the influence of the detector noise and the variability of the signal due to the injection system in the chromatograms (see for instance Barwick, 1999) mainly caused by the volatility of the lightest components in crude oils. Later on, we analyzed the performance of both Principal Component (PCR) (Wold, Esbensen & Geladi, 1987) and Partial Least Square (PLS) (Geladi & Kowalski, 1986) regressions over the GC data preprocessed with three different strategies. Predictions of Vk also involved preprocessing through the use of both the viscosity blending index, V50, as defined in the Refutas index method (Baird, 1989), A + B*Log(Log(Vk+ C)) with appropriate valué for the parameters A, B and C for representing the Colombian crude oil datábase), the chromatographic distillable fraction and the natural logarithm. Validations of the model were done based on different sets of crudes left out from the regression model.
2. EXPERIMENTAL AND MATHEMATICAL PROCEDURES
Samples
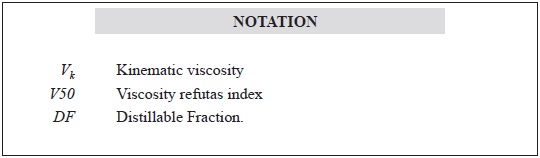
A sample set consisting of 57 different crudes were used in this study. All samples belongs to the assay crude datábase of ECOPETROL SA. In Table 1 are presented the range for the main properties of these crudes. As it can be seen a very broad variety of crudes are included. For instance, the lightest and heaviest crudes with densities of 0,8079 and 0,9906; and viscosities (in terms of V50 index) of 3,1 and 36,7; respectively were used. An important parameter for this study is the Distillable Fraction of crudes (DF) which is obtained directly from the chromatographic data (ASTM D5307-97). The range for this parameter is between 0,571 and 0,983 which indicates that the sample set consists of either crude that almost fully distillated at the chromatographic analysis conditions and crudes whose residues are about 40%.
GC Analysis
Detailed compositional analysis (test procedure based on the ASTM D 5307-97) for all samples was determined with a Hewlett-Packard gas chromatograph (model HP 6890) equipped with a programmed temperature vaporization system, a Fíame Ionization Detector (FID), porapack column, 10 m long and 0,52 µm wide and particle size of 3 µm. The compositional analysis software was Hydrocarbon Expert of Separation Systems. For the analysis, 0,2 µL of a previously prepared mixture of ratio 1 g crude oil to 1 mL carbón disulfide solvent was injected through an automatic sampler, using Helium as carrier gas at a flow of 20 mL/min. The GC analysis provided the boiling point distribution of crudes by using a calibration standard consisting of a mixture of normal paraffins with carbón atoms between 3 and 44. Crude oil chromatograms thus obtained were corrected up to 32 minutes (window time of 1,67E-3 s) by using the blank run profile and the internal standard calibration quantifying the Distillable Fraction (DF).
Data Analysis
Several published researches have successfully proven the utility of PCA in pattern recognition and classification of vast amount of data, such as those generated from modern analytical instrumentation (Orto, 1999). PCA method transforms highly correlating x-variables into a smaller set of uncorrelated variables containing the most relevant information (Varmuza & Filzmoser, 2009). The x-variables are arranged in a matrix, D, whose columns and rows are the chromatogram obtained for each crude and the peak area in each retention window, respectively. Key idea of PCA is to replace the original D matrix by a product of the score and loading matrices (Otto, 1999; Esbensen, 2001), which reduces the dimensionality of the data to the number of columns of the score matrix. New variables called Principal Components (PC) or latent variables determine the dimensionality of the data. These PC are uncorrelated and calculated on the basis of the maximum variance criterion or the minimum squared projection distances. Loadings can be visualized as a transformation matrix between the original system and the principal component space (Otto, 1999; Esbensen, 2001; Varmuza & Filzmoser, 2009). Scores and loadings matrixes are useful for determining, mainly graphically, the interrelationships between different variables and interpret sample patterns and similarities.
The Principal Component (PCR) (Wold et al., 1987) and the Partial Least Square (PLS) (Geladi & Kowalski, 1986) regressions make use of the principal components to apply the most relevant information and quantify the relationship between the dependent and the independent variables (Otto, 1999; Esbensen, 2001). In PCR, the PCs obtained from PCA are used instead of raw GC data as predictors to fit a multilinear regression model. On the other hand, decomposition of the D matrix in PLS is done on the basis of maximum covariance with the response vector (dependent variables). The decomposition is followed by a regression between the latent variables and the response. Both PCR and PLS were applied to obtain a quantitative relationship between chromatograms of crude oils and their density and Vk (V50 Index and Ln(Vk)). Multivariate calculations were carried out using The Unscrambler 9.7 package.
3. RESULTS AND DISCUSSION
GC Features
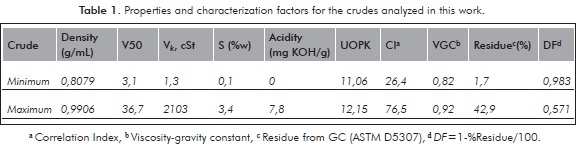
Chromatograms of two representative crudes (the lightest Crude 31 and the heaviest Crude 10 from the data set) are presented in Figure 1. As it can be seen in the whole detector response both elution profiles are relatively similar especially in the final part of the chromatogram. However, when signal is magnified (see time intervals 0 - 5 minutes and 5 - 32 minutes on the top of the figure) important differences are observed. Components that elute at times lower than 5 min (approximately corresponding to the normal paraffin C10) are markedly more abundant in the lightest crude, as we expected. On the other hand for longer elution than 5 minutes, especially after 13 minutes, the heaviest crude generates a higher response signal in the detector leading to an appreciable increase of the baseline. All this composition information inside of every chromatogram is being analyzed as described further.
Data Description and Discrimination
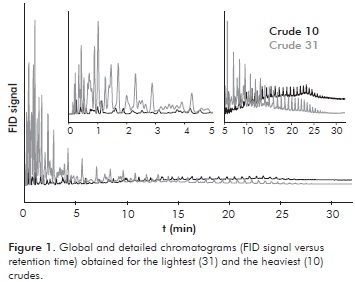
PCA was applied to the GC data with an increased retention window of 0,05 s (650 points in total) instead of the retention window from Lab (1,67E-3 s; i.e., 19500 experimental points) in order to decrease the computer calculation time. Score plot, which shows similarities among the different class of crude oils, is shown in Figure 2a. Distribution of samples on PC1 vs PC2 score figure suggested a roughly ordering of the samples according to their density and chromatographic residue. Thus, rightpart (positive PC1 values) of Figure 2a contained light crude oils meanwhile left part (negative PC1 values) of the plane contained heavy crude samples. However, this distribution had several exceptions in organizing crudes according to their density and score PC1 value; e.g. the 6 and 55 sample light crudes were found on the left part and the middle heavy crude 9 was found on the right part.
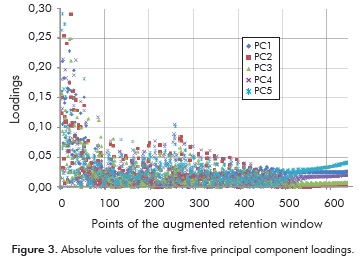
Based on Hotelling T2 ellipse (95% interval confidence), crudes 13; 31 and 34 were found to be potential outliers (Figure 2a). These crudes corresponded to the lightest crudes analyzed in this work (Table 1) and therefore exhibited several chromatogram peaks higher than for the other samples at the initial retention time region (Figure 1). An additional PCA leaving out crudes 13; 31 and 34 explained 42% of total variance (with PC1+PC2) which is equivalent to the PCA including all the crudes and as a consequence, it was decided not to remove any sample from the model. Loading graph (Figure 2b), that shows the correlation between the PCs and the normalized peak areas, helps inferring pattern of the scores due to the contribution of the variables in the chromatograms. By comparing scores and loading plots, light crudes are grouped on the right part due to the major content of volatile compounds (major contribution of the 100 first points). Thus, the major the density of the crude the major the influence of the final retention times (Figure 2b). This relationship between the samples and the variables can be explained due to the linear behavior of the density with the composition. Despite the preceding facts, the distribution of the loading plot (Figure 2b) displayed an overestimated contribution of the first minutes (ca. 5 min or 100 points corresponding to the signal of hydrocarbons with a number of carbon atoms between 3 and 10) with respect to the whole experimental time (650 points corresponding to a paraffin with 48 carbon atoms); i.e., heavy crudes with scarcely content of volatile compounds should have a lack of appreciable FID signal at the beginning of the test as well as a major value of the signal at final retention times. In fact, an analysis of the first-five PC loadings (Figure 3) revealed an overweighed contribution of the first 100 points, corresponding to paraffins with a number of carbon atoms between 3 and 10, influencing the derived PCA model (Figure 2). This overestimated contribution can be explained by the solvent peaks as well as uncontrolled evaporation of volatile light compounds during the injection procedure (Barwick, 1999) causing signal fluctuations; thus, samples 13; 31 and 34 appeared to be potential outliers (Figure 2a). This variability of the detector signal at the beginning part of chromatograms influencing the chemometric analysis has been also noticed in systems like fruits (Reid, O'Donnell & Downey, 2004; Fredericks, Lee, Osborn & Swinkels, 1985).
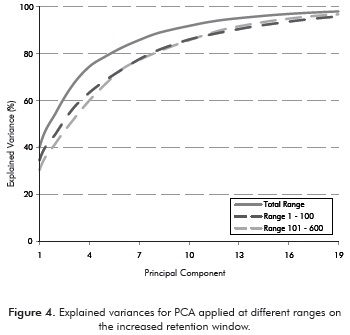
Consequently, we applied two additional PCAs, one over the range between 1 to 100 points, i.e., for hydrocarbons ≤ 10 carbón atoms, and the other over the remaining (101 to 650). Accordingly, 20 PC are required for explaining 96,5% total variance in the entire range of data where as 18 PC are required for explaining 94,5% total variance in the range between 1-100 points and 12 PC are required for explaining 96,5% total variance for times greater than 5 min (Figure 4).
Based on the parsimony principie (Seasholtz & Kowalski, 1993) along with considering that even for the lightest crude the percentage of the fraction with ≤ 10 carbón atoms is about 10%wt of the crude, these PCA results indicated that the data on the reduced región (101 to 650) had the most significant information for constructing the PCA model and that the variability in the first 100 points can negatively biased the multivariate statistics results (Figure 3). Altogether, by removing the first 100 points, a better ordering of samples and a major amount of variation described by the individual component (e.g. PC1 improved from 30% from total variables to 40% from 101 - 650 variables) were found and therefore final retention times (heavy compounds) appeared to contribute appreciable to the pattern exhibited by the score plot (Figure 5).
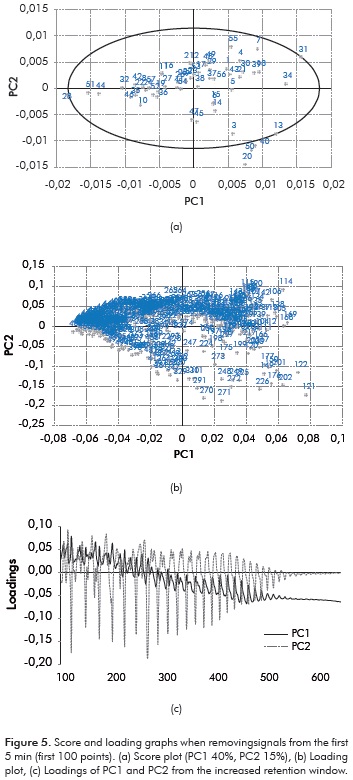
We observed from Figure 5a that crude densities appeared to be consistent with the valué of the PC1 score; i.e., the lower the crude density the greater the PC1 value. Likewise, Figure 5b indicated that the first half of the total variables (up to 300) located on the right side of the loading plot influenced the scores (Figure 5a) of the light crudes (density < 0,92 g/mL) whereas the other variables influenced the scores of the heavy crudes (density > 0,92 g/mL). Thus, PCA analysis of GC data preliminary classifies the analyzed crudes into lights with densities lower than 0,92 g/mL and heavies with densities greater than 0,92 g/mL. Inspecting the loading graph of the first two PCs with respect to retention point window (Figure 5c), we observed two distinct regions for PC1, with oscillating positive values for times less than ca. 300 points (direct relationship), and oscillating negative values at times above ca. 300 points (inverse relationship). Accordingly, light crudes exhibited positive scores for PC1 and heavy crudes showed negative scores for PC1. This explained the order obtained between density and PC1 scores. Nevertheless, a sharp separation between the crudes (light, medium and heavy) was not obtained due to the oscillating character of the PC1 loadings.
In case of the PC2 scores a special trend that relates them with the analyzed properties of the crudes was not found. This was caused by an oscillating bipolar behavior for PC2 that apparently hide a possible grouping on the samples based on this PC. Notwithstanding, it would appear that PC scores (PC1 vs. PC2) may classify crudes 13; 20; 31; 34; 40 and 50 as a group and crudes 28; 51 and 44 as another group; a closer inspection of the properties (Table 1) revealed that crudes of the former group could be classified as light, sweet (i.e., %S <0,5) and intermediate crudes of naphthenic type whereas crudes of the other group were heavy crudes exhibiting sulfur content values of about 1,5%. The relatively low data variation explained with the PC1 and PC2 latent variables (55% in total) restraint us to further group the samples based on the PCA results. Additional studies considering appropriate classification methods and data pretreatment are required to establish whether GC can be used for identifying the different crude oil families. Yet with slightly mild outliers (Hotelling T2 ellipse in Figure 5), the relatively low data variation explained (55%), the dispersion of the samples inside the Hottelling T2 ellipse and an explained variance of 41% (PC1 + PC2) of an additional PCA without 13; 20; 31; 40; 50 crudes (Figure 5a) were strong evidence for considering all the samples into the model.
Regression and Validation
Calibration of the data was based on both PC and PLS regressions. Raw GC data contained variations unrelated to the chemical composition of crude oils (e.g. time shifts, baselines and concentration effects). Due to this, different preprocessing strategies for applying multivariate regressions were considered in the current work. Strategy 1 stands for area normalization at experimental window time whereas strategy 2 deals with area normalization at the increased window time of 0,05s. On the other hand, strategy 3 involves multiplying non-normalized chromatograms by the corresponding chromatographic distillable fraction (DF=1-%Residue/100) (Table 1). Accordingly, we defined the following nomenclature PCR1, PCR2 and PCR3 for principal component regressions using 1; 2 and 3 strategies, respectively. Likewise, regressions PLS1, PLS2 and PLS3 denoted partial least squares using 1; 2 and 3 strategies, respectively. All the preprocessing strategies were tested over the entire range of retention times as well as over the retention times greater than 5 minutes for predicting both density (Table 2) and V50 (Table 3). Derivatization (Christensen, Tomasi & Hansen, 2005; Varmuza & Filzmoser, 2009) was also tested as a preprocessing strategy; however results with this strategy yielded poor performance. The calibration's results for strategies 1 and 2 for both properties in PCR and PLS indicated that the regressions for the range without the initial 5 min of retention times got better performance than for the entire range (Tables 2 and 3). This fact is in agreement with the PCA results (vs.); calibration with strategy 2 keeping out of calculation the outliers 9; 13; 31 and 34 (Tables 2 and 3) confirming that substantial improvement of the models could only be possible by rejecting the beginning part in all the chromatograms. Strategy 3 showed a conversely performance compared to the other strategies. Thus, PCR3 and PLS3 regressions performed better than their homologues for times greater than 5 min (i.e., PCR3-5 and PLS3-5, respectively). This can be explained due to DF is inversely proportional to the density of the crude. Thus, application of DF lowered the influence of the first part of chromatograms in the correlations as much as the crude density. The strategy 3 made contribution of the first part of GC for light crudes greater than for heavy crudes and therefore improved representation of crude composition. Nevertheless, PLS3-5 did not perform best than PLS1-5 and PLS2-5 because DF also altered the final part of chromatograms (Tables 2 and 3).
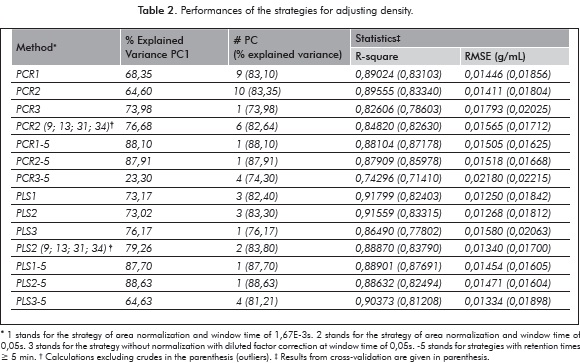
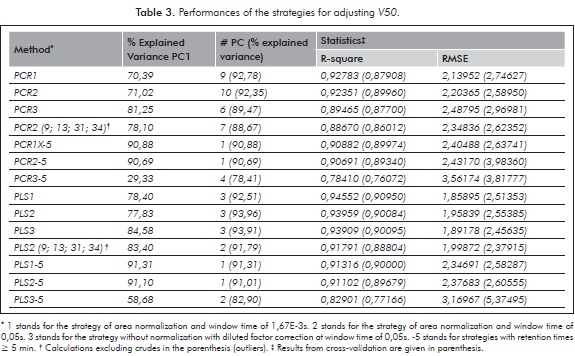
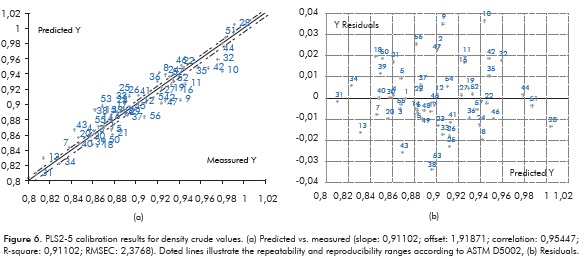
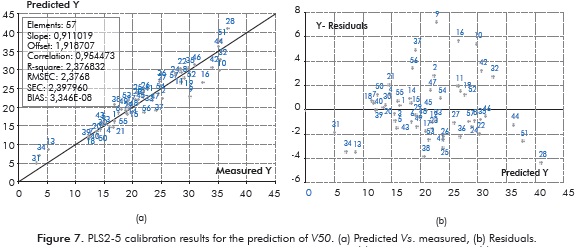
Strategies 1 and 2 evaluated over the range after 5 min (i.e., PCR1-5, PCR2-5, PLS1-5 and PLS2-5) yielded the best results in our research. This fact suggested that enlargement in window time concerned in PCR2-5 and PLS2-5 did not involve loss of valuable information in the chromatograms. Strategy PLS2-5 was selected for studying validations of density and V50 due to its best performance (Tables 2 and 3) and less computational time. Figures 6a and 7a show the results from predicted values vs. experimental ones in the PLS2-5 calibration process. Values for the correlation coefficients of 0,886 and 0,911 obtained with the strategy PLS2-5 (Figure 6a and 7a) showed a relative low fit of the models mainly caused by appreciable values of chromatographic residue in several crudes. However, considering the vast amount of interactions inside crude oils, the variety of crudes (from different geographical and geological sources) included in the research and the DF values (Table 1) along with the consideration that repeatability and reproducibility of the ASTM D5307-19 used for obtaining the chromatographic data for this study decrease with boiling points, prediction uncertainties with only one PC is worthy good (Tables 2 and 3). It is important to mention that crude oil samples were collected from several years and therefore, measurements may have errors due to slight changes in the instruments. Residuals from PLS2-5 strategy were found to be uncorrelated for both properties and, in accordance to the preceding section, non presence of outliers was identified (Figures 6b and 7b). No especial trends were found between the residuals and the different characterization factors for the samples (Table 1).
According to the results on both density and V50 the better the performance of the strategy the more value in the Root Mean Square Error (RMSE) and the less gap between RMSE from calibration and the RMSE from cross validation. Performance in density reported a RMSE of 0,01471 and an average percentual error of 1,4%. Errors by measuring density under the ASTM D5002 are for repeatability (<0,00105X) and reproducibility (0,00412X, where X is the density) values of the ASTM D5002 protocol. For the 24 crude samples used for validation, 15 were satisfactorily predicted between the repeatability and reproducibility ranges (see Figure 6a and Table 2). Density is a property that indicates the quality of a petroleum product and it is also a useful property to estimate various physical properties of petroleum fluids (Riazi & Daubert, 1987). Besides, density is required for equipment size calculation (i.e., pumps, valves, thanks and pipes) and operation (Riazi, 2005). Therefore, the more accurate value of density is used the more reliable values for properties and parameters are derived. Consequently, although the model based on g.c. data did not yield values between the variations permitted by the ASTM method for the majority of samples used for calibration, its performance in predicting density is good, even considering that the intrinsic experimental error for obtaining chromatographic data should be much higher than that of a method based on a densitometer. In our opinion, the predictions based on GC data could report useful density values for preliminary evaluations. Values for crude density are best predicted through PLS regression of NIR spectroscopy data. Pasquini and Bueno (2007) reported a RMSE of 0,24° for predicting API gravity in 79 samples ranged from 13,2° to 49,6°. Thus, predictions of density through NIR had an average error of ca. 0,003 g/mL which was better than the 0,014 g/mL (RMSE of ca. 2,5° API) obtained in the present work. Likewise, de Peinder and coworkers reported a RMSE of 0,005 g/mL for predicting density of crude blends from PLS regressions based on mathematically blended infrared spectra (de Peinder et al., 2009a). Predictions based on NIR spectra have better performance than the predictions obtained in the present work possibly due to the fact that infrared spectra is obtained with the whole crude sample while in case of chromatographic data only the distillable fraction of crudes is analyzed. This lack of information may be overcome by the incorporation of the DF. Additionally it may be said that chromatographic data has the ability to differentiate between crude oil components by its boiling point, and it could be potentially used for obtaining preliminary and very useful crude assay information.
On the other hand, despite variance calibration for V50 arose to 0,9110% with only one PC, relative errors involved in Vk predictions (Table 4, average and maximum of 64 and 1379%, respectively) had high values due to both the mathematical morphology of the index formula and the lack for chromatographic data for the heavy components of the crudes (chromatographic residues, Table 1). In fact, viscosity is the result of different molecular interactions inside the crudes, with particular important role of asphaltene distribution (Hinkle et al., 2008), and therefore predictions based on constituent fractions do not follow a linear predictable behavior (Riazi, 2005; Centeno et al., 2011); e.g. approximation to Newtonian fluid can be inappropriate to represent rheology of crude oils with high amount of complex asphaltene molecules (Centeno et al., 2011; Burg et al., 1997). As a consequence, predicting Vk through regression of chromatographic data with V50 reported the huge RMSE value of 3865,9 cSt (2,3768 in terms of V50, Table 4). The results of the regression model indicated that errors in the predictions of V50 have no special trends with crude density while errors in the predictions of Vk through solving the formula for the Refutas index tend to increase with the crude density increment (chromatographic DF decrement). This fact is in agreement with the results of Centeno et al. (2011), who tested different viscosity mixing rules and reported that all rules tended to fail with the decrease of the crude API gravity. Likewise, Centeno et al. (2011) concluded that rules with four parameters have the best performance in viscosity predictions. The tendency obtained in our investigation and the findings of Centeno et al. (2011) suggested including a four parameter into the Refutas index for improving the prediction of Vk through regression of GC data. Accordingly, the dependent variable was further modified by including DF (Table 4) to account for errors in Vk due to the missing part of the chromatograms. Therefore, the V50 formula was altered by multiplying both Vk and the complete viscosity index equation with entire exponents of the DF parameter (Table 4). As stated in Table 4, modification DF*V50(Vk*DF7) that involves calculating V50 by using Vk altered by DF7 and a subsequent softening of V50 with DF predicted best the kinematic viscosity. This strategy yielded 21%, 113% and 82,3 cSt as the average error, maximum error and RMSE, respectively. Another alternative for improving predictions of Vk is to calibrate Ln(Vk) instead of V50 (Table 4) as proposed by Burg et al. (1997) and de Ramos et al. (2009). Surprisingly, performance of the regression with the simply non parametric index Ln(Vk) was found to be better than the result with the more complex Refutas formula. A possible reason for this less performance of the Refutas index is due to its parameters were calibrated with an appreciable number of Colombian heavy oil and there-fore V50 values are biased to represent the contribution of the aromatic components that can be missing in the chromatograms. DF parameter was also included into the Ln(Vk) index and the results with the modification DF*Ln(Vk) was found to be the best for reproducing experimental Vk values (Table 4). Modification with DF*Ln(Vk) is preferred instead of DF*V50(Vk*DF7) due to its simplicity and the less number of required PC. The results in Table 4 suggest that DF is an important parameter for dependent variable modification in properties that strongly depends on the last part of the crude distillation curve. In fact, the standard deviation of experimental data, the RMSE of the regression model and the average relative error in the work of Burg et al. (1997) (Table 4, row LSER equation) were ca. 22 cSt, ca. 21 cSt and 39%, respectively, whereas in the current study (Table 4, row DF*Ln(Vk)) were ca. 370 cSt, 118 cSt and 29% respectively. These statistics showed the broad variety of the crudes and the better performance of the regression model assessed in the present study.
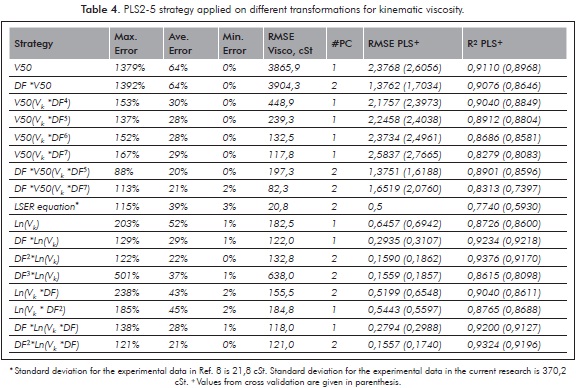
It is worth mentioning that predictive models reported average absolute deviations for Vk of between 10 and 30% (Orbey & Sandler, 1993; Riazi, 2005; Burg et al., 1997), range of accuracy in which are the predictions of the present work. With respect to spectroscopic analysis, de Peinder et al. (2009a) applied PLS modeling of NIR spectra combined with 1H and 13C NMR data, to predict the long residue properties of 48 crude oils ranged from Vk of between 28,8 and 44,1 cSt (de Peinder et al., 2009b). Though this work reported a RMSE of 1,5 cSt for the Vk prediction from regression of NIR + 1H NMR spectra, its PLS model should be validated with a broader set of crude viscosity values. On the other hand, de Ramos et al.(2009) reported the viscosity prediction of crude oils, ranging from light to extra-heavy (2 to 30000 cP) using NMR relaxation data. The oil viscosity was predicted in Log units with a standard error of prediction (SEP) of 0,161 Log cP and a R2 of 0,970. The authors argued that the model was able to predict values of viscosities completely compatible with oil exploration activity. In the current work, we obtained a higher SEP of 0,406 Ln cSt and a R2 of 0,923 for the strategy DF*Ln(Vk).These figures showed that although regression of GC data did not show the same performance of models for predicting accurate Vk values like NMR, we still believe that the results of our model were noteworthy giving the limitations in the GC tests in reporting data for heavy crude oil components (chromatographic residue). This would appear to indicate that values of Vk predicted from GC data can be used in preliminary evaluations and applications (mainly in terms of logarithm).
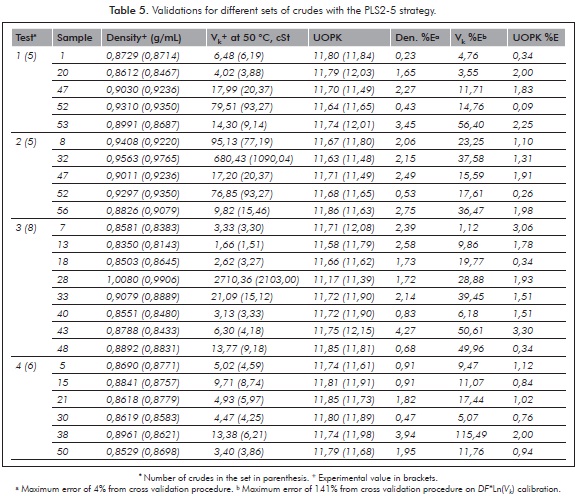
Validations with the adjusted model PLS2-5 were based on the list of 57 crudes. Different sets of crudes were left out from the list and their densities and Vk (with the strategy DF*Ln (Vk)) predicted from calibrations with the remainders. Table 5 shows the results for the prediction with different set of samples. Maximum relative errors found in the prediction of density and Vk were ca. 4 and ca. 115%, respectively. These relative errors were in agreement with the results for both properties from cross validation procedure which reported maximum and average relative errors of 4 and 1,4%, respectively, for density and 141 and 31%, respectively, for Vk. UOP characterization factor (K), which is indicative of the crude oil nature, was estimated for each crude based on the calculated densities and Vk by use of the UOP method 375-07. From Table 5 we can note that the maximum error in predicting K was 3,3% which has the same order of magnitude than for density. Errors in viscosity have much less influence in predicting K due to Vk is utilized in logarithmic terms. The preceding example illustrates the application of predicted densities and viscosities for qualitative evaluations.
4. CONCLUSIONS
-
In spite of the afore mentioned limitations and variations of the chromatographic data, the prediction models obtained from the information provided by this technique were quite acceptable, even considering the higher instrumental error inherent to this method that includes effect of solvent, correction of the retention time scale, calibration based on a series of normal paraffins, injection-vaporization of sample, among others. Future work focused on that can probably deliver very powerful and more useful models not only to estimate discrete properties but more detailed information like that contained in crude assays, considering the fact that the chromatographic signal provided by the FID detector is a function of elution of crude components from the column that could be correlate with the properties of crude fractions.
-
PCA is a valuable tool for discriminating relevant information in the gas chromatograms of crude oils. Results from PC analysis suggested removing the signal of the first 5 min of recorded times from the analysis due to an overestimation in the loadings for volatile compounds. Without the first 5 min, a better grouping of samples and distribution of the variable correlation were obtained. Particularly, light crudes exhibited positive PC1 scores whereas heavy crudes, with densities greater than 0,92 g/mL, exhibited negative PC1 scores. According to calibration of preprocessed GC data for predicting density and viscosity (Vk) through the V50 index, regressions PLS1-5 and PLS2-5 (without the first 5 min of retention times) got better performance than PLS1 and PLS2 (the complete chromatogram). Even though PLS2-5 predictions of density reported a higher RMSE than the reported reproducibility of the ASTM method used to measure this property, it has shown to be very useful in obtaining preliminary information of a crude and it can be potentially extended to estimate properties of crude fractions since FID signal can be worked out separately and correlated with the respective fraction properties.
-
As the calibration of V50 reported large errors in the prediction of Vk (RMSE of 3865,9 cSt and average error of 64%), other transformations for this property involving the DF and logarithms were tested to improve the model. Results showed that DF compensates missing chromatogram and therefore improve the regression of Vk. The simple mathematical formula DF*Ln (Vk) yielded the best Vk predictions which are roughly equivalent to predictions obtained from NMR regressions, even considering the much lower experimental error involved in the NMR spectrum acquisition.
ACKNOWLEDGMENT
Support was given by ECOPETROL S.A., who funded the work in all stages.
REFERENCES
Ali, F. A., Ghaloum, N. & Hauser, A. (2006). Structure representation of asphaltene GPC fractions derived from Kuwaiti residual oils. Energy & Fuels, 20 (1), 231-238. [ Links ]
Aske, N., Kallevik, H. & Sjöblom, J. (2001). Determination of Saturate, aromatic, resin, and asphaltenic (SARA) components in crude oils by means of infrared and near-infrared spectroscopy. Energy & Fuels, 15 (5), 1304-1312. [ Links ]
ASTM D5002 - 99 (2010). Standard Test Method for Density and Relative Density of Crude Oils by Digital Density Analyzer. Anual Book of Standards. West Conshohocken (PA), ASTM International. [ Links ]
ASTM D445 - 11a (2011). Standard Test Method for Kinematic Viscosity of Transparent and Opaque Liquids (and Calculation of Dynamic Viscosity). Anual Book of Standards. West Conshohocken (PA), ASTM International. [ Links ]
ASTM D5307 - 97 (2007). Standard Test Method for Determination of Boiling Range Distribution of Crude Petroleum by Gas Chromatography. Anual Book of Standards. West Conshohocken (PA), ASTM International. [ Links ]
Baird, C. T. (1989). Guide to petroleum product blending. Austin (TX): HPI Consultants, Inc. [ Links ]
Barwick, V. J. (1999). Sources of uncertainty in gas chromatography and high-performance liquid chromatography. J. Chromatogr. A, 849 (1), 13-33. [ Links ]
Bodle, E. S. & Hardy, J. K. (2007). Multivariate pattern recognition of petroleum-based accelerants by solid-phase microextraction gas chromatography with flame ionization detection. Anal. Chim. Acta, 589 (2), 247-254. [ Links ]
Burg, P., Selves, J. L. & Colin, J. P. (1997). Prediction of kinematic viscosity of crude oil from chromatographic data. Fuel, 76 (11), 1005-1011. [ Links ]
Centeno, G., Sánchez-Reyna, G., Ancheyta, J., Muñoz, J. A. D. & Cardona, N. (2011). Testing various mixing rules for calculation of viscosity of petroleum blends. Fuel, 90 (12), 3561-3570. [ Links ]
Christensen, J. H., Tomasi, G. & Hansen, A. B. (2005). Chemical fingerprinting of petroleum biomarkers using time warping and PCA. Environ. Sci. Technol., 39 (1), 255-260. [ Links ]
Crawford, N. R. & Hellmuth, W. W. (1990). Refinery octane blend modelling using principal components regression of gas chromatography data. Fuel, 69 (4), 443-447. [ Links ]
de Peinder, P. , Visser, T., Petrauskas, D. D., Salvatori, F., Soulimani, F. & Weckhuysen, B. M. (2009a). Prediction of long-residue properties of potential blends from mathematically mixed infrared spectra of pure crude oils by partial least-squares regression models. Energy & Fuels, 23 (4), 2164-2168. [ Links ]
de Peinder, P. , Visser, T., Petrauskas, D. D., Salvatori, F., Soulimani, F. & Weckhuysen, B. M. (2009b). Partial least squares modeling of combined infrared, 1H NMR and 13C NMR spectra to predict long residue properties of crude oils. Vibrational Spectroscopy, 51 (2), 205-212. [ Links ]
Esbensen, K. H. (2001). Multivariate data analyses - In practice. 5th ed.; Esbjerg: CAMO, Aalborg University. [ Links ]
Evans, E., Batts, B. & Cant, N. (1987). The yield of Australian oil shales as determined by nuclear magnetic resonance and infrared spectroscopy. Fuel, 66 (3), 326-330. [ Links ]
Falla, F. S., Larini, C., Le Roux, G. A. C., Quina, F. H., Moro, L. F. L. & Nascimento, C. A. O. (2006). Characterization of crude petroleum by NIR. J. Petroleum Science and Eng., 51 (1-2), 127-137. [ Links ]
Flumignan, D. L., de Oliveira-Ferreira, F., Tininis, A. G. & de Oliveira, J. E. (2008). Multivariate calibrations in gas chromatographic profiles for prediction of several physicochemical parameters of Brazilian commercial gasoline. Chemom. Intell. Lab. Syst., 92 (1), 53-60. [ Links ]
Fredericks, P. M., Lee, J. B., Osborn, P. R. & Swinkels, D. A. J. (1985). Materials characterization using factor analysis of FT-IR spectra. Part 1: Results. Applied Spectroscopy, 39 (2), 303-310. [ Links ]
Geladi, P. & Kowalski, R. B. (1986). Partial least square regression: A Toutorial. Anal. Chim. Acta., 185: 1-17. [ Links ]
Hannisdal, A., Hemmingsen, P. V. & Sjöblom, J. (2005). Group-type analysis of heavy crude oils using vibrational spectroscopy in combination with multivariate analysis. Ind. Eng. Chem. Res., 44 (5), 1349 - 1357. [ Links ]
Hinkle, A., Shin, E. J., Liberatore, M. W., Herring, A. M. & Batzle, M. (2008). Correlating the chemical and physical properties of a set of heavy oils from around the world. Fuel, 87 (13-14), 3065-3070. [ Links ]
Jackson, J. E. (1991). A user's guide to principal components. New York: John Wiley & Sons, Inc. [ Links ]
Kallevik, H. (1999). Characterization of crude oil and model oil emulsions by means of near infrared spectroscopy and multivariate analysis. Norway: University of Bergen. [ Links ]
Molina, D., Navarro, U. & Murgich, J. (2007). Partial Least-Squares (PLS) correlation between refined product yields and physicochemical properties with the 1H Nuclear Magnetic Resonance (NMR) spectra of Colombian crude oils. Energy & Fuels, 21 (3), 1674-1680. [ Links ]
Molina, D., Navarro, U. & Murgich, J. (2010). Correlations between SARA fractions and physicochemical properties with 1H NMR spectra of vacuum residues from Colombian crude oils. Fuel, 89 (1), 185-192. [ Links ]
Orbey, H. & Sandler, S. I. (1993). The prediction of the viscosity of liquid hydrocarbons and their mixtures as a function of temperature and pressure. Can. J. Chem. Eng., 71 (3), 437-446. [ Links ]
Otto, M. (1999). Chemometrics, satistics and computer application in analytical chemistry. Weinheim: Wiley-VCH Verlag GmbH. [ Links ]
Pasquini, C. & Bueno, A. F. (2007). Characterization of petroleum using near-infrared spectroscopy: Quantitative modeling for the true boiling point curve and specific gravity. Fuel, 86 (12-13), 1927-1934. [ Links ]
Ramos, P. F. d. O., de Toledo, I. B., Nogueira, C. M., Novotny, E. H., Vieira, A. J. M. & Azeredo, R. B. d. V. (2009). Low field 1H NMR relaxometry and multivariate data analysis in crude oil viscosity prediction. Chemometr. Intell. Lab. Syst., 99 (2), 121-126. [ Links ]
Reid, L. M., O'Donnell, C. P. & Downey, G. (2004). Potential of SPME-GC and chemometrics to detect adulteration of soft fruit purées. J. Agric. Food Chem., 52 (3), 421-427. [ Links ]
Riazi, M. R. (2005). Characterization and properties of petroleum fractions. Philadelphia: ASTM international. [ Links ]
Riazi, M. R. & Daubert, T. E. (1987). Characterization parameters for petroleum fractions. Ind. Eng. Chem. Res., 26 (4), 755-759. [ Links ]
Seasholtz, M. B. & Kowalski, B. (1993). The parsimony principle applied to multivariate calibration. Anal. Chim. Acta, 277 (2), 165-177. [ Links ]
Silva, S. L., Silva, A. M. S., Ribeiro, J. C., Martins, F. G., Da Silva, F. A. & Silva, C. M. (2011). Chromatographic and spectroscopic analysis of heavy crude oil mixtures with emphasis in nuclear magnetic resonance spectroscopy: A review. Anal. Chim. Acta, 707 (1-2), 18-37. [ Links ]
Skrobot, V. L., Castro, E. V., Pereira, R. C., Pasa, V. M. & Fortes, I. C. (2007). Use of Principal Component Analysis (PCA) and Linear Discriminant Analysis (LDA) in Gas Chromatographic (GC) data in the investigation of gasoline adulteration. Energy & Fuels, 21 (6), 3394-3400. [ Links ]
Varmuza, K, & Filzmoser, P. (2009). Introduction to multivariate statistical analysis in chemometrics. Florida: CRC Press. [ Links ]
Wold, S., Albano, C., Dunn, W. J., Edlund, U., Esbensen, K., Geladi, P., Hellberg, S., Johansson, E., Lindberg, W. & Sjöström, M. (1984). Multivariate data analysis in chemistry. in: chemometrics, mathematics and statistics in chemistry. B. R. Kowalski (ed.). Dordrecht: D. Reidel Publishing Company. [ Links ]
Wold, S., Esbensen, K. & Geladi, P. (1987). Principal component analysis. Chemom. Intell. Lab. Syst., 2 (1-3), 37-52. [ Links ]