Serviços Personalizados
Journal
Artigo
 Inglês (pdf)
 Artigo em XML
 Referências do artigo
 Enviar este artigo por email
Indicadores
-
 Citado por SciELO
 -
 Acessos
Links relacionados
-
 Citado por Google
 -
 Similares em
SciELO
Similares em
SciELO -
 Similares em Google
Compartilhar

 Permalink
CT&F - Ciencia, Tecnología y Futuro
versão impressa ISSN 0122-5383
C.T.F Cienc. Tecnol. Futuro vol.5 no.3 Bucaramanga jul./dez. 2013
ESTIMATION OF DENSITY AND FRACTURE ORIENTATION IN HTI MEDIA THROUGH AZIMUTHAL ANALYSIS OF P-WAVES
ESTIMACIÓN DE DENSIDAD Y ORIENTACIÓN DE FRACTURAS EN MEDIOS HTI MEDIANTE ANÁLISIS ACIMUTAL DE ONDAS P
Diana-Marcela Cortes-Gómez1, William-Mauricio Agudelo-Zambrano2 and Luis-Alfredo Montes-Vides3*
1Ecopetrol S.A. - Superintendencia Operación Exploratoria, Bogotá, Cundinamarca, Colombia
2Ecopetrol S.A. - Instituto Colombiano del Petróleo (ICP), A.A. 4185 Bucaramanga, Santander, Colombia
3Universidad Nacional de Colombia, Bogotá, Cundinamarca, Colombia
E-mail: lamontesv@unal.edu.co
(Received: Jun. 04, 2013; Accepted: Nov. 25, 2013)
*To whom correspondence should be addressed
ABSTRACT
In a medium with Horizontal Transverse Isotropy (HTI) associated with fractures, Normal Move Out (NMO) velocity varies ellipsoidally with the azimuth. The major axis of the ellipse indicates the direction of the fractures. Also, density is defined by the axial ratio. We are presenting a methodology to estimate fracture parameters based on the difference of NMO times measured in two orthogonal common midpoint seismic lines. The method was tested with synthetic data and then applied in seismic data of the La Luna Formation in the Tenerife Field, providing the orientation of the fractures as well as an estimated density. Results were validated by analysis of Fullbore Formation Microimager FMI logs acquired in wells in the vicinity of the Field.
Keywords: Tenerife field, HTI anisotropy, Fractures, Stress.
RESUMEN
En un medio con anisotropía transversal horizontal (HTI, por sus siglas en inglés) asociada a fracturas, la velocidad de corrección dinámica (NMO, por sus siglas en inglés) varía elipsoidalmente con el acimut. El eje mayor de la elipse indica la dirección de las fracturas y la densidad es definida por la relación entre ejes menor/mayor. Se presenta una metodología basada en la diferencia del tiempo NMO entre dos líneas sísmicas ortogonales a igual distancia fuente-receptor para estimar estos dos parámetros de fractura. El método fue probado con datos sintéticos y luego aplicado en datos sísmicos de la formación La Luna en el Campo Tenerife, suministrando la tendencia en dirección de los planos de fracturas así como un estimativo de densidad. Los resultados se validaron mediante el análisis de registros de imágenes FMI adquiridos en pozos en la vecindad del campo.
Palabras clave: Campo Tenerife, Anisotropía HTI, Fracturas, Esfuerzos.
RESUMO
Em um meio com anisotropia transversal horizontal (HTI, por sua sigla em inglês) associada a fraturas, a velocidade de correção dinâmica (NMO, por sua sigla em inglês) varia elipsoidalmente com o azimute. O eixo maior da elipse indica a direção das fraturas e a densidade é definida pela relação entre eixos menor/maior. Apresenta-se uma metodologia baseada na diferença do tempo NMO entre duas linhas sísmicas ortogonais a igual distância fonte-receptor para estimar estes dois parâmetros de fratura. O método foi aprovado com dados sintéticos e logo aplicado em dados sísmicos da formação La Luna no Campo Tenerife, fornecendo a tendência em direção dos planos de fraturas assim como uma estimativa de densidade. Os resultados foram validados mediante a análise de registros de imagens FMI adquiridos em poços na vizinhança do Campo.
Palavras-chave: Campo Tenerife, Anisotropia HTI, Fraturas, Esforços.
1. INTRODUCTION
All reservoirs are naturally fractured to a greater or lesser degree and usually have sonic logs. Simulations have been performed to study the effect of fractures on acoustic wave velocity (Wang & Li, 2003; Luo & Evans, 2004) and there has been interest in the use of azimuthal variations of seismic amplitude to detect high productivity points related to fractures (Hao et al., 2011). Traditio-nally, information about fractures has been available in outcrops, cores, well logs or in the Fullbore Formation Microimager FMI. Lefeuvre (1994) showed a metho-dology to detect fractures by studying the variation in amplitudes of the P wave based on offset and azimuth. Physical modeling (Wang & Li, 2003; Sayers & Ebrom, 1997) shows that for moderately far offsets (25° to 35° angle of incidence), P waves that travel on the plane parallel to vertical fractures have greater velocity than P waves traveling on a plane perpendicular to fractures. Azimuthal analysis of amplitude with offset of acoustic wave can be used to predict fractures (Li, 1999). Density and fracture orientation maps created using the aniso-tropy of the azimuthal P wave are consistent with FMI interpretation and the extraction data of borehole samples (Zhan et al., 2010). In this direction, proposals have been reported to elucidate fracture analysis considering variation of travel time with the azimuth (Zheng, Todorovic & Larson, 2004). A fractured reservoir can be considered a medium with horizontal anisotropy (HTI) or vertical anisotropy (VTI), which affects the azimuthal variation of velocities of acoustic and shear waves. Similarly, it affects the stacking amplitude and stack velocity of these two wave types (Thomsen, 1988; Tsvankin, 1997). It has been demonstrated that density and orientation of fractures can be extracted based on the analysis of these variations with azimuth (Zheng et al., 2004). Fracture density estimation using seismic data has shown to be relatively stable, but estimating fracture orientation is sensitive to the phase of seismic waves and types of geological interfaces. Besides, the anisotropy might be related to the presence of fracture but also to variations in local stress or the combined effect of both.
Geological Setting
Figure 1a illustrates the location of the Tenerife 3D-3C project and the seismic line DM-1987-1470 in the basin of the Middle Magdalena Valley, while the migrated seismic section of Figure 1b contains the interpretation of mentioned seismic line, highlighting the La Luna Formation underlying the Umir formation. The basin is a tectonic depression with a homoclinal trend and three main depositional sequences: (a) Triassic-Jurassic deposited in continental to marginal environments in extensional tectonics blocks and limited by sub-vertical faults, b) Cretaceous-Paleocene deposited in an forearc basin in the thermal subsidence phase at marine conditions of platform that changed to transitional in the Maastrichtian; and c) Middle Eocene deposited in continental environments in a foreland basin up to the Middle Miocene and intra-mountain up to the present. During the Middle Eocene, the western central sector of the basin was influenced by a compressive event that deformed the Cretaceous sediments, folding them into structural systems formed by reverse faulting with eastward sloping being preserved under the Upper Eocene and Oligocene sediments. Deformation in the basin is associated with the formation of the Central and Oriental Mountain Ranges. During the Triassic and Early Cretaceous, the basin area behaved as a rift zone whose depositions are mainly sediments resulting from Ranges uplift. During the Cretaceous period, it began to behave as a back-arc located behind the Andean subduction zone with predominantly marine sedimentation. During the Late Cretaceous and the Paleocene, the basin was subjected to compressive deformation due to the accretion of the eastern area on the South American Craton, which caused the folding of the Cretaceous sequence and the erosion thereof in the area of the Fields. In the Oligocene, there was uplift in the Central Area while the Magdalena Basin and the Eastern area were part of a foreland basin whose fluvial, fluvio-paludal (Lagoon) or fluvio-deltaic sediments lie unconformably on the tertiary sequence. During the Paleocene and the Late Miocene, there were folds and thrusts in the eastern sector, followed by a regional mountain uplift that marked the eastern part of the Middle Magdalena Valley giving it the form it has today. The Umir and La Luna cretaceous formations, which are the subject of this study are illustrated in Figure 1c. The La Luna Formation (Upper Cretaceous) is divided from base to top into: the Salado member (Turonian) composed of black calcareous mudstone interbedded with micrite, deposited in a anoxic sulphidic environment favoring the preservation of organic matter; the Pujama member (Turonian - Lower Coniciano) made up of gray calcareous mudstone with thicknesses ranging from 50 to 225 m, the Galembo member (Coniciano - Santonian) of gray micritic limestone interbedded with chert, gray and black siliceous mudstone with thicknesses from 180 to 350 m, deposited in a pelagic environment of deep marine facies that becomes a neritic environment with oxygenation at the top. The Umir Formation (Campa-nian - Maastrichtian) is composed of gray mudstone with layers of siltstone, coal and fine sand at the top. The environment thereof varies from neritic (bottom) to plain, tidal and delta front at the top, with a thickness of up to 1400 m. The Tertiary sedimentation includes deposits of incised valleys, anastomosing rivers, flood plains with marine, fluvial and alluvial fans. The sequence increases in thickness toward the east under the fold belt exposed along the west flank of the mountain range.
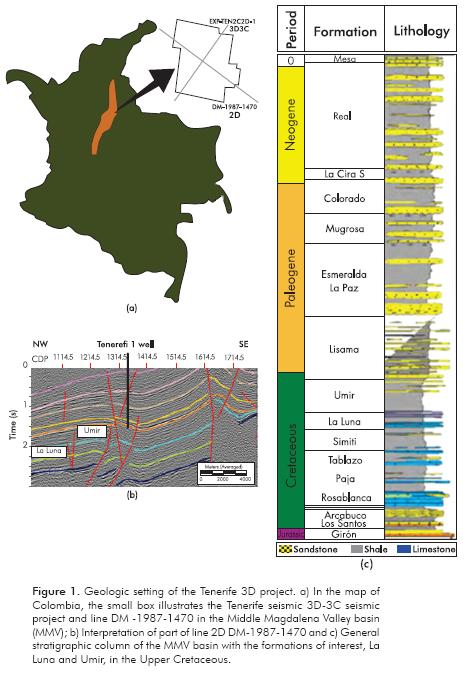
The base is defined by a regional discontinuity dipping to the east, which separates the underlying pre-Tertiary strata of the Miocene-Eocene sediments.
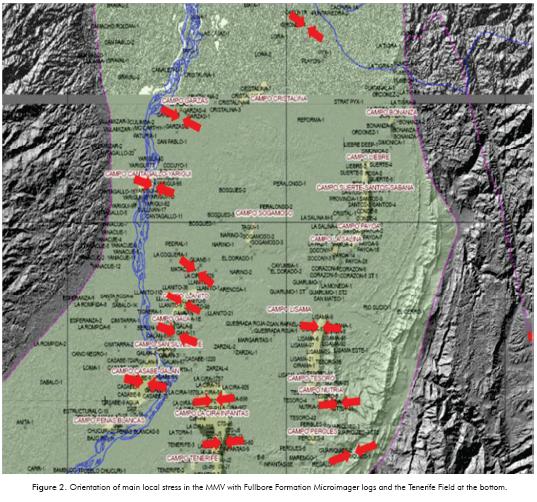
Stress System
Research on regional stress in the Middle Magdalena Valley basin (Cortes & Angelier, 2005) indicate a main stress in the northern sector of the Eastern Mountain Range and the western flank of the Central Mountain Range (4°N north) with a geodynamics influenced by the Caribbean plate. The direction of the maximum stress runs WSW – ENE to the north of 4°N, characterized by a compression predominant inverse that transforms to NW-SE in the Andes of Mérida, Venezuela. There, it becomes mainly a strike-slip fault with stress direction estimated by analysis of focal seismic mechanisms (Toro, 2005). Research at Ecopetrol S.A. - Instituto Colombiano del Petróleo (ICP) with Fullbore Formation Microimager logs in fields of the area defined the main efforts in the MMV basin, as illustrated in Figure 2.
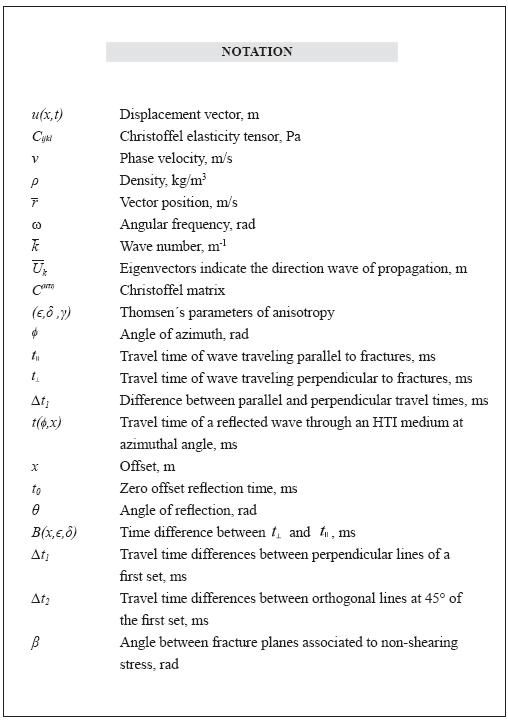
2. THEORETICAL FRAMEWORK
In a continuous elastic anisotropic and homogeneous medium, Newton's second law is expressed as:
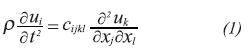
with u(x,t) as the displacement vector and Cijkl the elasti-city tensor; this equation leads to the Christoffel equation:
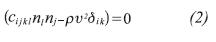
Here, v is phase velocity and ρ is density. Plane wave  is the solution of Equation 2 subject to
  where
where  is position, ω angular frequency and
  is wave number. Equation 2 becomes the eigenvector and eigenvalue system:
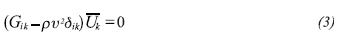
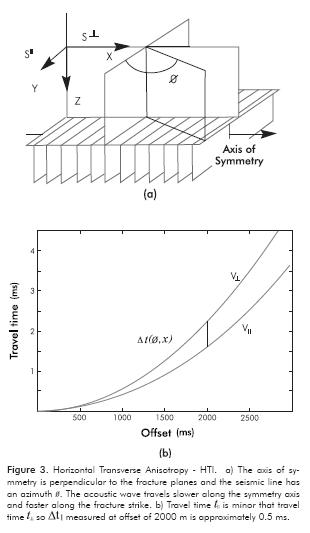
Gik=Cijklnlnj is the Christoffel matrix and  are the eigenvectors that indicate the direction of propagation, with eigenvalues associated with the phase velocities of the acoustic wave and two perpendicular shear waves. Polar anisotropy is known as VTI when the axis of symmetry is vertical, and HTI when the axis of symmetry is horizontal. See Figure 3a.
For HTI mediums, the Christoffel matrix is given by
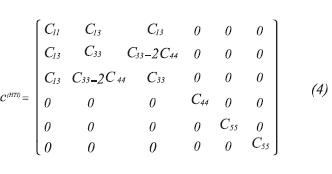
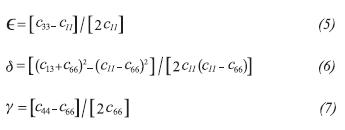
which is related to the parameters of anisotropy (ε, δ, γ) as follows (Thomsen, 1986):
The travel time of a reflected wave through an HTI medium along a line at azimuthal angle θ with respect to the direction of the fractures is given by the expre-ssion (Li, 1999):
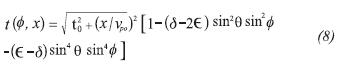
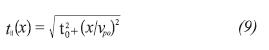
Where x is the offset, t0 is zero offset reflection time, θ is the angle of reflection measured from the vertical axis. The term within the square root is the Normal Move Out (NMO) correction. When the line is parallel to the fractures (Φ=0) NMO time is:
and when it is perpendicular (Φ=π/2) NMO time changes to:
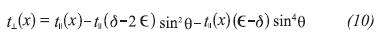
Upon replacing Equations 9 and 10 in Equation 8, we get:
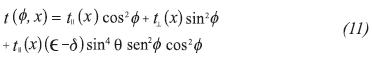
Equation 11 expresses travel time of a reflection at base of an HTI at azimuthal angle Φ in terms t1 and t1 which are NMO times at offset x for the survey lines parallel and perpendicular to the fracture strike, see Figure 3a. Azimuthal analysis of the NMO response is carried out along two orthogonal lines with azimuths Φ and Φ +π/2, and it is defined as the difference in travel time between the two lines and is given by:

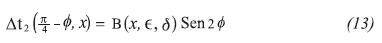
In Φ =0 case Equation 12 expresses the time difference shown in Figure 3B. The lower curve corres-ponds to an acoustic wave traveling in fracture strike direction and the other curve to the wave traveling in symmetry axis direction. Four intersecting survey lines with 45° separation are arranged into two orthogonal sets, the NMO time for the first set will be denoted as Δt1 (Φ, x) and the second set as Δt2 (π/4- Φ, x), the NMO time difference between lines of the second set becomes:
The quotient between the NMO time differences of both sets will be

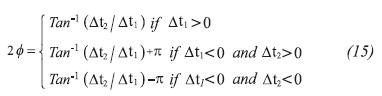
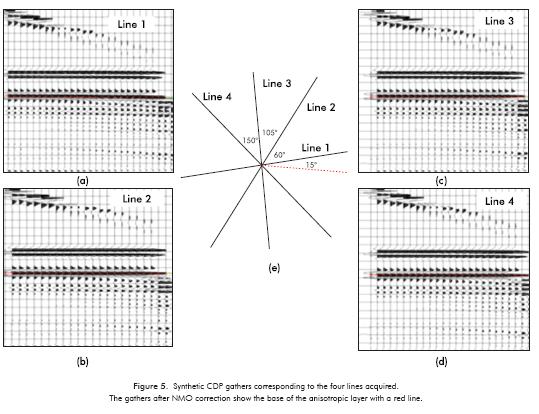
Equation 14 indicates that in a cross plot between the time differences established by Equations 12 and 13, the points agglomerate around a line that estimated by a least-square linear regression, has a slope equals to Tan2Φ where Φ sets the angle of the fracture planes. Positive Φ represents a counterclockwise rotation from line 1 to the fracture strike as shown in Figure 5e. The definition of the angle Φ is established using the following rules (Li, 1999):
The azimuthal variation of travel times comes close to an ellipse with the major axis indicating the fracture plane, and the quotient between the minor axis and the major axis is proportional to density (Li et al., 2003). The NMO time of a 3D CDP gather corresponds to an ellipse whose parameters: major and minor axis and angle of orientation of the ellipse are estimated by solving the equation of the parametric ellipse:
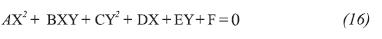
Here Y are the azimuthal angles (Φ) and X are the azimuthal variation of travel times (Δt).
Testing with Synthetic Data
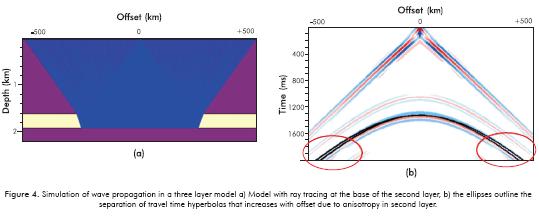
Synthetic data were generated using the Tesseral-Pro software based on an elastic anisotropic model, in which each layer is represented as a homogeneous medium that includes anisotropy defined by 7 para-meters: Density (ρ), acoustic and shear wave velocities (vp,vs) along the axis of symmetry of the TTI medium, Thompson parameters (ε,δ,γ) and tilt angle of the axis of symmetry in the vertical direction (Φ). The model has three layers with thicknesses of 1400, 200 and 1000 m respectively, where the second layer is anisotropic. See Figure 4a. The parameters that determine fracture anisotropy were obtained with values ε=0.334, δ=0.62, γ=0.14, α=0.05. Two models were considered, a three isotropic layers model and another model with a second HTI - anisotropic layer. The synthetic shot gathers provided by simulating waves traveling across both models were superimposed and depicted in Figure 4b, where the deeper hyperbolas are travel times of waves reflected at base of the second layer in each model (black line on the log); the ellipses on travel time show a separation on both hyperbolas that increases with offset due to the delay caused by anisotropy in second layer.
CDP gathers were created with lines oriented by angles of 15º, 60º, 105º and 150º in the direction of the fracture planes. Figure 5 shows four CDP gathers with NMO correction corresponding to the lines with angles of 15° (5a), 60° (5b), 105° (5c) and 150° (5d).
The travel times across the anisotropic layer are picked in along each line and then each orthogonal pair are subtracted using the Database/Header Transfer and Trace Header Math tools by ProMAX and saved in the database.
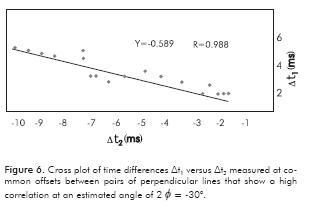
A cross plot is created between the differences in time between orthogonal lines and angle 2Φ is determined as illustrated in Figure 6. According to the rules established in Equation 15, the result corresponds to a positive value of 2Φ = -30° with a correlation of 0.988, that is an Φ angle of -15° from Line 1which sets the x axis.
Application to Real Data
Some considerations must be taken into account to ensure the suitability of the approach and the reliability on the provided results. An enhanced azimuthal response is obtained in case of a strong low/high impedance contrast between the anisotropic and the underlain layer, while in case of a strong high/low contrast the response is weakened. On the other hand, the sensitivity becomes higher with offset in general, hence to obtain an appreciable difference the offset must be greater that depth. In case of low sensibility associated to high/low or weak impedance contrast a higher offset to depth ratio is required.
To apply the method on real data, four lines were used: the 2D lines DM-1987-1470 (1st line at -30º or the equivalent 150º) and EXP-TEN2C2D-1 (3rd Line at 15º), and an Inline (2nd line at 60º) and an Xline (4th line at 105º) from the TENERIFE 3D-3C. The available seismic logs have a good signal to noise ratio, with a frequency range of up to 80 Hz in spectral content at -30 dB attenuation, a dominant frequency of appro-ximately 30 Hz and the Ground roll at an acceptable range with frequencies of up to 16 Hz. The first arrivals have good definition and there is good energy penetration leading to a good signal to noise ratio deep in the logs. Figure 7 shows the lines processed, which look a little noisy before applying filters or noise attenuators. However, the reflectors of interest look well-defined in the CDP gathers. Figure 7 shows that the gathers have an irregular offset distribution, which is undesirable for the analysis because it requires travel times estimated at every offset to guarantee the continuity of the picked reflector. Therefore, they were reprocessed to improve such distribution. The lines were reprocessed by creating super CDP gathers and, thus, increasing bin size. The horizons of interest were determined based on the interpretation of line DM-1987-1470 on the CDP gathers with static corrections and dynamic NMO co-rrection. Vertical resolution ranges from 16 to 22 m, and lateral resolution varies from 30 to 40 m with a Fresnel zone of 85 m, value close to bin size.
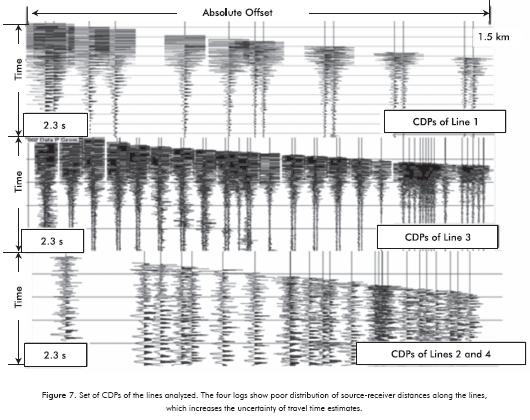
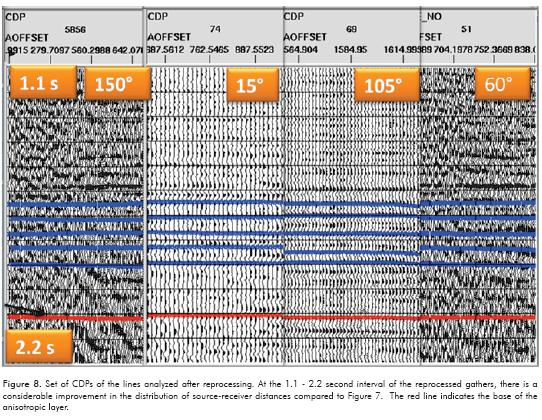
Figure 8 shows some gathers after reprocessing with an improved signal to noise ratio, and where there are more traces disposed regularly in a wide range of offsets that guarantee the continuity of the picked reflector and, hence, the reliability of the provided results. The red line indicates the refection at the base of the La Luna Formation, which is considered anisotropic, and the blue lines corresponds to picked horizons in the Umir Formation used as guide to control the red picking.
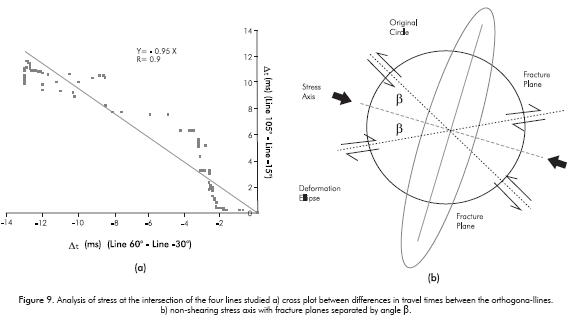
After that, travel times on the horizon of interest were calculated, and the crossing diagram in Figure 9a was made, which represents the variation between the difference in times of each orthogonal pair of lines (Δt) in terms of the offset. This behavior means that the difference in time increases as offset increases; that is the minimum requirement to perform the analysis. The estimated value of angle 2 Φ is -43.41°, with a correlation of 0.9 measured from Line 1. Therefore, the angle of fracture orientation in this formation is approximately -22° from Line 1 or -58° with respect to abs-cissa E-O. In a compressive stress regime, fractures are generated as a result of the relative slip of particles along symmetrical conjugated planes separated by angle 2β close to 60° (Duque-Escobar, 2003), with the direction of main stress on the axis of symmetry as shown in Figure 9b. The above implies that the main axis of compression stress is at an approximate angle of -18° or 108°, which is correlated with the stress values observed in the vicinity of the Tenerife Field, at the bottom of Figure 2.
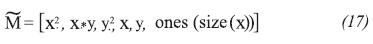
Time intervals between top and base of La Luna formation were used to determine fracture density. This statistical analysis took a minimum offset of 500 m and a maximum of 1500, because it is the largest line offset with the least coverage; data were selected in sets every 200 m of offset to obtain the maximum value of the time gradient. The range of points was projected orthogonally, creating matrix M associated with the equation of the ellipse.
To generate the ellipses for each range in each offset, matrix  was broken down into singular values using the Matlab function
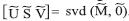
Matrix  contains the solution values of the equation of the ellipse:
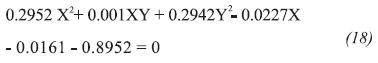
Ratio A/B = 13% is an estimate that is proportional to the density of fractures at this point; this value could not be validated due to the absence of values reported in said area.
3. CONCLUSIONS
-
The method was implemented to estimate density levels and fracture plane direction, which was pre-viously validated with synthetic data showing robustness and reliability. Applied to four seismic lines, the method allowed the estimation of fracture tendency and density in the Tenerife Field. In the compressive stress regime of the area, generated fractures relates the main axis of compression stress with the fracture strike estimate, which was correlated with the stress values observed in the vicinity of the Tenerife Field. This result agrees with conducted studies on the evolution of the paleo-stress in the northern Andes, the condition of the stress in the same zone based on focal seismic mechanisms (Cortes & Angelier, 2005) and well log analyses carried out at the Instituto Colombiano del Petróleo (ICP). Although there are well logs (total of three wells) in the Tenerife Field, the cretaceous objective has not been achieved yet and hence there is not a Fullbore Formation Microimager available to validate the estimated density and fracture strike. However, due to future interest, the method would support a fracture analysis before drilling. The result is a contribution in this region, corroborated by reports on fracturing associated with anticline folds and sub-outcrops against the discordance of the Middle Eocene, as reported in the map of main local stress in the Middle Magdalena Valley basin.
- Even though the objective of this research was to estimate fracture parameters, the provided values can be used to estimate zonal stress distribution.
- Before applying the method, some considerations about seismic survey and geology must be taken, requiring high offset to depth ratios especially in cases of weak or high to low impedance contrast. The method may be particularly useful in 2D projects where pairs of orthogonal lines -or four lines each one with a different azimuth- are available
ACKNOWLEDGEMENTS
The authors would like to thank Ecopetrol S.A. and, in particular, the Instituto Colombiano del Petróleo (ICP), the Corrigan Fund of the ACGGP and the Universidad Nacional de Colombia for their support on the project. This paper is the result of the dissertation for a Master's Degree in Geophysics by Engineer Diana Cortes, at the Departamento de Geociencias, Universidad Nacional de Colombia, funded by Ecopetrol S.A. - ICP.
Also, we render thanks to reviewers whose suggestions contributed to improve this document.
REFERENCES
Cortes, M. & Angelier, J. (2005). Current states of stress in the northern Andes as indicated by focal mechanisms of earthquakes. Tectonophysics, 403(1-4), 29-58. [ Links ]
Duque-Escobar, G. (2003). Manual de geología para ingenieros. Manizales: Universidad Nacional de Colombia. [ Links ]
Hao, H., Zhang, J., Junying, L., Xueshan, Y. & Wuyang, Y. (2011). A way of arbitrary azimuth fracture estimation. International Geophysical Conference, Shenzhen, China. [ Links ]
Lefeuvre, F. (1994). Fracture related anisotropy detection and analysis. SEG Annual Meeting, Los Angeles, USA. [ Links ]
Li, X., Liu, Y., Liu, E., Shen, F., Qi, L. & Shouli, Q. (2003). Fracture detection using land 3D seismic data from the Yellow River Delta, China. The Leading Edge, 22(7), 680-683. [ Links ]
Li, X. Y. (1999). Fractures detection using azimuthal variation of P-wave moveout from orthogonal seismic survey lines. Geophysics, 64: 1193-1201. [ Links ]
Luo, M. & Evans, B. (2004). An amplitude-based multiazimuth approach to mapping fractures using P-wave 3D seismic data. Geophysics, 69(3), 690-698. [ Links ]
Sayers, C. & Ebrom, D. (1997). Seismic travel time analysis for azimuthally anisotropic media: Theory and experiment. Geophysics, 62(5), 1570-1582. [ Links ]
Thomsen, L. (1988). Reflection seismology over azimuthally anisotropic media. Geophysics, 53(3), 304-313. [ Links ]
Thomsen, L. (1986). Weak elastic anisotropy. Geophysics, 51(10), 1954-1966. [ Links ]
Toro, R. & Osorio, J. A. (2005). Determinación de los tensores de esfuerzos actuales para el segmento norte de los Andes calculados a partir de los mecanismos focales de sismos mayores. Boletín de Geología, 27(1), 13-24. [ Links ]
Tsvankin, I. (1997). Reflection moveout and parameter estimation for horizontal transverse isotropy. Geophysics, 62(2), 614-629. [ Links ]
Wang, S. & Li, X. (2003). Fracture detection using 3D seismic data: A physical modeling study. SEG Annual Meeting, Dallas, USA. [ Links ]
Zhan, Y., Chen, S., Jiang, C., Zhang, E., Ju, L. & Li, M. (2010). Application of P-wave azimuthal anisotropy for fracture detection in a volcanic reservoir. SEG Annual Meeting. Denver, USA. [ Links ]
Zheng, Y., Todorovic, D., & Larson, G. (2004). Seismic fracture detection: Ambiguity and practical solution. SEG Annual Meeting, Denver, USA. [ Links ]