


Services on Demand
Journal
Article
 English (pdf)
 Article in xml format
 Article references
 Send this article by e-mail
Indicators
-
 Cited by SciELO
 -
 Access statistics
Related links
-
 Cited by Google
 -
 Similars in
SciELO
Similars in
SciELO -
 Similars in Google
Share

 Permalink
CT&F - Ciencia, Tecnología y Futuro
Print version ISSN 0122-5383
C.T.F Cienc. Tecnol. Futuro vol.5 no.4 Bucaramanga Jan./June 2014
STUDY OF ACETONE, BUTANOL AND ETHANOL LIQUID EXTRACTION FROM PREPARED AQUEOUS SOLUTIONS USING MEMBRANE CONTACTOR TECHNIQUE
ESTUDIO DE LA EXTRACCIÓN LÍQUIDA DE ACETONA, BUTANOL Y ETANOL DE SOLUCIONES ACUOSAS PREPARADAS USANDO LA TÉCNICA DE CONTACTORES DE MEMBRANA
Karen-Stephanie Núñez-Gómez1, Liliana-Carolina López-Mendoza1, Luis-Javier López-Giraldo1 and Carlos-Jesús Muvdi-Nova1*
1Universidad Industrial de Santander, Bucaramanga, Colombia
e-mail: cjmuvdi@uis.edu.co
How to cite: Núñez-Gómez, K. S., López-Mendoza, L. C., López-Giraldo, L. J. & Muvdi-Nova, C. J. (2014). Study of acetone, butanol and ethanol liquid extraction from prepared aqueous solutions using membrane contactor technique. CT&F - Ciencia, Tecnología y Futuro, 5(4), 97-112.
(Received: Feb. 05, 2014; Accepted: Jun. 13, 2014)
*To whom correspondence should be addressed
ABSTRACT
Fermentative production of butanol using Clostridium acetobutylicum results in a mixture of acetone/ butanol/ethanol (ABE), which reaches a maximum concentration between 26 and 32.6 kg/m3, as a consequence of product inhibition. These low ABE concentrations demand an efficient separation system that allows the continuous ABE extraction. This study evaluated the extraction of ABE's prepared aqueous solutions with membrane contactors technique by using commercial extracting solvents (petroleum ether, hexane and toluene). The influence of temperature and initial concentration of butanol on the process was analyzed, in the range of 30 - 40°C and 4.8 - 20 kg/m3 respectively, using a response surface experimental design (central composite 22+star), and finding the optimal values considering batch analysis (42°C and 1.65 kg of 1-butanol/m3 as initial concentration). The experimental analysis was carried out by using Statgraphics Centurion XVI.I®. The approach of a mathematical model was performed, obtaining an error of 14.4% and 12.2% for acetone and butanol final concentrations in toluene solvent phase, respectively. It was concluded that extraction is achievable for recovery of acetone and butanol, by using toluene as solvent extractor, and obtaining partition coefficients of 0.761 for acetone and 0.998 for butanol.
Keywords: ABE, Separation, Contactors, PTFE membrane.
RESUMEN
La producción de butanol por vía fermentativa usando Clostridium acetobutylicum genera mezclas acetona/butanol/etanol (ABE), las cuales alcanzan una concentración promedio máxima entre 26 y 32.6 kg/m3, como resultado de la inhibición por producto. Estas bajas concentraciones demandan el uso de sistemas de separación eficientes que permitan la extracción de ABE de forma continua. Este estudio evaluó la extracción de ABE de soluciones acuosas preparadas con la técnica de contactores de membrana usando solventes comerciales (éter de petróleo, hexano y tolueno) como agente extractor. Se analizó la influencia de la temperatura y la concentración inicial de butanol sobre el proceso, en el rango de 30 - 40ºC y 4.8 - 20 kg/m3 respectivamente, utilizando un diseño experimental de superficie de respuesta (central compuesto 22+estrella), y encontrando valores óptimos para estas variables basados en análisis en batch (42°C y 1.65 kg de 1-butanol/m3 como concentración inicial). El análisis experimental se llevó a cabo utilizando Statgraphics Centurion XVI.I®. Se planteó un modelo matemático en estado transitorio, obteniendo % error de 14.4 y 12.2% para las concentraciones finales de acetona y butanol en el tolueno, respectivamente. Se concluye que esta técnica de extracción es posible para la recuperación de acetona y butanol usando tolueno como solvente extractor, obteniendo coeficientes de partición de 0.761 para la acetona y 0.998 para el butanol.
Palabras clave: ABE, Separación, Contactores, Membranas de PTFE.
RESUMO
A produção de butanol por via fermentativa usando Clostridium acetobutylicum gera misturas acetona/ butanol/etanol (ABE), as quais atingem uma concentração média máxima entre 26 e 32.6 kg/m3, como resultado da inibição por produto. Estas baixas concentrações demandam o uso de sistemas de separação eficientes que permitam a extração de ABE de forma contínua. Este estudo avaliou a extração de ABE de soluções aquosas preparadas com a técnica de contatores de membrana usando solventes comerciais (éter de petróleo, hexano e tolueno) como agente extrator. Foi analisada a influência da temperatura e da concentração inicial de butanol sobre o processo, na faixa de 30 - 40ºC e 4.8 - 20 kg/m3 respectivamente, utilizando um desenho experimental de superfície de resposta (central composto 22+estrela), e encontrando valores ótimos para estas variáveis baseados em análise em batch (42°C e 1.65 kg de 1-butanol/m3 como concentração inicial). A análise experimental foi realizada utilizando Statgraphics Centurion XVI.I®. Foi proposto um modelo matemático em estado transitório, obtendo porcentagem de erro de 14.4 e 12.2% para as concentrações finais de acetona e butanol no tolueno, respectivamente. A conclusão foi que esta técnica de extração é possível para a recuperação de acetona e de butanol usando tolueno como solvente extrator, obtendo coeficientes de partição de 0.761 para a acetona e de 0.998 para o butanol.
Palavras-chave: ABE, Separação, Contatores, Membranas de PTFE.
1. INTRODUCTION
Currently, butanol is of interest because of its use as fuel. Unlike ethanol, it can be used directly (without modification) in conventional engines (Ni & Sun, 2009; Demain, 2009; Liu et al., 2011). Additionally, butanol has an Energy Content (EC) of 0.036 kJ/kg close to the gasoline (EC: 0.0438 kJ/kg) and higher than the ethanol (EC: 0.027 kJ/kg) (Demain, 2009).
Butanol production may be achieved by chemical or biochemical routes. Produced by the latter route, an acetone/butanol/ethanol mixture is originated –ABE process–, which reaches an average maximum concentration from 26 to 32.6 kg/m3 in the fermentation broth, as a result of product inhibition. From this concentration, approximately 20 kg/m3 are butanol (Liu et al., 2011). Whereas the ABE mixture is toxic to the microorganism (decreasing process performance), it is required to find a method of in situ recovery.
It has been found in various studies that membrane contactors (liquid-liquid extraction trough a membrane) are applied in the recovery of butanol. The membrane acts as a passive barrier separating two immiscible fluids. One of these fluids is immobilized by the pores of the membrane. Mass transfer occurs by diffusion due to a concentration gradient. Some of the advantages of this technique include: prevention of contamination by diffusion of the solvent in the fermentation broth, prevention of formation of emulsions and accumulation of microbial cells in the solvent/broth interface (Zheng et al., 2009).
Some studies have been done on this subject, each using unconventional solvents. For example, Groot et al. (1990) studied the extraction of butanol in situ with membranes by using different solvents, especially high molecular weight esters. Furthermore, Grobben, Eggink, Cuperus and Huizing (1993) and Jeon and Lee (1987) studied the implementation of this technique using Oleyl alcohol as solvent and membranes of different materials (polypropylene and silicon, respectively). Tanaka et al. (2012) investigated butanol extraction using PTFE membranes (polytetrafluoroethylene) and 1-dodecanol as solvent extractor. Concerning membrane contactors, operating variables such as temperature and solute concentration were always considered to evaluate process parameters such as partition coefficient (P) and membrane flux (Younas, Bocquet & Sánchez, 2011; Bocquet et al., 2006; Kumar, Haddad, Alguacil & Sastre, 2005; Bothun et al., 2003).
This study evaluated the extraction process using a membrane contactor as recovery method of acetone, butanol and ethanol from prepared aqueous solutions on laboratory scale, using commercial solvents (toluene, petroleum ether and hexane) as extracting agent. These solvents were chosen from a list of commercial ones taking into consideration: cost, resilience, security conditions (risks and hazards analysis) and partition coefficient. Improved operating conditions were found from batch analysis. Based on these results, a comparison was achieved with values obtained from a validated mathematical model describing the process. To our knowledge, it is the first time modeling considers transient state to evaluate this process extraction.
2. MATERIALS AND METHODS
Materials
Whatman PTFE membranes (Ø= 47 mm, pore diameter of 0.45 and 5 µm) were used. Also Acetone (99.7%) JJ Baker, 1-butanol (Butylalcohol, 99.8%) JJ Baker, ethanol (99.9%) Merck, hexane (90.3%) Mallinckrodt, petroleum ether (petroleum benzine) Merck, and toluene (99.5%) MS Science.
Methods
Determination of Partition Coefficients
6.5x10⁻⁵ m3 of ABE mixtures were prepared and placed in flat bottom flasks with sockets, in direct contact with 6.5x10⁻⁵ m3 of organic phase (solvent), to allow the diffusion of compounds between phases. The bottom flasks were hermetically sealed, and put under agitation of 200 rpm for 3 days at 298 K. After this time, phases were separated and ABE final concentrations were determined in each phase. For ABE mixtures, the maximum concentrations were established based on butanol inhibition condition during fermentation, 5.93 kg/m3 of acetone, 2.48 kg/m3 of ethanol (Bankar, Survase, Singhal & Granström, 2012) and 20 kg/m3 of butanol (Volkov, Volkov & Khotimskii, 2009). The minimum concentrations used were ten times lower (acetone: 0.593 kg/m3, ethanol: 0.248 kg/m3 and butanol: 2 kg/m3).
The coefficient was calculated using the following expression:
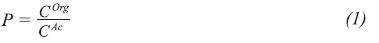
Where, COrg is the concentration of the compound in the organic phase and cAc is the concentration of the compound in the aqueous phase.
Partition coefficients were calculated for each ABE compound in each commercial solvent evaluated (petroleum ether, toluene and hexane).
High Performance Liquid Chromatography (HPLC)
Individual quantification of each compound in the aqueous phase (acetone, butanol and ethanol) was performed by HPLC (Simoni, Chapeaux, Brennecke & Stadtherr, 2010; Li, Srivastava & Parnas, 2010; Ha, Mai & Koo, 2010), using a LC-20AD (Shimadzu) liquid chromatograph equipped with a refractive index detector RID-10A. The components were separated in a COR-10H column (Transgenomic Coregel) at 80°C using 8 mol/m3 H2SO4 as the mobile phase at a flow rate of 3.6x10⁻⁵ m3/s.
Gas Chromatography (GC)
Used to quantify the concentrations of the compounds in the organic phase (Areesirisuk, Laopaiboon, Khongsay & Laopaiboon, 2010; Liu et al., 2011; Mariano, Qureshi, Filho & Ezeji, 2011). GC analysis was performed using a 7890A (Agilent Technologies) gas chromatograph in a Split mode. The separation took place in a 60 m long and 2.56x10⁻⁴ m inner diameter HP-88 capillary column. The injector and the FID were kept at 250°C. The column temperature was programmed from 50 to 96°C at a rate of 3°C/min.
Permeate Flux
Flux was calculated by dividing the mass of compound that permeates the membrane during the time passed between sampling and membrane surface, using the following equation:
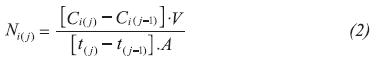
Where, C is the concentration of compound i, V is the volume of permeate compartment, t is the sampling time, j is the sampling number and A is the membrane surface.
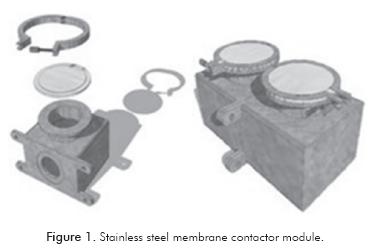
System for the Study of Membrane Contactors
The stainless steel module shown in Figure 1 was used -2x10⁻⁴ m3 of capacity and 0.06 x 0.06 x 0.06 m-. This system consisted of two chambers separated by a membrane through which ABE aqueous solutions were in contact with the organic phase during 72 h. This system was used to analyze the influence of temperature and initial butanol concentration on the extraction process. Experimental was set up using a response surface design, central composite 22+star. All experiments were carried out in batch, using prepared ABE aqueous solutions (i.e. prepared mixtures of acetone, butanol and ethanol in distilled water).
Temperature was controlled from 303 to 313 K, using a temperature bath. This is typical range of temperature found in a butanol fermentation according to scientific articles (Qureshi & Maddox, 2005; Qureshi & Maddox, 1995). No transmembrane pressure was established between feed and solvent chambers (avoiding liquid leakage). Acetone and ethanol concentrations in the feed were established from butanol concentration. Butanol concentrations used were: inhibition concentration (20 kg/m3) (Volkov et al., 2009) and a concentration that ensures a constant rate of butanol production (4.8 kg/m3) (Mariano et al, 2011). Acetone/butanol and ethanol/butanol ratios (w/w) were established from literature (acetone/butanol: 0.398 and ethanol/butanol: 0.109) (Qureshi & Maddox, 2005; Zheng et al., 2009; Liu et al., 2011). This system was also used to obtain results of the extraction at optimal conditions, adopted for modeling purposes. All experiments were twice performed.
General procedure was as follows: 1.) Assembled contactor module was placed in a temperature bath, 2.) Aqueous ABE solutions were prepared (feed), 3.) 2x10⁻⁴ m3 of feed and solvent were introduced in its respectively chamber, 4.) Finally, samples were collected depending of the analysis (at 15 and 72 h, for butanol feed concentration and temperature analysis; and each 6 up to 72 h for modeling purposes).
3. RESULTS AND DISCUSSION
Selection of Solvent Extractor
Partition coefficient (P) was experimentally determined using three commercial solvents (petroleum ether, hexane and toluene) at room temperature and two concentration levels. Table 1 shows the partition coefficients obtained and equilibrium concentrations in solvent phase. From this table, it can be seen that using toluene as extracting solvent results in higher partition coefficients for each compound. In the case of hexane and toluene values, they correspond to those reported by Kim, Iannotti and Bajpai (1999). Concerning petroleum ether, it is the first time partition coefficients are reported. Some deviation in values was found due to solvents and ethanol and acetone volatilities, causing some variations during sampling.
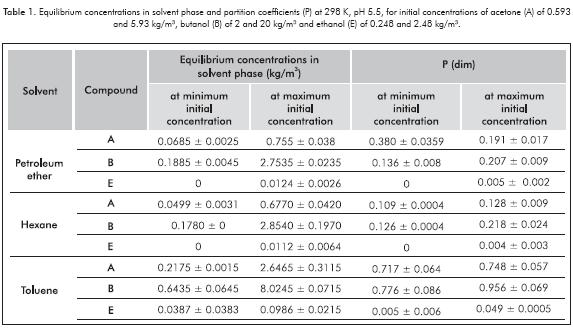
Partition coefficient depends on molecule to extract, its concentration and temperature of the system (Younas et al., 2011). For example, using toluene as extracting solvent, it can be seen that low ABE concentrations made the partition coefficient decrease by 4.14, 18.82 and 89.80% for acetone, butanol and ethanol, respectively.
Table 2 resumes some P values reported by other authors. Only Kim et al. (1999) reported results using toluene as extracting solvent for liq-liq extraction. The results obtained in this work (at maximum ABE concentration) are similar of those obtained by Kim et al. (1999). Moreover, it can be seen in all cases that ethanol P values are in one order lower than those of butanol and acetone. Additionally, for butanol, there are other solvents with major P values, up to 2.9 (e.g. ionic liquids, oleic alcohol and 1-dodecanol), but it is also important to point out that all this solvents are less available, and thus expensive, when considering a a larger scale (in comparison with toluene).
Influence of Initial Concentration of Butanol on the Process
Experimental tests at various temperatures and initial concentrations of butanol were performed, using toluene as extracting solvent. Partition coefficients, final concentrations in the aqueous phase and permeate flux for each compound were measured. Permeate flux was calculated from concentration in the organic phase at 15 h -time assuring constant extraction speed (experimentally determined)-. The data obtained are resumed in Table 3.
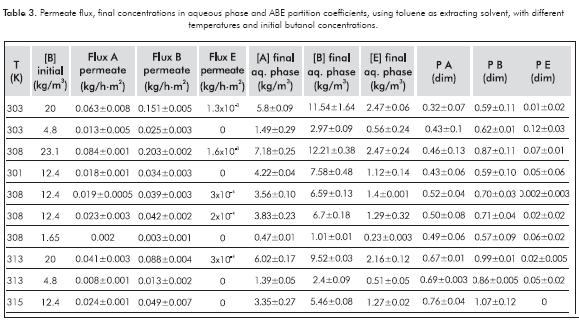
With the aid of Statgraphics Centurion XVI.I®, it was obtained the individual contribution for each variable studied.
Figure 2 resumes individual contribution for each output variable as regard to the initial concentration of butanol. This figure shows for the case of permeate flux of each compound (Figures 2a, 2b, 2c) that a 10% increase in the initial butanol concentration induces an increase of permeate flux of 22.6, 36.4 and 176.8% for acetone, butanol and ethanol, respectively. The differences between these percentages can be explained by differences in the concentration levels used (butanol concentrations are higher than acetone’s and ethanol’s), increasing the concentration gradient and thus the permeate flux.
In addition, it should be noted that, as obtained in the previous section (Table 1), partition coefficient for butanol increases with concentration; thus the butanol permeate flux. Furthermore, the high variation of values found for the ethanol could be explained because of the low flux obtained for this compound, making any increase more noticeable.
On the other hand, after analyzing the graphics of partition coefficients of each compound (Figures 2d, 2e, 2f), it can be concluded that for acetone and ethanol, the influence of the initial butanol concentration has no statistical significance. For these two compounds, p-values of 0.191 and 0.136 were obtained respectively (if p-values > 0.05 the influence is not statistically significant). However, in the case of butanol, it shows that increasing the initial concentration in 10%, the partition coefficient increments its value a 0.65% (p-value = 0.0046).
Final concentrations of ABE compounds (at equilibrium) in the aqueous phase (Figures 2g, 2h, 2i) increase with butanol concentration in the feed. Therefore, when increasing the initial butanol concentration a 10%, the final concentrations of acetone, butanol and ethanol in the aqueous phase will increase 10.2, 9.6 and 8.7% respectively. This can be explained because increasing the initial concentration of butanol, forces the stabilization at higher concentration levels.
Influence of Temperature in the Process
To analyze the influence of temperature on the extraction process, the data summarized in Table 2 were used. As in the previous case, graphics that show the dependency of the output variables with respect to system temperature were obtained (Figure 3). From analyzing the flux of each compound (Figures 3a, 3b, 3c), it can be seen that temperature has no significant effect on the flux of acetone, ethanol and butanol, displaying p-values > 0.05. In the case of acetone and butanol partition coefficients (Figures 3d and 3e), an increase of 3.3% in temperature increments partition coefficients: 64.7% for acetone and 54.4% for butanol. This effect can be explained by changes in molecule solubility in each phase, due to changes of thermodynamics in each solution. A major increase of molecules solubility in the solvent can be inferred, with respect to the aqueous phase. Additionally, partition coefficient of ethanol is not significantly affected by temperature, obtaining a p-value equal to 0.0871.
In addition, temperature has a contrary effect on the final butanol concentration in the aqueous phase (Figures 3g, 3h, 3i). By increasing system temperature in 3.3%, the diffusion of this compound into the organic phase increments, thus decreasing the concentration remaining in the aqueous phase by 19.2%. Final concentrations in the aqueous phase of acetone and ethanol have not been significantly affected by temperature, showing p-values of 0.0664 to 0.7162 for acetone and ethanol, respectively.
As a result, an increase in separation efficiency by increasing the system temperature is evident. The differences in behavior found for acetone and ethanol can be explained due to the low concentration values used for these compounds (compared to butanol).
In summary, membrane contactors technique showed favorable results under the evaluated conditions for the extraction of acetone and butanol using toluene as solvent, with partition coefficients of 0.761 and 0.998, respectively. In the case of ethanol, partition coefficients were very low (< 0.1); suggesting the need to find another extraction technique for this compound.
Determination of Optimal Values
With the Statgraphics Centurion XVI.I® software and the experimental results presented in Table 3, it was possible to find the optimal operating conditions. Table 4 summarizes them with the predicted output variables. These optimal points correspond to the values of temperature and initial butanol concentration to which extraction rates and partition coefficients were maximized, and final ABE concentrations in the aqueous phase were minimized.
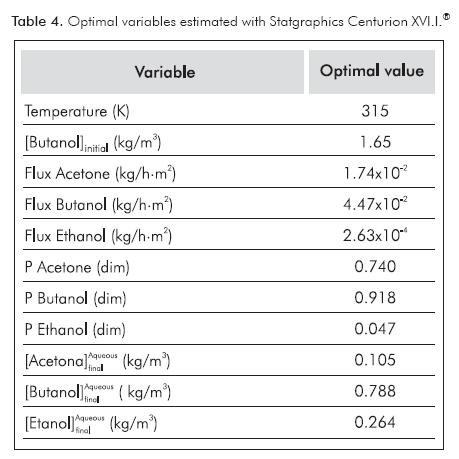
An experiment with the optimal values was performed and results were compared to the predicted values by Statgraphics Centurion XVI.I®. Figure 4 presents the comparison of these results for ABE compounds. Figures 4a, 4b and 4c show that the software provided a convenient prediction of optimal extraction conditions; mainly for partition coefficient and final butanol concentration in the aqueous phase (Figures 4a and 4b). In the case of butanol, results presented relative standard deviation of 5.9% for butanol partition coefficient (Figure 4a), 1.5% for final butanol concentration in the aqueous phase (Figure 4b) and 70.5% for extraction rate of this compound (Figure 4c). It is important to take into account that extraction rate is a parameter determined when considering extraction at constant rate (at 15 h). However, this period could change between experiments. This fact could explain the high deviation found for extraction rate between predicted and experimental values.
Modeling of the Extraction Process
A semiempirical model in transient state that would describe the mass transfer phenomena during the extraction of the ABE compounds was developed. This model considered:
- Completely stirred system (no concentration profiles on both sides of the membrane).
- Membrane is symmetric and its pores are filled with solvent.
- Equilibrium is reached in the liquid-liquid interface and is located on the side of the aqueous phase.
- None mass transport occurs in nonporous parts of the membrane.
- Aqueous phase and solvent are completely immiscible.
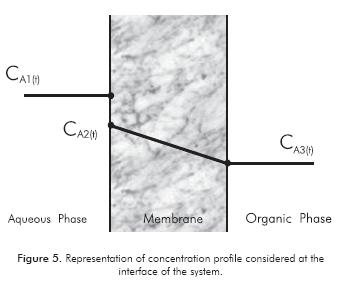
A mass balance in transient state was performed for the system, with necessary equations being proposed. Concentration profiles in the system were considered as represented in Figure 5. This way, it was possible to obtain the variation of concentration in the two phases as a function of time. Expressions for viscosity, diffusivity and mass transfer rate through the membrane were included.
Equations:
• Mass balance in the organic phase
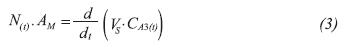
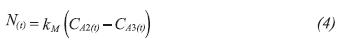
Where, AM is the membrane area, Vs is the solvent volume in the system and CA3(t) is the concentration of the compound in the organic phase in time.
• Mass transfer through the membrane (Younas et al., 2011; Bocquet et al., 2005; Pierre, Souchon & Marín, 2001)
Where, kM is the mass transfer coefficient through the membrane and CA2(t) is the concentration of the compound in the membrane pore in time.
• Partition coefficient (Younas et al., 2011; Pierre et al., 2001)
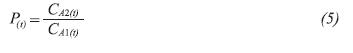
Where, CA1(t) is the concentration of the compound in the aqueous phase in time.
• Mass transfer coefficient in the membrane (Bocquet et al., 2006; Kumar et al., 2005)
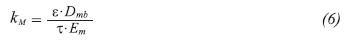
Where, ε is the porosity,  is the tortuosity, Em is the thickness of the membrane and Dmb is the solvent diffusivity coefficient in the membrane.
• Solvent diffusivity coefficient in the membrane (Treybal, 1994)
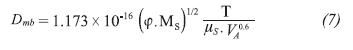
Where, φ is the solvent association factor, MS is the solvent molecular weight, VA is the molal volume of compound and μS is the solvent viscosity.
• Solvent Viscosity (Ec. de Eyring)
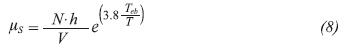
Where, N is the Avogadro number, h is the Planck constant, V is the molar volume, and Teb is the normal boiling temperature of the solvent and T is the temperature of the system.
To complete the equations set, and taking into account the variation of partition coefficient in the system with concentration (Table 2), it was determined an expression that related the partition coefficient of each compound with the final concentration in the aqueous phase and temperature of the system (Equations 9, 10, and 11). Statgraphics Centurion XVI.I® was used to calculate these expressions.
• Empirical expression for the partition coefficient of acetone, butanol and ethanol, respectively:
Where, CA1(t), CB1(t) and CE1(t) are the concentrations of acetone, butanol and ethanol in the solvent in time, respectively and T is the temperature of the system.
Equations 9, 10 and 11 where obtained from experimental data working with temperatures between 28 – 42°C, and butanol concentrations between 1.65-23.1 kg/m3 (acetone/butanol: 0.398 w/w and ethanol/ butanol: 0.109 w/w).
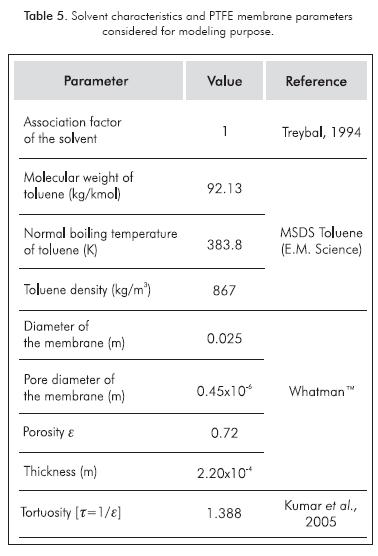
To solve the set of equations proposed, it was necessary to have information about the characteristics of the membrane and some parameters of the solvent used. These are summarized in Table 5.
Finally, the model was used to simulate ABE extraction kinetics at optimal operating conditions (Table 4). The results were compared with those obtained experimentally (Figure 6a and 6b).
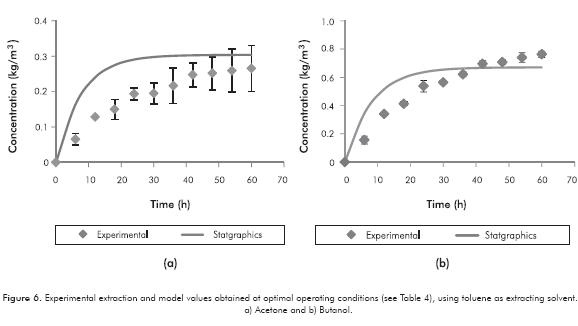
Figures 6a and 6b depict the model that describes the behavior shown by experimental data. Concentration values for acetone and butanol in time supplied by the model have a Mean Absolute Deviation (MAD) of 0.037 and 0.046 for acetone and butanol, respectively. An average error percentage of 53.7% for acetone and 29.1% for butanol concentrations in time were found. Related with final concentration at equilibrium in solvent phase, concentrations were predicted by the model: 0.30 kg/m3 for acetone and 0.67 kg/m3 for butanol with an error of 14.4% and 12.2% for acetone and butanol, respectively -experimental 0.266 kg/m3 ± 0.065 for acetone and 0.764 kg/m3 ± 0.022 for butanol-.
If stabilization time of the system is compared, it is observed that for acetone, experimental time is around 50 h, while model predicted 38 h (24% lower). For butanol, stabilization occurs at 45 h, and prediction results in 35 h (22% lower). These differences could be explained because an absence of concentration profiles in the phases was considered. This consideration was made in order to simplify the model, but results suggest there must be a concentration profile due to absence of agitation. Taking into consideration these profiles, the flux decreases across the membrane; thereby increasing stabilization times. Further studies should consider this to improve the mathematical model.
4. CONCLUSIONS
- Membrane contactors technique for the ABE extraction was studied using commercially available solvents. In this work, favorable results were found using toluene as solvent extractor in the recovery of acetone and butanol, with partition coefficients of 0.761 and 0.998, respectively. Although P coefficient values for toluene are inferior in some cases (2.9 times), this solvent has the advantage to be more commercially available in comparison with others already reported. The influence of operating variables (temperature and initial butanol concentration) during the extraction process was studied, and the optimal temperature (42°C) and initial butanol concentration (1.65 kg/m3) were determined. The permeate flux obtained were 0.044 kg·m-2·h-1 for butanol, 0.017 kg·m-2·h-1 for acetone and negligible for ethanol. Furthermore, a mathematical model for the study of ABE compounds extraction in transient state is proposed for the first time. In the construction of this model, variation of P coefficient with ABE concentration and system temperature were taken into account, predicting the behavior of the extraction kinetics for acetone and butanol. Moreover, the model was compared with experimental data obtaining MAD of 0.037 for acetone and 0.046 for butanol. An average error percentage of 53.7% for acetone and 29.1% for butanol concentrations in time were found. However, in both cases, final concentrations in aqueous phase were predicted by the model. It is important to continue working on improving the mathematical model, specifically in the prediction of the stabilization time and considering fouling phenomena when using real ABE solutions (from fermentation broth).
ACKNOWLEDGEMENTS
The authors would like to thank the Vicerrectoria de Investigación y Extensión at Universidad Industrial de Santander, for supporting this study, which is included in the research project titled: “Escalamiento de los procesos de producción de bioalcoholes y procesamiento de subproductos provenientes de la producción de biocombustibles por vía fermentativa” (VIE5452 code).
REFERENCES
Adhami, L., Griggs, B., Himebrook, P. & Taconi, K. (2009). Liquid-liquid extraction of butanol from dilute aqueous solutions using soybean-derived biodiesel. J. Am. Oil Chem. Soc., 86(11), 1123-1128. [ Links ]
Areesirisuk, A., Laopaiboon, L., Khongsay, N. & Laopaiboon, P. (2010). Improvement of gas chromatographic analysis for organic acids and solvents in acetone-butanol-ethanol fermentation from sweet sorghum juice. Afr. J. Biotechnol., 9(38), 6422-6429. [ Links ]
Bankar, S., Survase, S., Singhal, R. & Granström, T. (2012). Continuous two stage acetone-butanol-ethanol fermentation with integrated solvent removal using Clostridium acetobutylicum B 5313. Bioresour. Technol., 106: 110-116. [ Links ]
Bocquet, S., Torres, A., Sánchez, J., Ríos, G. & Romero, J. (2005). Modeling the mass transfer in solvent-extraction processes with hollow-fiber membranes. AIChE J., 51(4), 1067-1079. [ Links ]
Bocquet, S., Viladomat, F., Muvdi, C., Sanchez, J., Athes, V. & Souchon, I. (2006). Membrane-based solvent extraction of aroma compounds: Choice of configurations of hollow fiber modules based on experiments and simulation. J. Membr. Sci., 281(1-2), 358-368. [ Links ]
Bothun, G. D., Knutson, B. L., Strobel, H. J., Nokes, S. E., Brignole, E. A. & Díaz, S. (2003). Compressed solvents for the extraction of fermentation products within a hollow fiber membrane contactor. J. Supercrit. Fluid., 25(2), 119-13. [ Links ]
Demain, A. L. (2009). Biosolutions to the energy problem. J. Ind. Microbiol. Biotechnol., 36(3), 319-332. [ Links ]
Grobben, N. G., Eggink, G., Cuperus, F. P. & Huizing, H.J. (1993). Production of acetone, butanol and ethanol (ABE) from potato wastes: fermentation with integrated membrane extraction. Appl. Microbiol. Biotechnol., 39(4-5), 494-498. [ Links ]
Groot, W., Soedjak, H., Donck, P., Van der Lans, R., Luyben, K. & Timmer, J. (1990). Butanol recovery from fermentations by liquid-liquid extraction and membrane solvent extraction. Bioprocess Eng., 5(5), 203-216. [ Links ]
Ha, S., Mai, N. & Koo, Y. (2010). Butanol recovery from aqueous solution into ionic liquids by liquid-liquid extraction. Process Biochem., 45(12), 1899-1903. [ Links ]
Ishizaki, A., Michiwaki, S., Crabbe, E., Kobayashi, G., Sonomoto, K. & Yoshino, S. (1999). Extractive aceton-ebutanol-ethanol fermentation using methylated crude palm oil as extractant in batch culture of clostridium saccharoperbutylacetonicum Nl-4 (ATCC 13564). J. Biosci. Bioeng., 87(3), 352-356. [ Links ]
Jeon, Y. J. & Lee, Y. Y. (1987). Membrane-assisted extractive butanol fermentation. Ann. N. Y. Acad. Sci., 506: 536-542. [ Links ]
Kim, J. K., Iannotti, E. L. & Bajpai, R. (1999). Extractive recovery of products from fermentation broths. Biotechnol. Bioprocess Eng., 4(1), 1-11. [ Links ]
Kumar, A., Haddad, R., Alguacil, F. & Sastre, A. (2005). Comparative performance of non-dispersive solvent extraction using a single module and the integrated membrane process with two hollow fiber contactors. J. Membr. Sci., 248(1-2), 1-14. [ Links ]
Li, S., Srivastava, R. & Parnas, R. (2010). Separation of 1-butanol by pervaporation using a novel tri-layer PDMS composite membrane. J. Membr. Sci., 363(1-2), 287-294. [ Links ]
Liu, G., Hou, D., Wei, W., Xiangli, F. & Jin, W. (2011). Pervaporation separation of butanol-water mixtures using polydimethylsiloxane/ceramic composite membrane. Chin. J. Chem. Eng., 19(1), 40-44. [ Links ]
Mariano, A., Qureshi, N., Filho, R. & Ezeji, T. (2011). Bioproduction of butanol in bioreactors: new insights from simultaneous in situ butanol recovery to eliminate product toxicity. Biotechnol. Bioeng., 108(8), 1757-1765. [ Links ]
Ni, Y. & Sun, Z. (2009). Recent progress on industrial fermentative production of acetone-butanol-ethanol by Clostridium acetobutylicum in China. Appl. Microbiol. Biotechnol., 83(3), 415-423. [ Links ]
Pierre, F., Souchon, I. & Marin, M. (2001). Recovery of sulfur aroma compounds using membrane-based solvent extraction. J. Membr. Sci., 187(1-2), 239-253. [ Links ]
Qureshi, N. & Maddox, I. (1995). Continuous production of acetone-butanol-ethanol using immobilized cells of Clostridium acetobutylicum and integration with product removal by liquid-liquid extraction. J. Ferment. Bioeng., 80(2), 185-189. [ Links ]
Qureshi, N. & Maddox, I. (2005). Reduction in butanol inhibition by perstraction: Utilization of concentrated lactose/whey permeate by Clostridium acetobutylicum to enhance butanol fermentation economics. Food Bioprod. Process., 83(1), 43-52. [ Links ]
Simoni, L., Chapeaux A, J., Brennec. & Stadtherr, M. (2010). Extraction of biofuels and biofeedstocks from aqueous solutions using ionic liquids. Comput. Chem. Eng., 34(9), 1406-1412. [ Links ]
Tanaka, S., Tashiro, Y., Kobayashi, G., Ikegami, T., Negishi, H. & Sakaki, K. (2012). Membrane-assisted extractive butanol fermentation by Clostridium saccharoperbutylacetonicum N 1-4 with 1-dodecanol as the extractant. Bioresour. Technol., 116: 448-452. [ Links ]
Treybal, R. (1994). Operaciones de transferencia de masa. 2 ed. México: McGraw-Hill. [ Links ]
Volkov, A., Volkov, V. & Khotimskii, V. (2009). Membranes based on poly[(1_trimethylsilyl)_1_propyne] for liquid- liquid separation. Polym. Sci. Series A, 51(11-12), 1367-1382. [ Links ]
Younas, M., Bocquet, S. & Sánchez, J. (2011). Experimental and theoretical mass transfer transient analysis of copper extraction using hollow fiber membrane contactors. J. Membr. Sci., 382(1-2), 70-81. [ Links ]
Zheng, Y., Li, L., Xian, M., Ma, Y., Yang, J., Xu, X. & He, D. (2009). Problems with the microbial production of butanol. J. Ind. Microbiol. Biotechnol., 36, 1127-1138. [ Links ]
AUTHORS
Karen Stephanie Núñez Gómez
Affiliation: Universidad Industrial de Santander
Chemical Engineer, Universidad Industrial de Santander
e-mail: karita_ng@hotmail.com
Liliana Carolina López Mendoza
Affiliation: Universidad Industrial de Santander
Chemical Engineer, Universidad Industrial de Santander
e-mail: lilo680@hotmail.com
Luis Javier López Giraldo
Affiliation: Universidad Industrial de Santander
Chemical Engineer, Universidad Nacional de Colombia
Ph. D. in Chemistry, Biochemistry and Food Science, École Superieur Agronomique Montpellier- SupAgro
e-mail: ljlopez@uis.edu.co
Carlos Jesús Muvdi Nova
Affiliation: Universidad Industrial de Santander
Chemical Engineer, Universidad Industrial de Santander
M. Sc. in Process Engineering, Université de Montpellier II
Ph. D. in Process Engineering, Université de Montpellier II
e-mail: cjmuvdi@uis.edu.co
