Serviços Personalizados
Journal
Artigo
 Inglês (pdf)
 Artigo em XML
 Referências do artigo
 Enviar este artigo por email
Indicadores
-
 Citado por SciELO
 -
 Acessos
Links relacionados
-
 Citado por Google
 -
 Similares em
SciELO
Similares em
SciELO -
 Similares em Google
Compartilhar

 Permalink
CT&F - Ciencia, Tecnología y Futuro
versão impressa ISSN 0122-5383
C.T.F Cienc. Tecnol. Futuro vol.6 no.1 Bucaramanga jan./jun. 2015
NEW APPROACH FOR COMPACTION PREDICTION IN OIL RESERVOIRS
NUEVO ENFOQUE PARA PREDECIR LA COMPACTACIÓN EN YACIMIENTOS DE ACEITE
NOVA ABORDAGEM PARA A PREVISÃO DE COMPACTAÇÁO EM RESERVATÓRIOS DE PETRÓLEO
Javier-Fernando Mendoza-Molina1*, Carlos-Andrés Mercado-Montes1 and Zuly-Himelda Calderón-Carrillo1
1Escuela de Ingeniería de Petróleos, Universidad Industrial de Santander (UIS), Bucaramanga, Santander, Colombia. e-mail: ing.mendoza890@gmail.com
How to cite: Mendoza-Molina, J. F., Mercado-Montes, C. A. & Calderón-Carrillo, Z. H. (2015). New approach for compaction prediction in oil reservoirs. CT&F - Ciencia, Tecnología y Futuro, 6(1), 5-16.
*To whom correspondence should be addressed
(Received: Oct. 17, 2014; Accepted: Jun. 02, 2015)
ABSTRACT
As reservoir fluids are produced, pore pressure decreases and compacting rock loses capacity to support the overburden pressure, while the effective stress increases rapidly leading to pore collapse. Reservoir can elastically compact itself until pore pressure drops to the elastic limit, then initiates a plastic deformation known as mechanical compaction. Using numerical models is a good tool for compaction prediction; as they can predict reservoir behavior. This paper is purported by some models that allow providing for an approximate representation and prediction of the compaction magnitude at the wellbore developed in oil reservoirs during production (another model could be used to amplify the range until reservoir limits), integrating a uniaxial compaction mathematical model with pressure drawdown equation in formation face, and then a numerical model is built aimed reproducing the phenomenon and its changes over time. The mathematical model is built with the uniaxial compaction model and the drawdown pressure equation. The model is not complex but integrates the mean variables and rock properties involved in compaction phenomenon, like rock compressibility, elastic modulus, porosity, permeability and fluid pressure. This paper develops new numerical model based on the foundations of the Geertsma (1973) model, adding a step-by-step procedure to calculate the new rock properties over time, in order to have a more realistic compaction magnitude result.
Keywords: Pore pressure, Production, Mathematical model, Numerical simulation, Flow equations.
RESUMEN
A medida que los fluidos son producidos del yacimiento, se reduce la presión de poro, disminuyéndose la capacidad de la roca que se compacta para soportar la presión de sobrecarga, incrementándose de esta forma el esfuerzo efectivo que podría alcanzar el colapso de los poros. El yacimiento puede compactarse bajo una deformación elástica hasta que la presión de poros caiga alcanzando el límite elástico, a partir del cual se inicia la deformación plástica que es conocida como la compactación mecánica. El objetivo de este trabajo es proponer modelos que permitan representar y predecir con aproximación la magnitud de la compactación en el pozo que puede desarrollarse en un yacimiento durante la producción de aceite (se podría usar otro modelo que amplíe el rango de alcance hasta los límites del yacimiento), integrando un modelo matemático de compactación uniaxial con la ecuación de caída de presión en la cara de la formación, luego la construcción de un modelo numérico que reproduce el fenómeno de compactación y sus cambios en el tiempo. El modelo matemático se construye a partir del modelo de compactación uniaxial y la ecuación de la caída de presión, no es un modelo complejo pero integra las variables principales involucradas en el fenómeno de compactación, como la compresibilidad de la roca, el módulo elástico, la porosidad, permeabilidad y presión del fluido. En este artículo se presenta un nuevo modelo numérico a partir del fundamento del modelo de Geertsma (1973), incluyendo un procedimiento paso a paso para calcular las nuevas propiedades de la roca con el tiempo, con el fin de obtener la magnitud de la compactación más real.
Palabras clave: Presión de poro, Producción, Modelo matemático, Simulación numérica, Ecuaciones de flujo.
RESUMO
Na medida em que os fluidos são produzidos pela jazida, a pressão de poro diminui, reduzindo assim a capacidade da roca que se compacta para suportar a pressão de sobrecarga, aumentando desse modo o esforço efetivo que poderia atingir o colapso dos poros. A jazida pode compactar-se sob uma deformação elástica até a pressão de poros cair até atingir o nível elástico, iniciando a partir desse momento a deformação plástica também conhecida como compactação mecânica. Este trabalho objetiva propor modelos que possibilitem uma representação e predição aproximada da compactação no poço que pode desenvolver-se em uma jazida durante a produção de óleo (pode ser usado outro modelo que amplie o rango de alcance até os limites da jazida), integrando um modelo matemático de compactação uniaxial com a equação de queda de pressão na face da formação, precedida da construção de um modelo numérico que reproduz o fenómeno de compactação e suas alterações no tempo. O modelo matemático é construído com base no modelo de compactação uniaxial e a equação de queda de pressão, não sendo um modelo complexo mais que integra as principais variáveis envolvidas no fenômeno de compactação, como a compressibilidade da rocha, o módulo elástico, porosidade, permeabilidade e pressão do fluído. Este artigo apresenta um novo modelo numérico baseado nos fundamentos do modelo de Geertsma (1973), incluindo um procedimento passo a passo para calcular as novas propriedades da rocha no tempo, no intuito de obter a magnitude da compactação mais real.
Palavras-chave: Pressão de poros, Produção, Modelo matemático, Simulação numérica, Equações de fluxo.
1. INTRODUCTION
Compaction is a natural phenomenon that takes place in sedimentary rocks whereby the volume of the rock is reduced when subject to stresses. This phenomenon often involves land subsidence. Both phenomena are essential in the formation of sedimentary rocks, and are the origin of hydrocarbon formations. Compaction during oil production is a volume reduction of a reservoir resulting from the reduction of pressure and fluid production (Fjaer et al., 2008). When fluids are produced, the weight of the overburden is not reduced but pore pressure does, which increases the effective stress acting on the solid matrix. The result of having a pressurized fluid within a solid environment is that both the fluid and the solid support the stresses on the material. The pore or fluid pressure is the part of the lithostatic pressure that the reservoir fluids may support. As a result, the rock will hold more stress, which will lead to a rearrangement of rock grains causing the expulsion of the fluid, changes in the grains leading to compaction and the consequent surface subsidence. The phenomenon of compaction can increase the oil recovery factor as oil production increases its value as well. However, it can also cause negative impacts such as operational problems and subsidence.
Most oil and gas reservoirs will undergo only a small degree of compaction, and the corresponding subsidence at the surface will be negligible. In order to see a considerable degree of subsidence, one or several of the following conditions must be present:
- The reservoir pressure drop must be significant.
- The reservoir rock must be highly compressible.
- The reservoir must have a considerable thickness.
- In order for subsidence to occur, the reservoir compaction must be significant, and in addition, not shielded by the overburden rock.
Fluid production has the main impact on rock volume reduction as compaction basis because the forces on the rock are initially in equilibrium. As soon as the producing fluid comes out of the rock the overburden pressure compacts its porous volume depending on its compressibility. The foregoing is represented as the Physical model where more volume reduction observed on the formation phase. A Mathematical model features the main variables of the compaction phenomenon such as fluid pressure drop, rock compressibility and thickness. Fluid pressure drop (ΔP) equation is the solution of the diffusivity equation when the radius is the well radius. Elastic properties are integrated with rock compressibility through a parameter known as uniaxial compaction modulus Cm. Since one of the pressure drop equation constraints is that rock properties are constants (Φ and k), which is not true during compaction, it is necessary to solve it through a Numerical model that enables using constant rock properties only for short periods of time (Δt).
2. NEW APPROACH
In order to determine reservoir compaction magnitude it is very useful to apply a model that allows predicting future reservoir behavior, with the purpose of implementing solutions for damage mitigation. The model proposed in this paper comprises a physical basis represented in mathematical expressions, later on; the Numerical model is described as an approximation to obtain the solution to the mathematical expressions.
Physical Basis
As effective stress increases when pore space decreases, the space initially occupied by the produced fluids, provided that overburden is kept constant, causes the effective stress to increase until different phenomena occur in the rock.
Physical Model
A basic model to study what happens in the reservoir assumes strain by uniaxial compaction. In the lab this could be represented by a cylindrical porous rock sample in a confined cell under vertical stress to simulate overburden, if the containing fluid leaves the sample, pore pressure decreases and it starts to compact.
Model Geometry
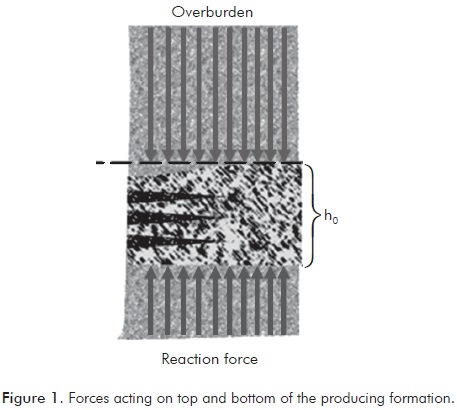
Before drilling, the rock - and fluids systems are in equilibrium, as the well starts flowing due to a pressure drop, the producing formation loses strength to resist overburden leading to a volume reduction and thereby to a thickness reduction. In addition, given that the producing formation is located between impermeable layers, fluids only go by the completion and rock over layers and sub layers put stress on the formation, being critical in rocks with high porosities and compressibilities. Therefore, the effect of thickness reduction is more visible on the producing formation phase (Figure 1).
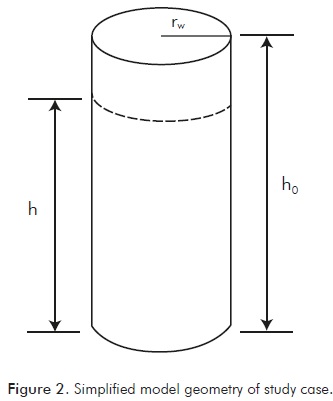
The geometric study model is a cylinder of well radius rw as shown in Figure 2 and initial thickness ho as height, so the studied changes will be thickness reduction or compaction.
The model comprises a dependent variable, constants and independent variables. The dependent variable is compaction and fluid production (oil single phase) while the rock elastic modulus remains constant. The main independent variable is time, implicit in any process. As compaction depends on pore pressure drop, it should be considered as being the independent variable.

Mathematical Basis
Geertsma (1973) developed an equation whereby compaction is determined with fluid pressure drop (ΔP), Poisson ratio (v) and Young modulus (E).
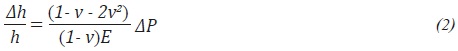
Equation 1 can be expressed as follows:
Where Cm is the uniaxial compaction modulus, and determines how much rock can be compacted, therefore it is related to rock bulk compressibility Cb.
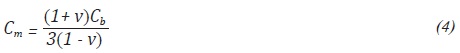
It is worth noting that if the material has fluid saturation, the Poisson ratio approaches 0.5, thus uniaxial compaction modulus becomes a bulk compressibility value (Jaeger & Cook, 1979). These authors presented theoretical arguments showing that the volumetric response of an elastic material for the application of three different stresses is similar to that produced by an isotropic stress which is nominally identical to the three stresses. Thereby it should be used as long as the rock strain is elastic; otherwise Equation 2 should be applied.
Mathematical Model
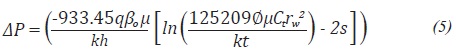
At this point all the variables have been mentioned except for drop pressure. Since the effect of compaction is greater on formation phase, solving the diffusivity equation for pressure drawdown at the wellbore could be useful.
The calculation and execution of the equation to solve the diffusivity equation will be assumed to have the following conditions:
- Radial flow into the well.
- Homogeneous and isotropic porous media.
- Uniform thickness, but not constant.
- Constant porosity and permeability.
- Fluid with small and constant compressibility.
- Negligible gravitational and thermal effects.
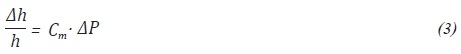
Replacing in Equation 3:
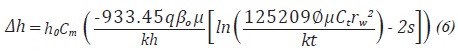
If compaction is a thickness change then:

Rearranging terms a quadratic equation is obtained by grouping terms for better handling.

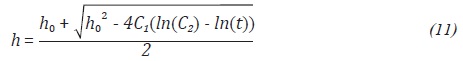
After solving the quadratic Equation 8, two responses are obtained, the new thickness and the current value of compaction.
The obtained solutions are complementary and the sum of both must always correspond to the value of initial thickness. For a more realistic simulation the change in porosity and permeability over time should be taken into account, thus, contradicting one of the assumptions of the diffusivity equation solution. To turn this approximation into a good tool one needs to apply a numerical method where the amount of compaction is calculated with rock properties changing over time.
Numerical Model
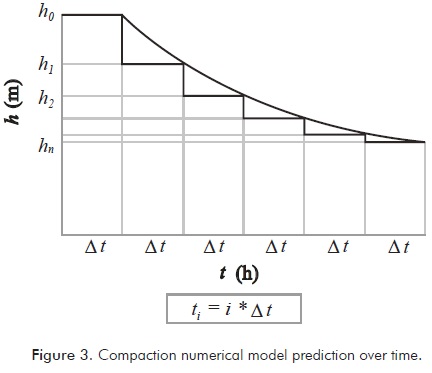
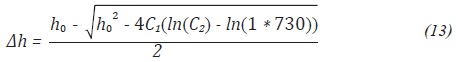
As mentioned above, the main purpose of this paper is to determine the magnitude of reservoir compaction, therefore, it is necessary to express compaction as a function of time. To make use of the solution of the diffusivity equation, porosity and permeability are assumed to be constants, which does not reproduce the actual behavior of the reservoir, therefore, a valid approximation could be assuming rock properties as constant for short time intervals, and recalculate the new values for these properties in the next interval, while pressure drops. As the compaction in the reservoir is analyzed for years, it is desirable to choose a step size of 1 month (730 hours approx.), because taking a step size within the hour range is not sufficient to obtain a value of compaction occurred in short times, since compaction is insignificant. The result is a stepped graph where the method joins the end points and forms a curve from them as shown in Figure 3. This is mathematically obtained by iterations in which data of the previous interval is used to obtain data of the next interval. It is also important to clarify that the intervals are of equal magnitude, ie the simulation time is divided into equal intervals (1 month). For the first interval, i = 0, and the next i = 1, and so on.
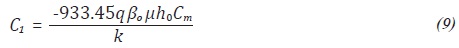
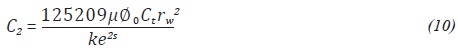
- For the first interval (i = 0) with initial reservoir data calculate C1 and C2 from Equation 9 and 10.
- Obtain the initial value of compaction.
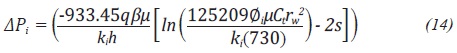
- The initial pressure drop with the initial values of rock properties and fluid is calculated to, know the new values of porosity and permeability of the next interval.
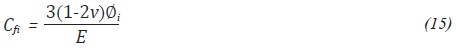
- The new formation compressibility is calculated using a modified correlation obtained from Li, Chen and Du (2004). If E and v are unknown, then use (Hall, 1953):
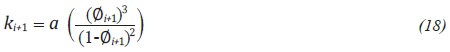
- The porosity in the next iteration (i + 1 = 2) can be obtained from Smith (1971):
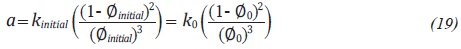
- Permeability is then calculated from the Kozeny-Carman correlations (Carman, 1956): Where a is a constant and is obtained from the first iteration as follows: i=0
- After calculating the new values of porosity and permeability, they will be replaced in step 1.
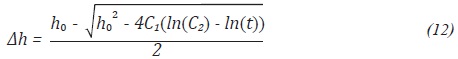
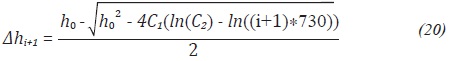
- After replacing all variables in the Equation 12, then:

3. NUMERICAL MODEL VALIDATION
Eclipse® Numerical Simulation
It is important to know the degree of approximation in which the proposed model predicts the amount of compaction, so it is useful in a real case. Hence, the results will be compared with a simulation run in Eclipse® software made by Quoc (2007) and also with a stochastic simulation model, applied to two deepwater wells from Gulf of Mexico Basin. The following Table 1 contains all the data used.
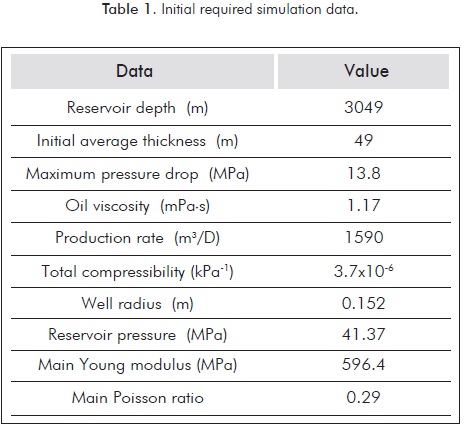
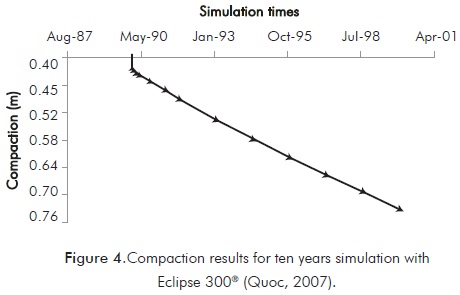
With the data above (Table 1) Quoc (2007) ran the simulation in Eclipse 300® for a step size of 500 days to simulate time up to 10 years, obtained the initial compaction in May 1990 was 0.4 m, after 10 years the compaction calculated by the model was 0.73 m in the well. Then the result of the numerical simulation is presented for the compaction during 10 years of production, in Figure 4.
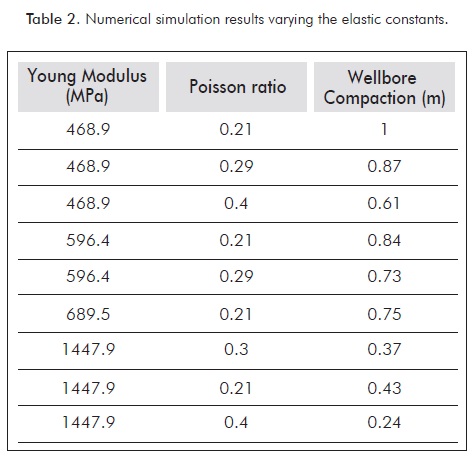
Quoc also ran other simulations varying the elastic constants, with the following results (Table 2):
Stochastic Simulation
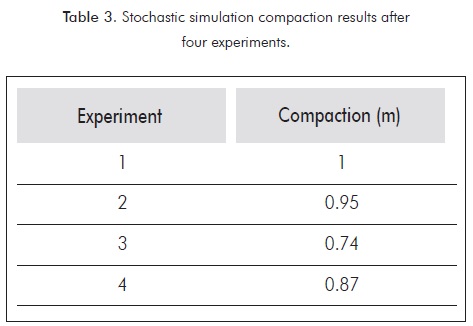
Using the Monte Carlo simulation, Quoc (2007) performed 4 experiments. In the first one, no distribution of input data was made, while in the second experiment a distribution of input data was only applied for, the Young's modulus. In the third experiment Quoc applied a distribution for both Young's modulus and Poisson's ratio. Finally, in the fourth experiment the distribution was performed for the aforesaid elastic constants and pressure drop. For Experiment 1, which did not contain the uncertainty of E or ΔP, gives a compaction of 1m. This experiment was simulated with the data E = 468.9 MPa and v = 0.21, which shows that this exactly matches the results of simulation made in Eclipse 300® (Table 2). In the following experiment the exponential distribution of Young's modulus was calculated truncated from 275.8 to 1585.8 MPa. Once the data was entered and 10000 iterations of 0.95 m compaction were obtained, with a standard deviation of 0.38 m, the main Young modulus for this experiment was 596.4 MPa with a standard deviation of 283.9 kPa. In this experiment a confidence interval ranging from 0.39 - 1.6 m is obtained. In Experiment 3, the values of Poisson's ratio were input as a distribution having its main value in 0.29. The impact of introducing uncertainty for both Young's modulus and Poisson's ratio, led to a compaction of 0.74 m, with a standard deviation of 0.38 m and a confidence interval of 0.22 - 1.44 m. Finally, in Experiment 4 there was an uncertainty pressure drop ΔP, having a uniform distribution with a minimum value of 10.34 and 13.8 MPa as maximum. This addition led to an increase in compaction to 0.87 m as a principal value, with a standard deviation of 0.45 m within a confidence interval of 0.25 - 1.7 m. All prior results are presented in Table 3.
Proposed Model Results
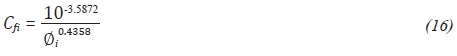
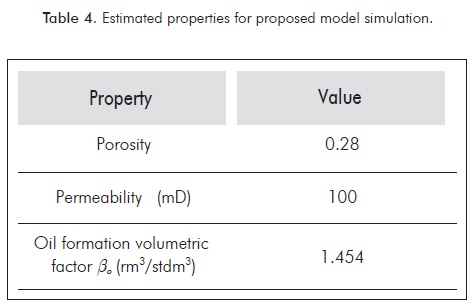
To implement the model (Mendoza & Mercado, 2013) we needed data concerning permeability k porosity Ø (Comisky, 2002), and oil formation volume factor βo (Best, 2002), which were obtained from two (J1 and J2) representative wells in the Gulf of Mexico Basin (Table 4) because they were not provided in Quoc’s (2007) work.
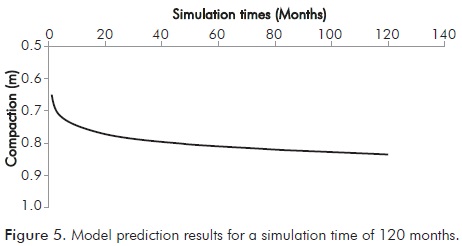
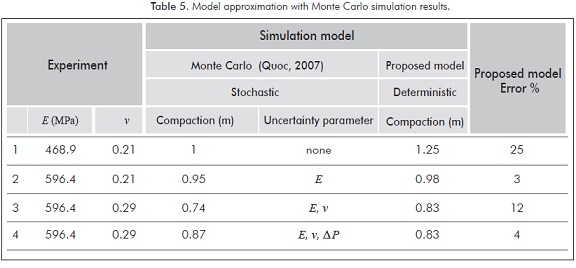
After applying procedure steps 1 to 9 and 120 iterations the compaction results were tabulated and then plotted subsequently in Figure 5. The result obtained by the proposed model showed that, after 10 years of continuous production the final compaction is 0.84 m; it is worth noting that the obtained value is close to the values obtained from the simulations above. In order to know how this model approximates the Monte Carlo simulation results it is necessary to simulate compaction varying parameters, as in Quoc’s (2007) work. Proposed model simulate the same 4 experiments presented in Table 3 but with no uncertainty (Table 5).
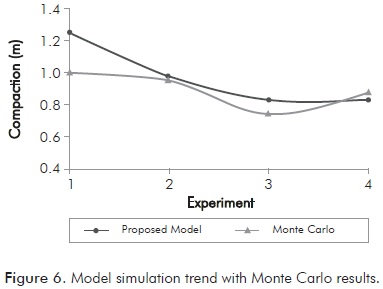
Then the results are illustrated in Figure 6 where the approximation of the proposed model can be noted. The plot trend is different because the Monte Carlo simulation model is stochastic thereby the compaction magnitude result is sensitive to uncertainty.
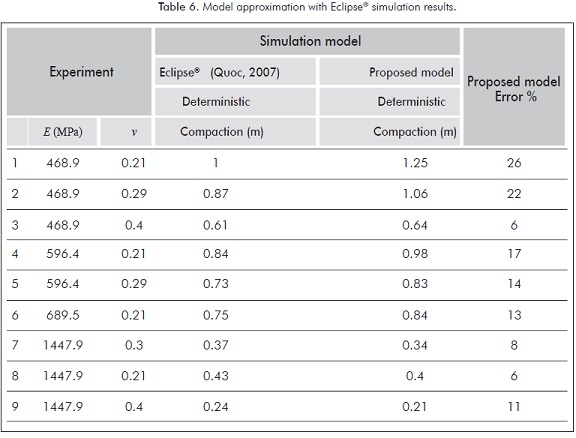
With the purpose of knowing the Numerical model approximation with Eclipse® simulation results, the proposed model is run using the same parameters as in Table 2.
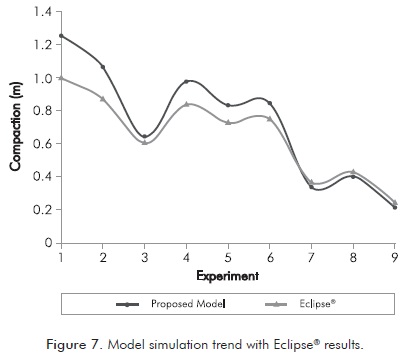
The results obtained in Table 6 are then plotted in Figure 7, which denotes the similar behavior of both plots, showing how close the model with Eclipse® simulation is. After that a regression is performed (Figure 8) to adjust the proposed model with Eclipse® simulation results.
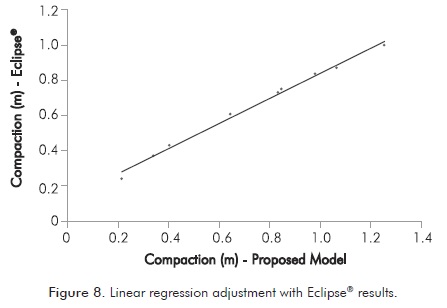
The objective to perform a regression is to get the proposed model closer to Eclipse® simulations, taking into account that both models are deterministic and both have a similar trend, so the resulting adjustment presented in Figure 9 is:
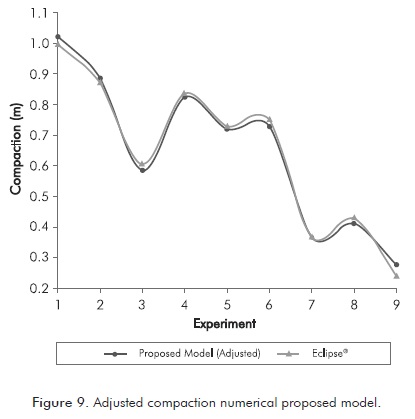
After fixing the model, the resulting error was ± 3.6 %, having a closer compaction magnitude result as compared to Eclipse® simulation results.
4. CONCLUSIONS
- With this new approach three different models are proposed: Physical, Mathematical and Numerical, where the basis of the phenomenon is described in the Physical model, the Mathematical expressions represent the Physical model, and finally the Numerical model is a solution for rock properties changing over time and for predicting the future compaction magnitude. The model does not require a lot of information, it is not complex to run, simulation times are shorter than those performed in more complex simulators and it is not necessary to use a high performance computer and most importantly this model is free which reduces costs significantly.
- It can be noted that the proposed model results trend is closer to the Eclipse® simulation results than the Monte Carlo simulation results because in first place the proposed model is deterministic and secondly the proposed model integrates a solution to the diffusivity equation which belongs to a flow equation just as the Eclipse® simulator comprises flow equations, conservation of mass equation, and equations of state.
- It is also concluded that when including the uncertainty (Monte Carlo simulation made by Quoc (2007)) of the values of elastic constants, the results show greatly reduced compaction calculated values, however, when including the uncertainty of pressure drop compaction increases because of its positive impact on it.
ACKNOWLEDGEMENTS
The authors would like to thank Universidad Industrial de Santander. They would also like to thank the reviewers of this paper for their corrections and suggestions. Lead author would like to thank Maria Fernanda Rojas for her support.
REFERENCES
Best, K. (2002). Development of an integrated model for compaction/water driven reservoirs and its application to the J1 and J2 Sands at Bullwinkle, Green Canyon Block 65, deepwater Gulf of Mexico. M. Sc. Thesis, Petroleum and Natural Gas Engineering, The Pennsylvania State University, Pennsylvania, 294pp. [ Links ]
Carman, P. C. (1956). Flow of gases through porous media. London: Butterworths Scientific Publications. [ Links ]
Comisky, J. (2002). Petrophysical analysis and geologic model for the Bullwinkle J Sands with implications for time-lapse reservoir monitoring, Green Canyon Block 65, offshore Louisiana. M. Sc. Thesis, Geosciences, The Pennsylvania State University, Pennsylvania, 134pp. [ Links ]
Fjaer, E., Holt, R. M., Horsrud, P., Raaen, A. M. & Risnes, R. (2008). Petroleum related rock mechanics. (2). Amsterdam: Elsevier. [ Links ]
Geertsma, J. (1973). Land subsidence above compacting oil and gas reservoirs. J. Petrol. Technol., 25(6), 734-744. [ Links ]
Hall, H. (1953). Compressibility of reservoir rocks. J. Petrol Technol., 5(1), 17-19. [ Links ]
Jaeger, J. & Cook, N. (1979). Fundamentals of rock mechanics. (3). London: Chapman & Hall. [ Links ]
Li, C., Chen, X. & Du, Z. (2004). A new relationship of rock compressibility with porosity. SPE Asia Pacific Oil and Gas Conference and Exhibition. SPE-88464-MS. [ Links ]
Mercado, C. & Mendoza, J. (2013). Aspectos operacionales, geológicos y geomecánicos del fenómeno de compactación y subsidencia durante la producción de hidrocarburos. Tesis de pregrado, Ingeniería de Petróleos, Universidad Industrial de Santander, Bucaramanga, Colombia, 230pp. [ Links ]
Quoc, T. (2007). Coupled fluid flow-geomechanics simulations applied to compaction and subsidence estimation in stress sensitive & heterogeneous reservoirs. Ph. D thesis, Australian School of Petroleum, University of Adelaide, South Australia, 198pp. [ Links ]
Smith, J. E. (1971). The dynamics of shale compaction and evolution of pore-fluid pressures. Math. Geol., 3(3), 239-263. [ Links ]
AUTHORS
Javier-Fernando Mendoza-Molina
Affiliation: Universidad Industrial de Santander
Petroleum Engineering, Universidad Industrial de Santander
e-mail: ing.mendoza890@gmail.com
Carlos-Andrés Mercado-Montes
Affiliation: Universidad Industrial de Santander
Petroleum Engineering, Universidad Industrial de Santander
e-mail: cmercado1992@hotmail.com
Zuly-Himelda Calderón-Carrillo
Affiliation: Universidad Industrial de Santander
M. Sc. in Petroleum Engineering, Universidad del Zulia
Ph. D. in Chemical Engineering, Universidad Politécnica de Catalunya
e-mail: calderon@uis.edu.co