


Services on Demand
Journal
Article
 English (pdf)
 Article in xml format
 Article references
 Send this article by e-mail
Indicators
-
 Cited by SciELO
 -
 Access statistics
Related links
-
 Cited by Google
 -
 Similars in
SciELO
Similars in
SciELO -
 Similars in Google
Share

 Permalink
CT&F - Ciencia, Tecnología y Futuro
Print version ISSN 0122-5383
C.T.F Cienc. Tecnol. Futuro vol.6 no.3 Bucaramanga Jan./June 2016
SVD POLARIZATION FILTER TAKING INTO ACCOUNT THE PLANARITY OF GROUND ROLL ENERGY
FILTRO DE POLARIZACIÓNSVD TENIENDO EN CUENTA LA PLANARIDAD DE LA ENERGÍA DE GROUND ROLL
FILTRO DE POLARIZAÇÃO SVD LEVANDO EM CONTA A PLANARIDADE DA ENERGIA DE GROUND ROLL
Iván-Javier Sánchez-Galvis1; Jheyston-Omar Serrano-Luna1, Carlos-Andrés Niño-Niño1, Daniel-A. Sierra1* and William-Mauricio Agudelo-Zambrano2
1 Escuela de Ingeniería Eléctrica, Electrónica y de Telecomunicaciones, Universidad Industrial de Santander, Bucaramanga, Santander, Colombia
2 Grupo de investigación, Inversión y modelado geofísico IMGeo, Centro de Innovación Tecnología (ICP) - Ecopetrol S.A., A.A. 41 85 Bucaramanga, Santander, Colombia
e-mail: dasierra@uis.edu.co
How to cite: Sánchez-Galvis, I. J., Serrano-Luna, J. O., Niño-Niño, CA, Sierra, D. A. & Agudelo-Zambrano, W.M. (2016). SVD Polarization filter taking into account the planarity of ground roll energy. CT&F - Ciencia, Tecnología y Futuro, 6(3), 5-24.
* To whom correspondence should be addressed
(Received: Feb. 24, 2015; Accepted: May 31, 2016)
ABSTRACT
In real seismic acquisition, the presence of non-planar displacements for surface waves (due for example to scattering) is a common feature. Most polarization filters work on a preferential plane, under the assumption that ground roll displacements can be well represented on a two dimensional projection. In the case of Singular Value Decomposition (SVD), this plane is defined by the two first eigen-images. However, the results we obtained show that in the presence of non-planar energy this assumption does not work properly, and it is necessary to locally decide whether the third SVD value must be included. In this work, planar energy is measured for each time window by a rectilínearity attribute along the second main axis defining a new "planarity criterion" that determines the number of eigen-images that must be filtered. This modified filter was applied to two real 2D3C data sets acquired in Colombia to improve the performance of the ground-roll 3C filtering and was used to characterize the complex particle motion within the ground-roll cone.
Keywords: Mutícomponent seismic. Seismic attributes, Surface waves, Polarization filtering.
RESUMEN
En adquisiciones sísmicas reales, la presencia de desplazamientos no planares en las ondas superficiales (por ejemplo debido a la dispersión) es una característica común. La mayoría de los filtros de polarización actúan sobre un plano preferencial, bajo el supuesto de que los desplazamientos del ground roll se pueden representar bien a través de una proyección en dos dimensiones. En el caso de la descomposición en valores singulares (SVD, por sus siglas en inglés), este plano está definido por las dos primeras auto-imágenes. Sin embargo, los resultados que hemos obtenido muestran que en presencia de energía no planar este supuesto no es apropiado, y se hace necesario decidir localmente donde se debe incluir el tercer componente de la SVD. En este trabajo, se mide la energía planar para cada ventana de tiempo utilizando un atributo de rectilinealidad a lo largo del segundo eje principal definiendo así un nuevo "criterio de planaridad" que determina la cantidad de autoimágenes que deben ser filtradas. El filtro modificado se aplicó sobre dos conjuntos de datos reales 2D3C adquiridos en Colombia con el fin de mejorar el desempeño del filtrado 3C del ground roll y de caracterizar el movimiento de las partículas dentro del cono de ground roll.
Palabras clave: Sísmica mulficomponente, Atributos sísmicos, Ondas superficiales, Filtro de polarización.
RESUMO
Em aquisições sísmicas reais, a presença de deslocamentos não planares nas ondas superficiais (por conta da dispersão por exemplo) é uma característica comum. A maioria dos filtros de polarização atuam sobre um plano preferencial, sob o pressuposto de que os deslocamentos do ground roll podem ser bem representados por uma projeção em duas dimensões. No caso da decomposição em valores singulares (SVD, por suas siglas em inglês), este plano está definido pelas duas primeiras autoimagens. No entanto, os resultados obtidos demonstram que em presença de energia não planar este pressuposto não é apropriado e torna-se necessário decidir localmente onde deve ser incluído o terceiro componente da SVD. Neste trabalho, a energia planar é medida para cada janela de tempo por um atributo de rectilinealidade ao longo do segundo eixo principal definindo um novo "critério de planaridade" que determina a quantidade de autoimagens que devem ser filtradas. O filtro alterado se aplicou sobre dois conjuntos de dados reais 2D3C adquiridos na Colômbia com a finalidade de melhorar o desempenho do filtrado 3C do ground roll e de caracterizar o movimento das partículas dentro do cone do ground roll.
Palavras-chave: Sísmica mulficomponenfe, Atributos sísmicos, Ondas superficiais, Filtro de Polarização.
1. INTRODUCTION
Ground roll is a broad concept that comprises energy of a rich variety of wave types that propagate close to the earth surface. In seismic records, ground roll is delineated by a kind of conical form that masks the information of interest (Sheriff, 2002). Among this mixture of waves, Rayleigh waves are significantly important. They are a type of surface wave characterized by elliptical polarization, slow speed, low frequency and high amplitude that result from the interaction between P and SV waves in areas close to the surface. The innermost energy component in the "ground roll cone" comes generally from the interference of scattered waves, refractions, and reverberations. The scattering of surface and body waves is caused by inhomogeneities in shallow layers (near-surface), which is physically equivalent to the radiation field of elastic excitation sources located at scattering points (Almuhaidib & Toksoz, 2014). The earth's subsurface is mainly characterized using the information provided by refractions, reflections, and conversions of internal waves. These waves exhibit linear polarization, higher frequency content, and lower amplitudes as compared to surface waves.
Ground roll interferes with internal waves and is considered the most harmful noise generated by seismic acquisition sources, thus the attenuation of ground roll has been of great interest since the beginning of seismic acquisition. A great number of methods have been proposed for this purpose; among the most popular are: FK filters, band-pass filters, and stacking (Yilmaz, 2001). However, these methods have some practical limitations because ground roll in most cases is consistent (coherent) with the information of internal waves and sometimes have a similar frequency band, as in the case for some P-S converted waves. With the emergence of multicomponent seismic acquisition, the idea of using polarizing filters emerged, based on the assumption that the motion of particles for internal waves tends to be linear whereas in surface waves tends to be elliptical.
Diverse polarization filters for ground roll attenuation have been proposed based on the elliptical behavior of those surface waves. Some of the classical methods include the polarization analysis proposed by Flinn (1965), Samson and Olson (1981), Vidale (1986), Bobbit (1984), Jurkevics (1988), Shieh and Herrmann (1990), Perelberg and Hornbostel (1994), Kragh and Peardon (1995), among others. These methods focus on the analysis of the covariance matrix of multicomponent data. Methods based on eigen-image analysis were worked by Liu (1999); Chiu, Whitmore & Gurch, M. (2007); Chiu and Howell (2008). The method based on singular value decomposition (SVD) was proposed by Jackson, Mason & Greenhalgh (1991), suggesting SVD as a technique for analyzing polarization in multicomponent seismic signals. Subsequent work used SVD for designing polarization filters. Some of the work in this area include: De Franco and Musacchio (2001); Mars, Glangeaud & Mari (2004); De Meersman and Kendall (2005); Jin and Ronen (2005); Kendall, Jin, Ronen & De Meersman (2005); De Meersman, Van der Baan & Kendall (2006); Donno, Nehorai & Spagnolini (2006); De Meersman (2008); Tiapkina, Landro, Tyapkin & Link, (2012).
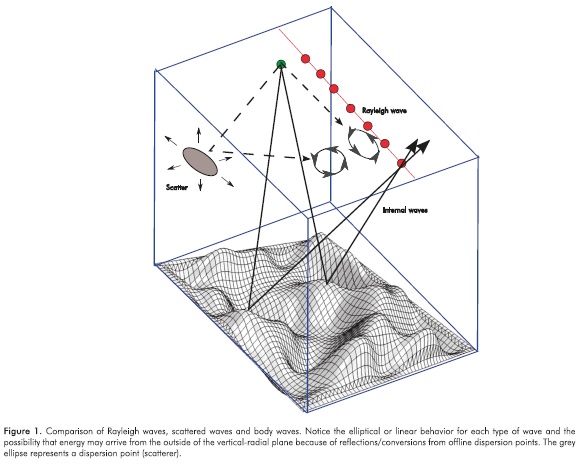
These polarization-filtering methods assume a surface wave propagation of elliptical-planar type and are valid only for pure Rayleigh waves and reflections or conversions in planar reflectors. However, the actual characteristics of ground roll are not often restricted to planar cases. For instance, when there is scattering, some impinging energy does not have a preferential plane, leading to incidental energy on different planes. Figure 1 shows that because of heterogeneities in a shallow layer, some scattering points can be involved to cause ground roll to be incidental from different directions. It can also be noticed that because of the complexity of interfaces, the direction of arrival of reflection waves is different for each reflection point.
The polarization filter based on SVD proposed by Jin and Ronen (2005) and later modified by Tiapkina et al (2012) was designed to identify ground roll areas in seismic records. This filter uses an attribute that quantifies the ellipticity of the particle motion in order to apply an adaptive filter that attenuates ground roll by subtracting the first two eigen-images from analysis window along the ground roll frequencies. Taking two eigen-images involves removing one preferential energy plane.
In this paper, the authors complement the polarization filter based on SVD proposed by Jin and Ronen (2005) and later modified by Tiapkina et al (2012). Unlike the work proposed in Tiapkina et al (2012), which filters two eigen-images throughout the whole section, this paper proposes a specific criteria to adapt the number of eigen-images that are filtered from an attribute that distinguishes the areas in the seismogram where the ground roll shows a planar behavior from the areas that do not show that behavior. In this work, the presence of nonplanar energy is measured by adapting the rectilinearity attribute along the second main axis proposed in the polarization analysis by De Franco and Musacchio (2001) that is calculated with the singular values obtained in each time window analysis.
This document is organized as follows: first, the background about singular value decomposition SVD is presented, including its capability to analyze polarization in seismic signals. Next, the methodology developed to implement the polarization filter based on SVD applied to each of the seismic stations is explained. Then, the results obtained by applying the proposed filter to real multicomponent (3C) datasets with different frequency content are shown. Later, these results are compared to those obtained with the polarization filter proposed by Tiapkina et al (2012) for each case. Finally, the document concludes with a discussion about the results and conclusions.
2. THEORETHICAL FRAMEWORK
Singular Value Decomposition
The SVD decomposition of a real or complex matrix Amxn is:

where U is a real or complex unitary matrix of mxm dimension; ∑ is a diagonal rectangular matrix mxm with nonnegative real numbers on the diagonal, and VT (the conjugate transpose of V) is a real or complex unitary matrix nxn (Strang, 1980). In developing the SVD decomposition of matrix A in terms of the elements of the matrices U, ∑, and VT, it is possible to obtain the eigen-images of A by taking its main components.
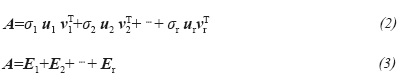
where E1+E2+...+Er are the eigen-images of the r rank matrix A; u1u2,..., ur.... um integrate the orthonormal basis for the rows space of A; an orthonormal basis v1v2,... ,vr ...vn for the columns space of A, and a set of singular values σ1,σ2,...,σr associated with the aforementioned bases (Strang, 1980).
The singular value decomposition allows for a better representation of information. In the specific case of seismic data, it allows an investigator to distinguish between seismic events with different types of polarization. For a better illustration of the physical meaning of SVD analysis, a three-component "conceptual" synthetic signal was produced in which three regions are identified: linear, planar, and non-planar (Figure 2). Figure 2b shows the hodogram for each component and the three regions of different polarization are clearly observed. It is possible to determine the directions of the main axes and its corresponding energy by performing a SVD. These main axes are the directions where greater information content is concentrated, and are represented as the vectors given by the rows of matrix V in equation (1). The energy associated with each main axis is obtained as the square of its corresponding singular value, which is represented by ai in equation (2). Figure 2c shows the amplitude of the singular values corresponding to each zone. In the case of the linear region, only one non-zero singular value is obtained (σ20, σ2=σ3=0). In the planar area, two non-zero singular values are obtained (σ1 > σ2 >0, σ3=0), and in the non-planar zone all of the values are non-zero (σ1> σ2> σ3 > 0).
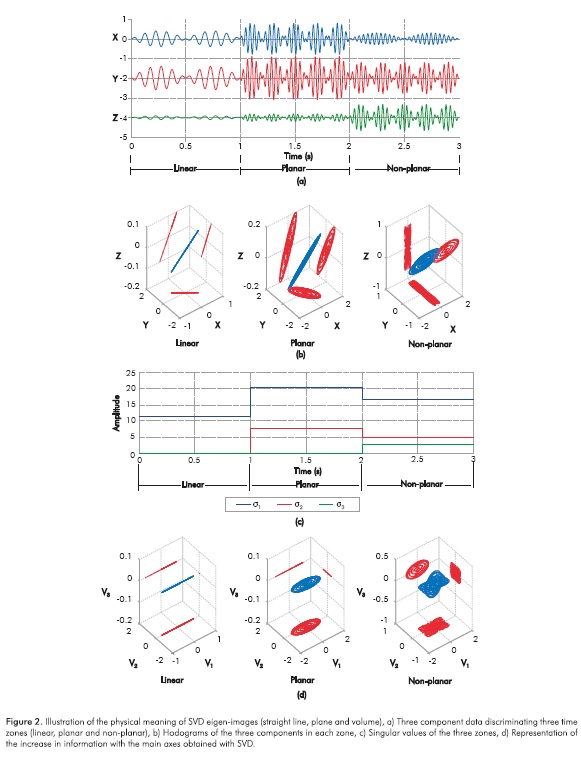
For a better representation of the information provided, data can be transformed into a new set of coordinates given by the main axes. Figure 2d shows how information is represented in these new coordinate axes. In the linear zone, the first eigenvector represents all the information; in the planar zone, the information can be represented over a plane composed by the first two eigenvectors; and finally, in the non-planar zone, as information cannot be represented in only one plane, it is necessary to use three singular vectors. The SVD filtering removes one, two, or three of these energy planes to the ground roll bandwidth.
3. METHOD
The purpose of this work is to complement the polarization filter based on SVD proposed by Jin and Ronen (2005) and later modified by Tiapkina et al (2012), who implemented a polarization filter based on singular value decomposition that allows coherent ground roll noise. The implementation is divided into two stages. In the first stage, ground roll is identified by calculating the ellipticity of the particle motion. This attribute uses the singular values obtained in each time-window that is analyzed. In the second stage, an adaptive filter is applied to attenuate ground roll information in areas where the attribute indicates ground roll is present. Filtering is performed by subtracting the first two eigen-images from the analysis window along the ground-roll frequencies. The contribution made by Tiapkina et al (2012) was to modify the attribute so that this procedure would be more robust to ambient noise and more sensitive to the low frequencies of the signal, which is characteristic in ground roll noise. This work proposes to use an additional attribute to measure the planarity of the ground roll thus having a criterion to establish the number of eigen-images to be subtracted during adaptive filtering.
Ground Roll Detection
Ground roll is detected by taking into account some of the features that ground roll exhibits. One of the most prominent features of ground roll is that it exhibits elliptical-retrograde particle motion. Jackson et al (1991) developed a polarization analysis based on singular value decomposition that take into account the information of the three components in a sliding time window W. Given that this is a single-station process, it can be applied to 2D or 3D data.
When performing the SVD of the W matrix we get:
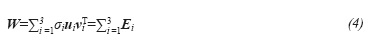
where Ei are the eigen-images of the sliding time window, σi is the i-th singular value of W and ui y viT are the left and right singular vectors respectively. The singular values are proportional to the RMS amplitude of the data in the eigenvector directions of the cross energy matrix. Therefore, an ellipsoid composed by the three singular values for each sliding window is obtained. Following Jin and Ronen (2005) and Tiapkina et al (2012), we use a sample-by-sample sliding time window.
Jin and Ronen (2005) introduced a ground roll detection attribute calculated from the singular values of a 3C multicomponent seismic signal.

where σ3 < σ2 < σ1
The attribute "e" expresses the largest section area of the polarization ellipsoid adjusted by the semi axis o3. The most appealing feature about this attribute is that it measures the ellipticity of a multicomponent signal without dividing the data by the axis magnitude. Thereby avoiding the lost of the signal amplitude information. Therefore, it is necessary to multiply the magnitudes of the main axes and take into account the high amplitudes present in ground roll noise. Tiapkina et al (2012) introduce the attribute emod, an improvement of the attribute e. This new attribute is less sensitive to ambient noise but is more sensitive to the low frequencies of the signal.
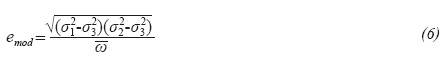
where
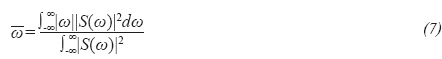
 is known as average frequency or centroid of the power spectrum for the signal s(t), where S(ω) is the Fourier transform of the signal. The spectrum centroid is calculated along the vertical component because that component has a better signal to noise ratio compared to the other components (Tiapkina et al., 2012). Once this attribute is computed for each of the sliding windows and for all the traces, it can be used as a criterion for detecting ground roll. Jin and Ronen (2005) proposed to sort the attribute e values in increasing order and to determine the value where there is an abrupt change in the attribute value, which defines a threshold e
 . Tiapkina et al (2012) propose to represent the attribute on a logarithmic scale, plot the color-encoded e values, and to superimpose this color display on the seismic record so that it is possible to analyze how the attribute behaves for the different types of waves present in a seismogram. In this way, it is possible to choose the best e value to discriminate ground roll waves.
Adaptive Filtering
Filtering is purported to remove the energy associated with the ground roll in areas where ground roll is detected. The adaptive filter proposed by Jin and Ronen (2005) is shown in Equation (8).
where F is the data after applying the adaptive filtering, g is a Boolean variable that has a value =l when e > e andg=0 otherwise. W is the time window under analysis,  1 and 2 are the first two eigen-images of the low-pass filtered data. A Yule-Walker design of lowpass filter (Friedlander & Porat, 1984) was used to find the eigen-images because it has a linear phase and guarantees that a filtered signal is in phase with the original signal.
When =0, there is no ground roll and the filtered data is the same as the original data. However, when =l, the presence of ground roll is detected and the first two eigen-images of the low-pass filtered data are subtracted from the original data. Jin and Ronen (2005) recommend, without further details, that the third eigenimage E3 should be added to the filter in Equation (8) when non- elliptical surface waves are present.
Planarity Criterion for Ground Roll
From the previous analysis, there is no clear criterion about the number of eigen-images to be included in the adaptive filter. Taking only two eigen-images implies that the ground roll energy has a preferential plane; taking three eigen-images implies that this energy does not have a preferential plane. To account for this phenomenon, we propose to use a local (i.e. for each time window) attribute that measures the planarity of the energy in each sliding window, which allows an investigator to establish whether the polarization filter has to work on a preferential plane, if you need to subtract only the first two eigen-images, or should you subtract all three eigen-images. This attribute corresponds to the rectilinearity of the second main axis presented by De Franco and Mussachio (2001). We have denoted itp, which is calculated as:
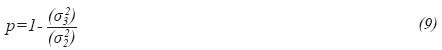
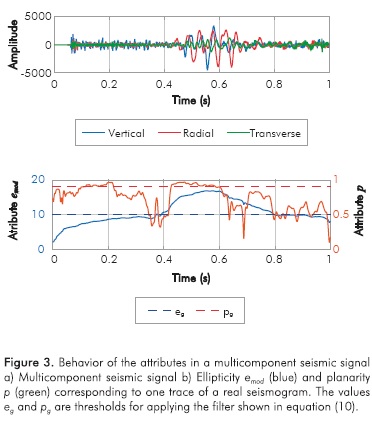
This attribute measures the ratio of the lower-energy singular values (σ2 and σ3). When the energy tends to be planar, σ3 tends to zero and p is close to 1. If the energy is not planar, σ3 tends to be σ2 andp approaches zero. Figure 3 shows the three components of a seismic trace and the behavior of attributes emod (elipticity) and p (planarity). The ellipticity attribute emod has a higher value where ground roll is interpreted in the record section as compared to areas where no ground roll is interpreted. Meanwhile, the planarity attribute p within the interpreted ground roll area tends to vary from high values at the earliest part of the ground roll area to lower values at the latest part.
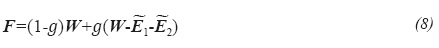
The filter proposed in this work is expressed as follows:

This filter is similar to that shown in Equation (8) except for the fact that a new variable, np, has been included as a factor of the third eigen-image of the data, after applying a lowpass filter. The variable np is a Boolean and is equal to 1 when planarity is less than the threshold p, and equals zero when the attribute is less than p, indicating the presence of non-planar ground roll. Figure 3 illustrates a possible choice for this threshold. The valuep is defined by the user, based on tests of the behavior of the filter. In particular, good results were obtained for p=0.9 in this research.
4. RESULTS
The filters discussed above were applied to two types of real data. The first dataset is a 2D-3C acquisition using a relatively high-frequency source. The second dataset corresponds to a 2D-3C acquisition in the same area using a lower frequency source that is close to the frequencies commonly used for oil prospecting. Although the concept of high or medium frequency on this application is relative, these terms were chosen to help the reader to easily identify each dataset. Table 1 shows the acquisition parameters for each dataset.
High Frequency Real Data
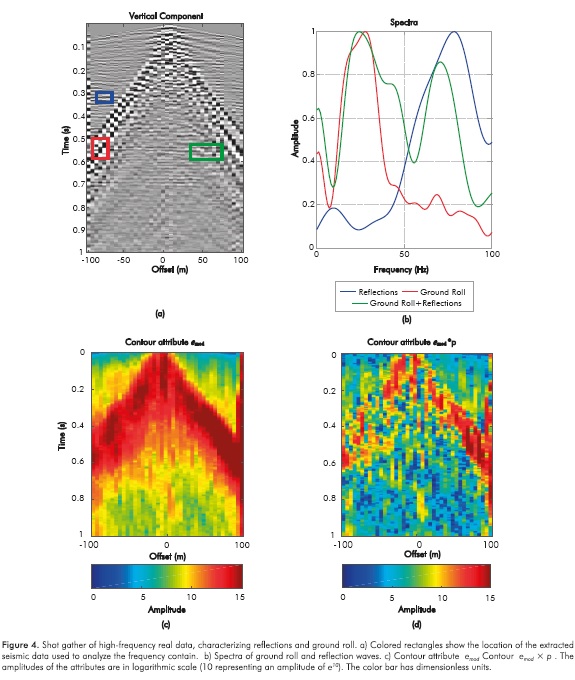
A characterization of the first set of real data was carried out by analyzing the frequency content of the signals interpreted as reflection waves and ground roll, and the behavior of the emod and p attributes in each area of the record section (shot gather). To evaluate the performance of the attributes, we have used color coding to show the values of each attribute. The values of the attributes are shown in a logarithmic scale for a better visualization.
In the first dataset, there are obvious differences in frequency between reflection waves and ground roll. In Figures 4a and 4b, it can be noticed that in the analyzed windows, reflection waves have a peak frequency of approximately 80 Hz, whereas ground roll noise has a peak frequency close to 30 Hz. The attributes also exhibit significant differences between ground roll and reflection waves. In Figure 4c, it is possible to discriminate a red region indicating higher values of the attribute emod that matches the areas where ground roll is interpreted in the shot gather. Meanwhile, in Figure 4d, the product between emod and p, indicate ground roll areas with higher planarity. Planarity is again higher in the external (earliest) part of the ground roll zone.
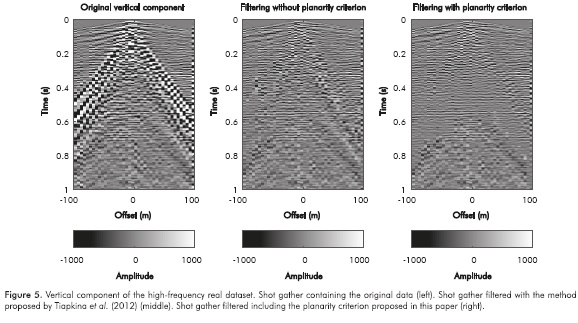
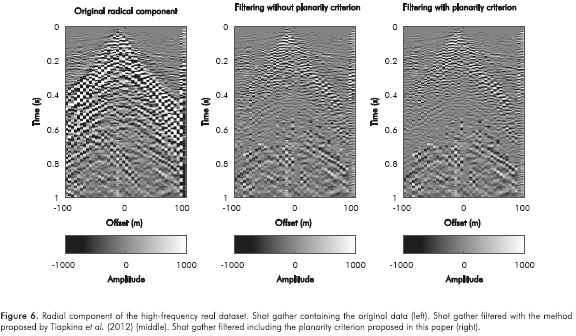
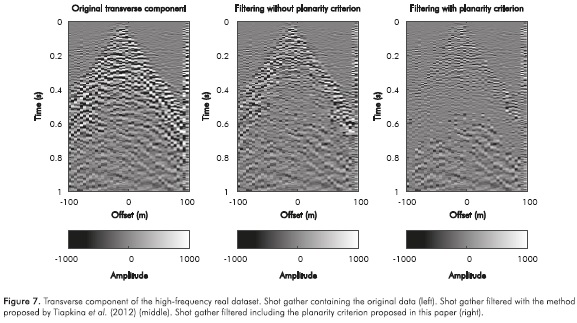
Figures 5, 6 and 7 show the results obtained with and without the planarity criterion. There are no major differences in vertical and radial components; however, strong differences can be observed in the transverse component. Conventional polarization filtering methods (e.g. Tiapkina et al., 2012) consistently eliminate two eigen-images in all the areas where the filter is applied. In this method, the number of eigen-images to be removed varies according to the criterion of planarity expressed in equations (9) and (10). We used a cutoff frequency of 50 [Hz] and threshold values equal to e=10 and p =0.9, obtained from the characterization of the data shown in Figure 4.
Medium Frequency Real Data:
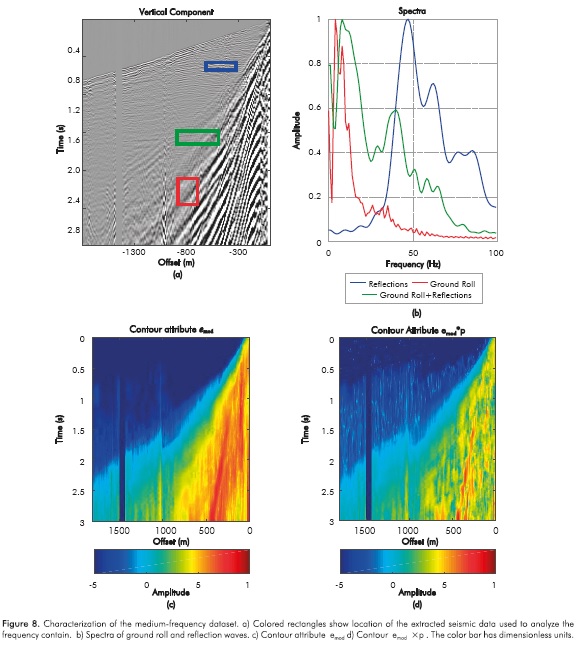
The ground roll area in this data set is wider and interferes more strongly with reflections as compared to the high-frequency dataset. Figures 8a and 8b show the signal spectra corresponding to the interpreted ground roll and reflections areas. It can be noticed that the ground roll spectra contains energy peaks at different frequencies, possibly associated with different modes of Rayleigh wave. In the color contour corresponding to ellipticity emod shown in the Figure 8c, ground roll is easily identified in the zone with high values of the emod attribute. On Figure 8d, the color contour resulting from the product of emod and p attributes shows high variability within the "ground-roll cone" with a narrow linear planarity maximum possibly associated with the fundamental Rayleigh wave mode.
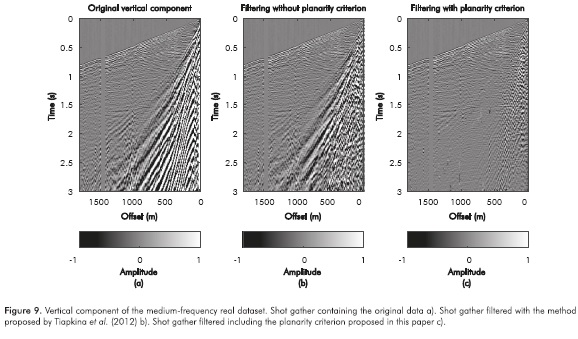
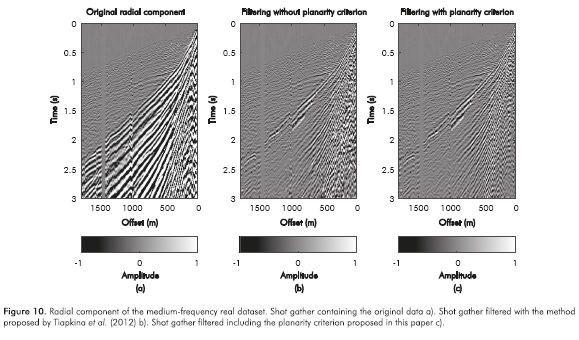
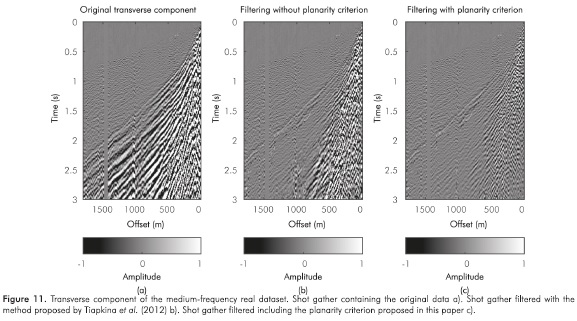
The results obtained with the SVD filtering with and without the planarity criterion are shown in Figures 9, 10 and 11. These figures show that this planarity criterion allows for a better attenuation of ground roll in the vertical component. Similarly, in the radial and transverse components, the attenuation of ground roll carried out by removing two eigen-images was similar to that obtained when the amount of eigen-images varies. Weusedacutoff frequency of 15 [Hz], and the threshold values were set to eg=l and pg=0.9 as obtained from the characterization of the data illustrated in Figure 8.
5. RESULT ANALYSIS
This section focuses on the differences between the results obtained with the polarization filter using two eigen-images, which was presented in Equation (8), and the filtering that uses a variable number of eigen-images according to the planarity criterion provided in Equations (9) and (10). We illustrate these differences in two ways: (1) the amplitude decay in the time windows, and (2) a time-frequency analysis of the vertical component for two different stations of the shot gathers presented in the previous section. For the time-frequency representations, we used the S-transform instead of the Short Time Fourier transform STFT whose resolution is fixed by the preset width of the window. The S-transform allows using a scalable length window, which additionally allows for a better local estimation of the energy (Stockwell, 1999). Moreover, S-transtorm has been used in recent years for ground roll removal (Pinnegar, 2006), (Askari & Siahkoohi, 2008), (Tan, He, Wang & Zhao, 2013).
Case I: High Frequency Real Data
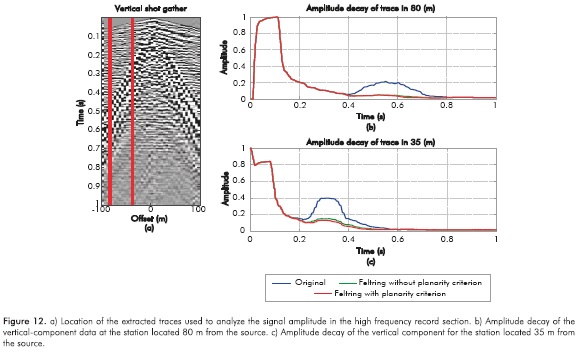
An analysis of decay amplitudes for the first high-frequency dataset is shown in Figure 12. Figures 12b and 12c show that at the stations located 80 and 35 meters from the source, the multicomponent signal amplitude (vector magnitude of the three components) is higher in areas where the ground roll is present. Assuming a slow varying velocity medium, it is possible to approximate the amplitude decay proportional to the propagation time for internal waves and to the square root of the propagation time for surface wave amplitudes. Therefore, the amplitude of the filtered signals shown in Figures 12b and 12c behave similarly to a function decaying in proportion to the square root of time, indicating the presence of surface waves. These amplitude-versus-time figures show that filtered amplitude is reduced in areas where ground roll is present, proving that the filter with the planarity criterion is more effective that the filter that works on a preferential plane. It can also be seen that in those areas where ground roll is not present, there is no difference in amplitude between the original and the filtered signals, showing that the detection attribute has been successful.
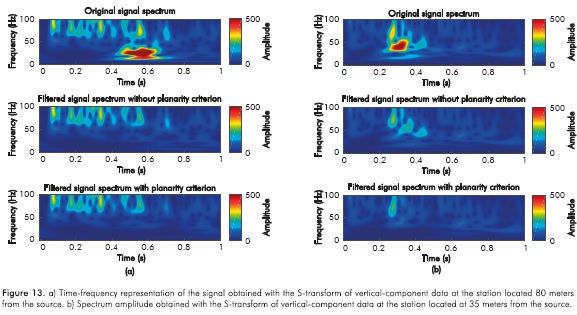
Figures 13a and 13b show the time-frequency (S-transform) representation for each of the filters at the selected stations. In the case of the station located at 80 m offset (Figure 13a), it is observed that filtered signals do not have the energy between 0.4 and 0.7 seconds and between 10 and 40 Hz that is contained in the original signal. In this case, there are no evident differences in the spectra of the filtered signals obtained by both methods. For that specific station, most of the energy of the ground roll is planar. On the other hand, the filter results on the station located at 35 m offset (Figure 13b) show significant differences. The filter operating only in the first two eigen-images obtained with SVD results in a low frequency residual energy in the presence of ground roll. That energy was successfully attenuated with the three eigen-images filter, indicating that the planarity criterion p was able to detect areas with no ground-roll planarity.
Case II: Medium Frequency Real Data
For this dataset, the stations chosen for analysis are shown in Figure 14a. The amplitude decay analysis for this case is shown in Figures 14b and 14c. It can be noticed that in areas where ground roll is present, its amplitude is better attenuated when the planarity criterion is used.
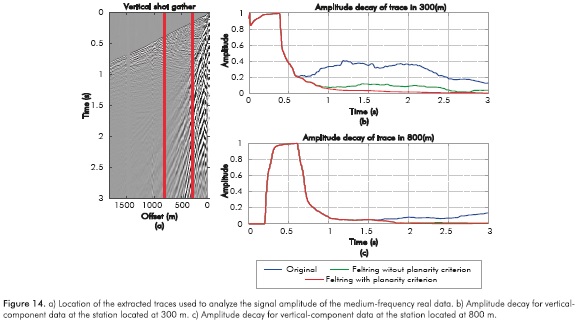
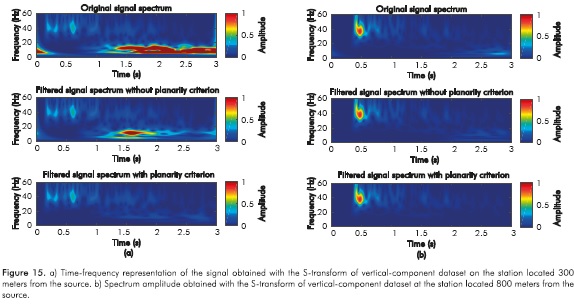
The analysis of the spectra obtained with the S-transform shows the differences between the original and the filtered signals for the station located 300 meters from the source. Figure 15a shows that between 1 to 2 seconds, the filter that does not use the planarity criteria tries unsuccessfully to reduce the ground roll. In contrast, the filter using the planarity criterion attenuates this energy better. Figure 15b shows the spectra of the original and filtered signals for the station located 800 meters from the source, in this case minor differences between both spectra can be observed because the ground roll in this area tends to be planar.
Discussion: Planarity and Ellipticity of Displacements Inside the Ground Roll Cone
The previous results lead us to propose that one of the reasons why polarizing filters are rarely successful on real data is because investigators assume ground roll has a planar behavior. Attributes such as ellipticity emod and planarityp show us that the ground roll cone exhibits areas with very different behavior. Taking for example the seismic records belonging to the medium-frequency real data, five different zones with different planarity and ellipticity values (Figure 16) can be identified. Table 2 summarizes the qualitative observations made for each of these five zones according to its ellipticity, planarity and amplitude.
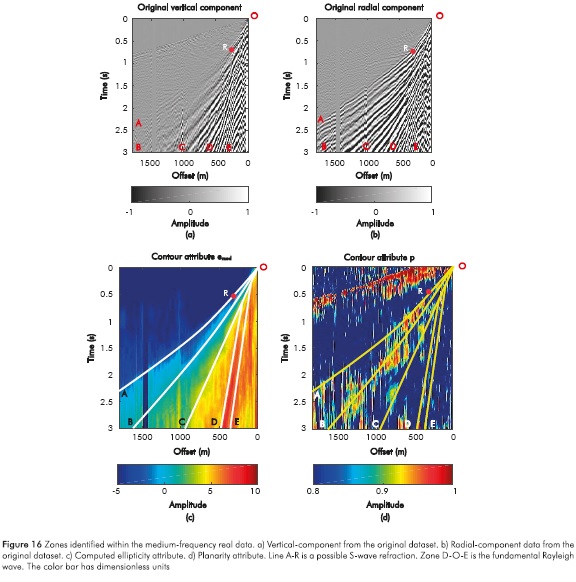

Curve A-R is a linear event with S wave velocity ranging from 460 to 740 m/s that hs higher energy in the horizontal components of the seismic data. Zone 1 spans between this linear event (AR curve) and the boundary line marked BO. Zone 2 has low-frequency and large-amplitude events in the vertical components. This area ranges from the BO curve to CO curve. Zone 3 extends from the CO line to the DO line and may correspond to higher modes of Rayleigh wave. Zone 4 corresponds to the fundamental mode of the Rayleigh wave and it is bounded by the DO and EO lines. This area shows that the fundamental mode has higher values of ellipticity and planarity than higher modes. Finally, zone 5 corresponds to the innermost part of the cone limited by the Rayleigh wave (line OE). This area contains reverberations or scattering of the surface energy, which indicates that parameter p is impinging from variable directions, and therefore events are not planar.
As shown at the beginning of the paper (Figure 1), due to heterogeneities in the shallow layer, ground roll is commonly not only composed of pure Rayleigh waves but also made up by scattered surface waves. This causes the ground roll to propagate in more than one preferential plane, and each polarization plane depends on the angle of arrival of each of these scattering waves. The scattering dominated zone is a region for which a conventional polarization filter SVD (working in only one plane) would have difficulty attenuating ground roll energy (outside of that plane).
The method proposed in this work can be used not only as a polarizing filter to attenuate ground roll but also as a first step for segregating planar from non-planar energy in the preprocessing of the seismic data for reverse processes. This method might be applied in processes like Full Waveform Inversion (FWI) of surface waves where planar energy is implicitly assumed (Plessix and Pérez, 2015). Besides, different zones within the ground roll cone can provide complementary information about the properties of the shallow layer despite these require different inversion methodologies. Linear events would require inverse techniques like refraction tomography, and elliptical events would be more suited to inversion of Rayleigh or coda waves.
6. CONCLUSIONS
- Ground roll is not fully represented by just the first two eigen-images obtained with SVD. The presence of scattered surface waves causes no planarity in the motion of particles. The filter proposed by Tiapkina et al. (2012) works on a plane composed of the two highest energy values obtained in a SVD analysis, under the assumption that ground roll can be mainly represented on that plane. Our results show that when non-planar energy is present, that assumption is not fulfilled and it is necessary to consider a third term obtained with SVD.
- The proposed filter in this works allows the third SVD term to be included if the energy in a time window is detected as non-planar. In this sense, the rectilinearity along the second main axis proposed by De Franco and Musacchio (2001) allows a new criterion to be used to measure the planarity of ground roll and defines the conditions in which it is necessary to use the third eigen-image for filtering.
- The planarity criterion improved the performance of the SVD polarization filter proposed by Jin and Ronen (2005) and modified by Tiapkina et al. (2012). Remnant ground-roll energy in frequency (or time) was attenuated taking into account the third eigen-image obtained with SVD.
ACKNOWLEDGEMENTS
This work was carried on the framework of the Agreement "Acta No. 4 del Convenio de Cooperación Tecnológica 5211794" between Universidad Industrial de Santander and Ecopetrol S.A.- Instituto Colombiano del Petróleo.
REFERENCES
Almuhaidib, A. M. & Toksoz, M. N. (2014). Suppression of Near-Surface Scattered Body to Surface Waves: Steerable and Non-Linear Filter Approach. In 2014 SEG Annual Meeting. Society of Exploration Geophysicists. [ Links ]
Askari, R. & Siahkoohi, H. R. (2008). Ground roll attenuation using the S and x-f-k transforms. Geophysical Prospecting, 56(1), 105-114. [ Links ]
Bobbit, J. I. (1984). Three-component Rayleigh wave filter. 54 Ann. Internal Mtg., Soc. Expl.: Geophysics. S23.8, 772-775. [ Links ]
Chiu, S., Whitmore, N. & Gurch, M. (2007). Polarization filter by eigenimages and adaptive subtraction to attenuate surface-wave noise. Proc. CSPG CSEG CWLS Conv, 445-449. [ Links ]
Chiu, S. K. & Howell, J. E. (2008). Attenuation of coherent noise using localized-adaptive eigenimage filter. In 2008 SEG Annual Meeting. Society of Exploration Geophysicists. [ Links ]
De Franco, R. & Musacchio, G. (2001). Polarization filter with singular value decomposition. Geophysics, 66, 932938. [ Links ]
De Meersman, K. & Kendall, R. (2005). A complex SVD-polarization filter for ground roll attenuation on multi-component data. In 67th EAGE Conference & Exhibition. [ Links ]
De Meersman, K., Van Der Baan, M. & Kendall, J. M. (2006). Signal extraction and automated polarization analysis of multicomponent array data. Bulletin of the Seismological Society of America, 96(6), 2415-2430. [ Links ]
De Meersman, K. (2008). Ground Roll polarization filtering with spatial smoothness constraints. In 2008 SEG Annual Meeting. Society of Exploration Geophysicists. [ Links ]
Donno, D., Spagnolini, U. & Nehorai, A. (2006). Seismic shape parameters estimation and ground-roll suppression using vector-sensor beamforming. In OCEANS 2006 (pp. 1-6). IEEE. [ Links ]
Flinn, E. A. (1965). Signal analysis using rectilinearity and direction of particle motion. Proceedings of the IEEE, 53(12), 1874-1876. [ Links ]
Friedlander, B. & Porat, B. (1984). The modified Yule-Walker method of ARMA spectral estimation. Aerospace and Electronic Systems, IEEE Transactions on, (2), 158-173. [ Links ]
Jackson, G. M., Mason, I. M. & Greenhalgh, S. A. (1991). Principal component transforms of triaxial recordings by singular value decomposition. Geophysics, 56(4), 528-533. [ Links ]
Jin, S. & Ronen, S. (2005). Ground roll detection and attenuation by 3C polarization analysis. 67th Annual Conference and Exhibition, EAGE. Madrid, España. [ Links ]
Jurkevics, A. (1988). Polarization analysis ofthree-component array data. Bulletin ofthe Seismological Society of America, 78(5), 1725-1743. [ Links ]
Kendall, R., Jin, S., Ronen, S. & De Meersman, K. (2005). An SVD-polarization filter for ground roll attenuation on multicomponent data. In EAGE/SEG Research Workshop-Multicomponent Seismic-Past, Present and Future. [ Links ]
Kragh, E. & Peardon, L. (1995). Ground roll and polarization. First Break, 13(9). [ Links ]
Mars, J., Glangeaud, J. L. & Mari, J. L. (2004). Advanced signal processing tools for dispersive waves. Near-surface Geophysics, 199-210. [ Links ]
Perelberg, A. I. & Hornbostel, S. C. (1994). Applications of seismic polarization analysis. Geophysics, 59(1), 119-130. [ Links ]
Pinnegar, C. R. (2006). Polarization analysis and polarization filtering of three-component signals with the time frequency S transform. Geophysical Journal International, 165(2), 596-606. [ Links ]
Plessix, R. E. & Pérez C. A. (2015). Modified surface boundary conditions for elastic waveform inversion of low-frequency wide-angle active land seismic data. Geophysical Journal International, 201(3), 1324-1334. [ Links ]
Samson, J. C. & Olson, J. V. (1981). Data-adaptive polarization filters for multichannel geophysical data. Geophysics, 46(10), 1423-1431. [ Links ]
Sheriff, R. E. (2002). Encyclopedic dictionary of applied geophysics. Society of Exploration Geophysicists. [ Links ]
Shieh, C. F. & Herrmann, R. B. (1990). Ground roll: Rejection using polarization filters. Geophysics, 55(9), 1216-1222. [ Links ]
Stockwell, R. G. (1999). S-transform analysis of gravity wave activity from a small scale network of airglow imagers. Ontario: The University of Western Ontario. [ Links ]
Strang, G. (1980). Linear Algebra and its applications. New York: Academic Press. [ Links ]
Tan, Y Y, He, C, Wang, Y. D. & Zhao, Z. (2013). Ground roll attenuation using a time-frequency dependent polarization filter based on the S transform. Applied Geophysics, 10(3), 279-294. [ Links ]
Tiapkina, O., Lando, M., Tyapkin, Y. & Link, B. (2012). Single-station SVD-based polarization filtering of ground roll. Geophysics, 77(2), v41-v59. [ Links ]
Vidale, J. E. (1986). Complex polarization analysis of particle motion. Bulletin of the Seismological society of America, 76(5), 1393-1405. [ Links ]
Yilmaz, O. (2001). Seismic Data Analysis: Processing, Inversion, and Interpretation of Seismic Data. Society of Exploration Geophysicists, 2nd edition. [ Links ]
AUTHORS
Ivan-Javier Sánchez-Galvis
Affiliation: Universidad Industrial de Santander
e-mail: ivanjavier240@gmail.com
Jheyston-Omar Serrano-Luna
Affiliation: Universidad Industrial de Santander
e-mail: jheyston.omar@gmail.com
Carlos-Andrés Niño-Niño
Affiliation: Universidad Industrial de Santander
e-mail: c_andresvt@yahoo.com
Daniel-Alfonso Sierra-Bueno
Affiliation: Universidad Industrial de Santander
e-mail: dasierra@uis.edu.co
William-Mauricio Agudelo-Zambrano
Affiliation: Ecopetrol S.A. - Instituto Colombiano del Petróleo (ICP)
e-mail: william.agudelo@ecopetrol.com.co
