


Services on Demand
Journal
Article
 English (pdf)
 Article in xml format
 Article references
 Send this article by e-mail
Indicators
-
 Cited by SciELO
 -
 Access statistics
Related links
-
 Cited by Google
 -
 Similars in
SciELO
Similars in
SciELO -
 Similars in Google
Share

 Permalink
CT&F - Ciencia, Tecnología y Futuro
Print version ISSN 0122-5383
C.T.F Cienc. Tecnol. Futuro vol.6 no.3 Bucaramanga Jan./June 2016
CHEMICAL CHARACTERIZATION OF THE ASPHALTENES FROM COLOMBIAN COLORADO LIGHT CRUDE OIL
CARACTERIZACIÓN QUÍMICA DE LOS ASFALTENOS DEL CRUDO LIVIANO COLOMBIANO COLORADO
CARACTERIZAÇÃO QUÍMICA DOS ASFALTENOS DO ÓLEO LEVE COLOMBIANO COLORADO
Juan-Carlos Poveda-Jaramillo1*, Daniel-Ricardo Molina-Velasco1, Natalia-Alexandra Bohorques-Toledo1, Mary-Helena Torres1 and Emiliano Ariza-León2
1 Laboratorio de Resonancia Magnética Nuclear, Laboratorio de Espectroscopia Atómica Molecular, Escuela de Química, Universidad Industrial de Santander, Bucaramanga, Santander, Colombia
2 Escuela de Ingeniería de Petróleos, Universidad Industrial de Santander, Bucaramanga, Santander, Colombia
e-mail: jcpoveda@uis.edu.co
How to cite: Poveda-Jaramillo, J. C, Molina-Velasco, D. R., Bohorques-Toledo, N. A., Torres, M. H. & Ariza-León, E. (2016). Chemical characterization of the asphaltenes from Colombian Colorado light crude oil. CT&F - Ciencia, Tecnologia y Futuro, 6(3), 105-122.
* To whom correspondence should be addressed
(Receved: Jun. 19, 2015; Accepted: Mar. 15,2016)
ABSTRACT
In the present work, we report the chemical characterization of asphaltenes from a light Colombian crude oil, 36° API, Colorado Crude Oil (CCO). Asphaltenes of CCO were extracted using the standard ASTM procedure, ASTM D6560-12. The approach to the chemical composition of asphaltenes was carried out by using elemental analysis (C, H, N, O, S), Fourier transform infrared spectroscopy (FT-IR), Raman Spectroscopy (RS), Matrix Assisted Laser Desorption Ionization - Time of Flight (MALDI-TOF) mass spectrometry, and proton and carbon nuclear magnetic resonance spectroscopy (1H- and 13C-NMR). Finally, the crystallite parameters of nanoaggregates of CCO asphaltenes in solid phase were calculated using X-ray powder diffraction data. The average diameters of aromatic layers L0 calculated from XRD and Raman were compared together and proved to be in good agreement. Average molecular parameters AMPs were calculated from elemental analysis, NMR and Raman spectroscopies, and X-ray diffractometry.
Keywords: Asphaltenes, Chemical characterization, Average molecular parameters.
RESUMEN
En el presente trabajo reportamos la caracterización química de los asfáltenos del crudo liviano colombiano Colorado (CCO), 36° API. Los asfáltenos del CCO fueron extraídos usando la norma estándar ASTM D6560-12. La aproximación a la composición química de los asfáltenos fue llevada a cabo usando análisis elemental (C, H, N, O, S), espectroscopia de infrarrojo con transformada de Fourier (FT-IR), espectroscopia Raman (RS), espectrometría de masas de tiempo de vuelo mediante desorción-ionización asistida por matriz (MALDI-TOF), y espectroscopia de resonancia magnética nuclear de hidrógeno y carbono (1H- and 13C-NMR). Finalmente, los parámetros cristalinos de los nanoagregados de asfáltenos de CCO en fase sólida fueron calculados usando datos de difracción de rayos X. Los diámetros promedio de las láminas aromáticas L0 fueron calculados con base en los análisis de XRD y Raman y mostraron una buena concordancia comparativamente. Los parámetros moleculares promedio fueron calculados utilizando los datos de análisis elemental, y las espectroscopias de NMR y Raman, y la difractometría de rayos X.
Palabras clave: Asfáltenos, Caracterización química, Parámetros moleculares promedio.
RESUMO
Neste trabalho, relatamos a caracterização química dos asfáltenos em óleo leve colombiano Colorado (CCO), 36° API. Asfáltenos OCC foram extraídos utilizando a regra padrão ASTM D6560-12. A abordagem para a composição química dos asfáltenos foi levada a cabo utilizando uma análise elementar (C, H, N, O, S), espectroscopia de infravermelho com transformada de Fourier (FT-IR), espectroscopia Raman (RS), espectrometria de massa por tempo de voo de dessorção-ionização de matriz assistida (MALDI-TOF). Finalmente, os parâmetros cristalinos de nanopartículas de asfáltenos CCO fase sólida foram calculados usando os dados de difração de raios-X.
Os diâmetros médios das folhas de aromáticos La foram calculados a partir de DRX e da análise Raman, exibindo boa concordância comparativamente. Os parâmetros moleculares médios foram calculados a partir dos dados de análise elementar, espectroscopias de RMN e de Raman, e difractometría de raios-X.
Palavras-chave: Asfáltenos, Caracterização química, Parâmetros moleculares médios.
1. INTRODUCTION
Asphaltenes are defined as the fraction of oil that precipitates with n-heptane and which is soluble in toluene. Asphaltenes do not melt under normal conditions and decompose to form volatile compounds and carbon at temperatures ranging from 300 to 400°C. Under an atmosphere of nitrogen, ∼10 microns thick asphaltene films melt between 312 and 358°C (Asprino et al, 2005).
Studies dealing with the molecular weight of asphaltene are more controversial. The tendency of asphaltenes to aggregate in toluene at concentrations from as low as 50 mg/liter has led to aggregate weights being misinterpreted as molecular weights with colligative methods such as Vapor Pressure Osmometry (VPO) or Gel Permeation Chromatography (GPC) (Goncalves et al, 2004). Results based on advanced analytical techniques as Field Ionization Mass Spectrometry (FIMS) (Altgelt & Boduszynski, 1994), Fluorescence Correlation Spectroscopy (FCS) (Schneider et al, 2007), Time Resolved Fluorescence Depolarization (TRFD) (Groenzin & Mullins, 1999; 2000), electrospray ionization Fourier transform ion cyclotron resonance mass spectrometry (ESI FTICR MS) (Hsu et al, 2011; Smith et al, 2008), atmospheric pressure photoionization mass spectrometry (APPI MS) (Medrignac et al, 2004), Field Desorption/Field Ionization Mass Spectrometry (FDFI MS) (Qian et al, 2007), and Laser Desorption Ionization (LDI) (Hortal et al, 2007), now agree to state that asphaltene molecular weight distributions are in the 400-1500 Dalton (Da) range, with a mean mass between 700-800 Da.
Elemental analysis of asphaltenes from different crude oils reveals that some of its elements may vary over a wide range. The H/C ratios were 1.15 ± 0.05%, although the H/C ratios often have values outside this range. Asphaltenes contain Q H, N, O, S, Ni and V, forming a series of relatively large molecules containing a few "building blocks": aromatic, naphthenic and heteroaromatic and aliphatic ring chains pendant on them (Chang & Fogler, 1994; Biktagirov et al, 2014).
The elucidation of the chemical structure of all their molecules is a very complex and yet unfinished task.
These results have been interpreted according to the analytical method used and there are basically two options: the first and more common is to reduce them by average and simplify all its complexity to a few Average Molecular Parameters (AMPs), and / or to an average molecule; the second, and most modern, is to try to identify as many molecules present on this fraction.
Based on the AMPs, two types of architecture of these molecules have been proposed: like an island (Yen, 1972) and like an archipelago (Murgich, Rodriguez & Aray, 1996). The first model proposal consists of a unique condensed aromatic system and saturated rings substituted with alkyl chains; whereas the second model proposal consists of several and small aromatic rings forming a structure like a group of islands linked by bridges of aliphatic chains. Most recent studies on the chemical structure of asphaltenes by Fourier Transform Ion Cyclotron Resonance Mass Spectrometry (FT-ICR MS) reveal the coexistence of both: island and archipelago (McKenna, Marshall & Rodgers, 2013; Podgorski et al, 2013). Characterization methods according to structural groups may sum up the molecular characteristics of complex mixtures in terms of a few parameters. Asphaltenes contain fused polynuclear aromatic ring systems (rarely exceeding the carbon number of six), alkyl chains and naphthenic systems involving heteroatoms (Yen, Erdman & Pollack, 1961; Williams, 1958; Hirsch&Altgelt, 1970; Clutter et al, 1972; Kiet, Malthotra & Blanchard, 1978; Ladner & Snape, 1978; Gillet et al, 1980; Yoshida et al, 1980; Qian, Li & Zhang, 1984; Delpuech et al, 1985; Rongbao, Zeng-min & Bailing, 1988; Poveda & Molina, 2012; Strausz, Mojelsky & Lown, 1992). The archipelago models consider that several aromatic moieties are bridged together via aliphatic chains (Strausz et al, 1992), whereas the continental model suggest that there is predominantly one fused Polycyclic Aromatic Hydrocarbon (PAH) ring system per asphaltene molecule with pendant aliphatic chains (Dickie & Yen, 1967). New fragmentation studies by two-step laser desorption laser ionization mass spectrometry (L2MS) and FTICR-MS support the contention that the dominant structural character of asphaltenes is island-like (Hsu et al, 2011; Sabbah et al, 2011). These results are compatible with other methods such as TRFD (Groenzin & Mullins, 2000), high-Q ultrasonics (Andreatta et al, 2005), and NMR (Lisitza et al, 2009).
A single molecular model is not sufficient to represent all the molecules present in a sample of asphaltenes. By using computational methods with molecular dynamics models, it is possible to study asphaltene-asphaltene and asphaltene-resin interactions, and the way they interact with solvents. Using the Monte Carlo method, a molecular representation of Athabasca oil asphaltenes has been reported (Sheremata et al, 2004). With this technique, a group of one hundred molecules was proposed and MW, and 1H- and 13C-NMR were selected through a nonlinear algorithm for sequential optimization, within a subset of six molecules consistent with the data obtained from elemental analysis,.
Based on the previous studies, a new asphaltene model has been codified in the "modified Yen model" and stipulates the dominant structure of asphaltene molecules, nanoaggregates and their clusters (Mullins, 2010) . This model was built upon the Yen Model, which has been in use for 40 years (Dickie & Yen, 1967). The Yen model has been very useful, particularly for considering bulk properties of phase-separated asphaltenes. Nevertheless, at the time the Yen model was proposed, there were many uncertainties in asphaltene molecular weight, architecture, and colloidal structure. The continental architecture exhibits attractive forces in the molecule interior and steric repulsion from alkane peripheral groups. These structures were also observed in oil reservoirs with an extensive vertical offset, where gravitational effects are evident (Mullins et al., 2011; Mullins et al., 2007). Results from analytical methods such as Time-Resolved Fluorescence Depolarization (TRFD) (Groenzin & Mullins, 2000), nuclear magnetic diffusion (Freed et al, 2007), Fluorescence Correlation Spectroscopy (FCS) (Ballard et al, 2006), and DC conductivity indicate that the size of the asphaltene molecules is 1.5 nm (Zeng et al, 2009; Goual et al, 2011) .
Asphaltenes obtained from light crudes have proven to differ from those obtained from heavy crude oils. Normally, paraffinic crude oils have small amounts of asphaltenes exceeding in one or two percent in a few cases. However, despite the low content of asphaltenes severe obstruction problems take place, including the plugging of pipelines associated with asphalteneparaffins co-precipitation. In Colombia, problems have arisen in producing fields whose content of asphaltenes in crude oil reaches one percent. In most cases it is observed that plugging problems on the deposits formed contain both asphaltenes and paraffins. In laboratory, conventional separation techniques are not sufficient to obtain asphaltene samples free of paraffins. It is therefore important not only getting samples free of paraffin, but also their molecular characterization in order to understand the phenomena associated with asphaltene-paraffins interaction and co-precipitation thereof.
In this work, we present the results of the chemical characterization of the asphaltenes obtained from the Colorado Colombian light crude oil. The spectroscopic characterization includes the results obtained using elemental analysis, infrared and Raman spectroscopies, mass spectrometry in the MALDI mode, 1H- and 13C-nuclear magnetic resonance spectroscopy; and finally, x-ray diffractometry to calculate the parameters of asphaltenes crystallites.
2. EXPERIMENTAL
Asphaltenes from Colorado crude oil were extracted using the standard ASTM procedure test designations D6560-12 (ASTM, 2001). This paper provides a brief description of the procedure. A Colorado crude oil sample was mixed with n-heptane at a mass ratio of 1:20 in a glass flask. The mixture was boiled under reflux for 60±5 min and stored in a dark cabinet for 120 min, calculated as from the time it was removed from the reflux. Once the single sample was stored in the dark, it was filtered using a filter funnel with Whatman paper (grade 42 and 125 mm diameter). The liquid was decanted into the filter paper, and the residue in the flask was then transferred as completely as possible with successive quantities of hot heptane, using the stirring rod as necessary. The filter paper containing the asphaltene residue was transferred and placed in a reflux extractor and refluxed with heptane for an extraction period of 180 min. However, saturated compounds as paraffins were trapped in asphaltenes. Therefore the sample was subject to extensive washing with heptane up to one hundred hours. The asphaltenes were transferred to a flask by refluxing with toluene until all the asphaltenes dissolved from the paper. Finally, the toluene from the asphaltenes dissolved in toluene was evaporated in a rotary evaporator. The sample was dried in an oven under an inert N2 atmosphere at a temperature near 100°C for 45 min. Elemental analysis was conducted out using a Thermo Scientific™ elemental analyzer, model Flash 2000 HT.
Infrared Spectroscopy of Asphaltenes
The infrared spectrum of the Colorado asphaltene sample was collected on a Bruker TENSOR-270 FTIR spectrometer with a spectral range from 370 to 7500 cm1. Only the spectral range from 500 to 4000 cm-1 (mid-IR) was used in this study. Spectra were obtained by adding 64 scans with a spectral resolution of 1 cm1. The infrared radiation was measured with a low noise DLATGS (Deuterated L-α-Alanine-doped TriGlycine Sulfate) detector with KBr windows. We measured the FTIR spectra by the ATR technique using a Bruker ATR A225 sample cell equipped with a diamond crystal with a quadrate area of 2 x 2 mm2.
Raman Spectroscopy
The asphaltene sample was reduced to a fine powder and then pressed to obtain a pellet of 4 mm in diameter. The LabRAMAramis (Horiba JobinYvon) micro-Raman system was used for Raman measurements. The Raman spectrum was acquired in a backscattering configuration with a 100x long work distance objective used to focus the laser and collect scattered light. A solid-state laser at 473 nm was used as the excitation source, and the typical laser power at the sample position was -0.08 mW. The Raman spectrum was measured in the range from 400 to 2000 cm1 at room temperature; this range covers the first-order region. For data analysis, we used Gaussian functions to fit the best number of peaks. Peak positions were located by determining the peak center at the half-maximum, and the peak width was measured at the Full Width at Half-Maximum (FWHM) (Bouhadda et al, 2007; Abdallah & Yang, 2012).
NMR Spectroscopy
The 1H- and 13C-NMR spectra were obtained using a Bruker Avance III spectrometer operating at 400 and 100 MHz, respectively. The 1H-NMR samples were 4 wt% solutions in CDC13 (99.8 % D). Thirty-degree pulses (Bruker zg30 pulse sequence) were used, obtaining a delay time of 2 s (sweep width 49000 Hz) 32764 data points. Sixteen scans were averaged for the spectrum. The 13C-NMR of sample was measure in 10 wt% solutions in CDC13 (99.8% D). Thirty-degree pulses (Bruker zgig30 pulse sequence) were used again and a delay time of200s (sweep width 22400.0 Hz) 32764 data points was obtained. 1024 scans were averaged for the spectrum. The spectrum was recorded using 5mm and 10mm probes for 1H- and 13C-NMR, respectively, with a spinning rate of 10 Hz and temperature of 298.15 K. Also, the 13C-NMR spectrum of the sample was acquired using the 4 mm solid-state NMR probe. The spectrum was acquired using MAS conditions with a rotation rate of 12000 Hz and using one-pulse sequence without cross polarization to obtain a quantitative spectrum.
Matrix Assisted Laser Desorption Ionization Mass Spectrometry
MALDI-TOF spectra were recorded using a Bruker Reflex II MALDI-TOF Mass Spectrometer (Bremen, Germany) equipped with an Nd:YAG laser emitting at the third harmonic 355 nm, operating at a pulse rate of 500 Hz, with a pulse width of 3.5 ns. Samples of Colorado asphaltenes were prepared using anthracene as the matrix in a ratio of 1/100. A mixture of asphaltene/ anthracene (5 mg) was diluted in 2 mL of chloroform/ toluene (50/50). The sample (2 µL) was deposited into the sampler and dried in an inert N2 atmosphere. Spectra from 2500 shots of the laser were added to obtain the final TOF spectrum. The best experimental conditions were selected by comparing the spectra at different laser intensities and ionization regions in the sample. The mass spectrometer was operated in the reflectrom mode, scale was calibrated prior to measurement with a standard of appropriate molecular mass. The average number and weighted average of the molecular weights (Mn and Mw) of Colorado asphaltenes were calculated using Equations 1 and 2 (Qian et al., 2007):
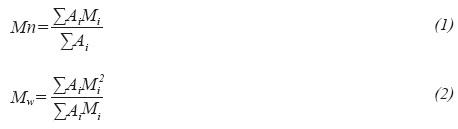
where Ai is the relative integrated area, and Mi is the calculated molecular weight of the ith peak in the R-TOF spectrum. Finally, the sum was extended over all peaks found in the spectrum using the peak picking procedure implemented in the mMass software (Strohalm et al, 2010; Strohalm et al, 2008).
Ray Diffraction
X-ray diffraction measurements were made from finely ground powders of asphaltenes using a Bruker D8 Advance automated diffractometer. The instrument uses an X-ray tube with a copper target (Kα1 1.5406 Å) operating at 40 kV and 30 mA, a nickel filter as a monochromator, an autodivergent slit at 0.6 mm, a soller slit at 2.5°and it is also equipped with a lynx-eye linear detector. The two-theta angle was scanned from 5 to 80° in steps of 0.015° with 5 s per step. The peak profile analysis was performed assuming that single peaks have Gaussian profiles to fit the diffraction pattern, allowing for an accurate determination of peak positions, widths (FWHM), intensities, and peak areas.
3. RESULTS AND DISCUSSION
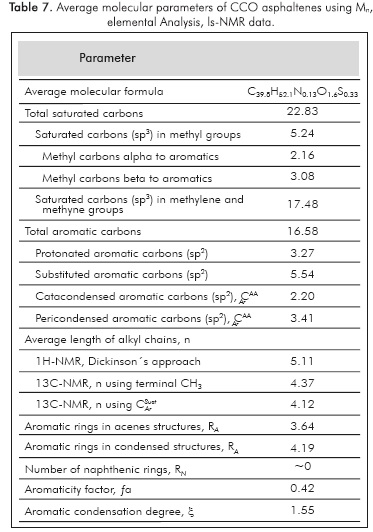
Elemental Analysis
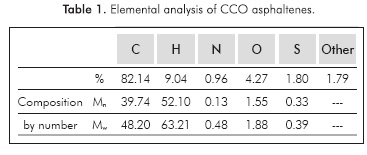
As previously mentioned, the H/C ratio for most asphaltene samples is 1.15. For asphaltenes from CCO, the H/C ratio is 1.32, a higher ratio when compared to typical asphaltenes. This result indicates that the nature of asphaltenes changes according to the molecular characteristics of crude oil. The CCO is a paraffinic crude oil with a lower content of asphaltenes, approximately 0.9%. See Table 1.
FTIR Spectroscopy
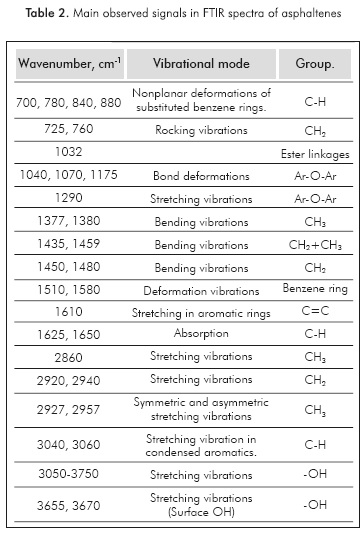
The FTIR analysis usually considers two alternatives: frequency assignments and determination of intensities related to specific bands. The most commonly observed absorption bands in crude oils and their fractions are reported in Table 2.
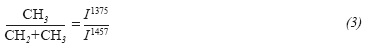
Some reports using FTIR data intend to obtain quantitative information about the structure of samples. A linear relationship between the relative intensities of alkane bending deformation vibrational frequencies (between 1380 and 1460 cm1) and the ratio (CH2/CH3) of the corresponding aliphatic chains had been observed (Bellamy, 1957; Liang et al, 2000; Liu et al, 2001). Direct applications of the methodology have been reported to study the variation in the Average Length of the Aliphatic Chain (ALAC) of mature coals, via deconvoluted FTIR, in the region of 1360-1390 cm-1 (Benkheddae/a/., 1992). The ratio δ(CH3)/δ(CH3+CH2) can be used to predict the ratio of methyl to methylene groups obtained from the ratio of peak intensities at 1375 cm-1 and 1457 cm1, as follows:
Other frequencies that seem to represent a linear relationship are the frequencies 2920 and 2950 cm-1, as well as 2927 and 2957 cm-1, corresponding to the symmetric and asymmetric stretching frequencies of the methylene and methyl groups (Khadim & Sarbar, 1999). FTIR deconvolution analysis in the 2700 to 3100 cm-1 region helps characterize the CH3(asym), CH2(asym), CH, CH3(sym) and CH2(sym) vibrational modes and calculate the area of absorption bands. Thanks to the asphaltene intensity value for a given wavelength, it is possible to obtain the corresponding CH2/CH3 ratio.
Partial deconvolution can be applied to facilitate the determination of intensities of signals from asphaltene FTIR spectra where signals cannot be differentiated.
The ratio of HMe (number of hydrogen atoms present in methyl groups in the sample) to Hsat (number of hydrogen atoms attached to saturated carbon atoms in the sample) can be calculated using Equation 4 (Coelho et al, 2006):
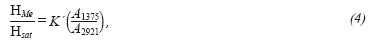
The hydrogen ratio for methyl and methylene groups can be calculated directly from signals at 2927 and 2957 cm-1 assigned to hydrogen atoms on CH2 and CH3 groups, respectively. FTIR measurements were used to study the petroleum fluid inclusions using the relationship of CH2/CH3, which corresponds to the ratio of the respective intensities at the 2927 and 2957 cm-1s frequencies (Pironon et al., 2001). Then the nCH2/mCH3 ratio can be calculated using an expression developed using a set of alkylbenzenes on the basis of the experimental intensity ratios versus the theoretical nCH2/mCH3 ratio, so the methylene to methyl group ratio is calculated using Equation 5 (Coelho et al., 2006):
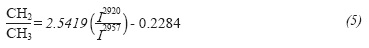
Using 20 model compounds (normal and isoalkanes and alkylaromatics), a linear correlation between the molar ratio nCH2/mCH3 and the ratio between band intensities at 2927 and 2957 cm-1 was found as follows (Calemmaeia/., 1998):
where k = 1.243 is simply the linear correlation coefficient of the plot nCH2/mCH3 vs. 1(2927 cm1) /I(2957 cm1) (linear correlation coefficient = 0.996).
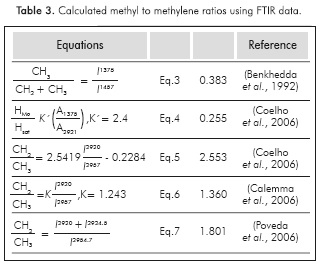
To calculate the ratio of methyl to methylene groups, we employ Equations 3 to 6. The integrated areas of signals at the frequencies 1374.6, 1456.2, 2919.2, and 2955.9 cm-1 were used (see FTIR spectrum in Figure 1). Results are reported in Table 3. Analyzing the results in Table 3, using Equation 3, the ALAC is near four, while using Equation 4 the value is near 5.5. In contrast, values calculated using Equations 4 and 5, are different. This can be attributed to the number and type of reference compounds used to predict the relationship between signal intensities and the theoretical values of the methylene to methyl ratio. Additional data from a larger data set from a wider group of model compounds proposes a general rule. Using the equation reported by the authors, Equation 7 in Table 3, the ALAC value was near 2.8 (Poveda et al, 2014).
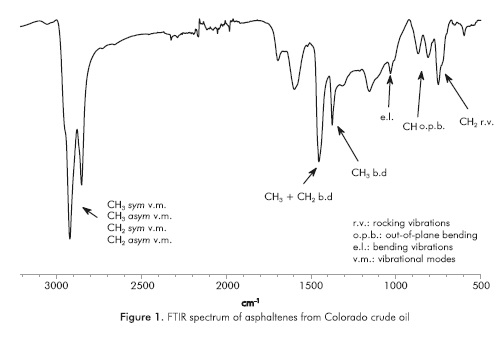
In infrared spectra at 720 cm-1, a splitting of the methylene "wag" peak is observed in asphaltene samples, indicating formation of ordered crystals with long alkyl chains. The intensity of this infrared peak indicates that this type of contribution is small, assuming that the intensity and contribution of the physical effect are proportional.
Raman Spectroscopy
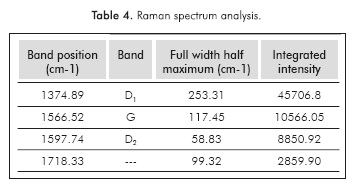
A simple yet quantitative description linking the observed modes and the molecular structure was proposed using the intensity ratio between the g mode and the Dl mode. This ratio has been largely adopted as an empirical relationship (Ferrari & Robertson, 2004). The integrated intensities (Table 4) of the Dl and g bands (respectively Id and Iq) are sensitive to the microcrystalline planar crystal size La (Tuinstra & Koenig, 1970):
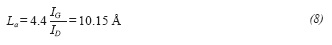
Given that this paper is focused on evaluating the molecular (or the aggregate) structure of asphaltene, equation 8 was the sole equation used for estimating La. However, the parameter La so evaluated would be jeopardized if the integrated G and D1 intensities are not accurately determined, or if the G is not in the right range (i.e., 1570-1610 cm-1) where equation 8 holds (Tuinstra & Koenig, 1970). Accurate determination of G and D intensities is therefore required. The La value is close to that obtained by X-Ray diffraction as shown below.
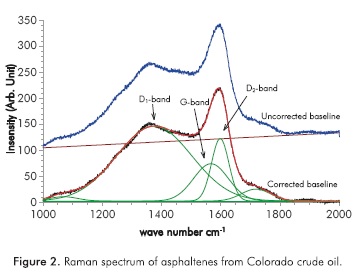
Curve fitting of the Raman spectra is often used to extract more reliable G and D band intensities, as shown in Figure 2. Most commercial data analysis software provides such an option. There are several models and functions commonly used for curve fitting. In this study, we first applied a three-peak fitting (Dl5, D2 and G) with three functional forms for the peaks, namely, the Gaussian, Lorentzian, and a combination of them (Gaussian/Lorentzian). Due to the shoulder incompatibility in the three-peak fitting, we also attempted a nine-peak fitting. Although the nine-peak fitting provides a much more satisfactory fitting quality and to some extent, provides supporting information for the overall structural argument, the nine-peak fitting may pose the risk of ambiguity. The three peak data were used for our analysis, Figure 2.
Nuclear Magnetic Resonance Spectroscopy
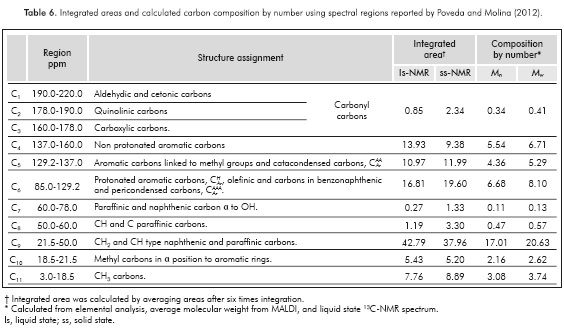
Because asphaltenes are a complex mixture, the NMR spectra of asphaltenes do not show a pattern like the pattern obtained for pure samples. NMR spectra are divided into regions, with each region being assigned to a chemical group in the sample. Integrated areas are proportional to the relative amount of the chemical groups in the sample. The main chemical groups present in asphaltenes and the spectral ranges where they appear in 1H- and 13C-NMR spectra are shown in Tables 5 and 6, respectively.
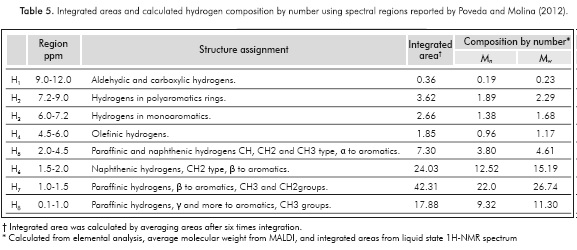
The 1H-NMR spectrum was characterized by a weak signal of aromatic hydrogens, 6.0 to 9.0 ppm. In this region the solvent signal appears, namely, CDC13 (7.24 ppm, see Figure 3). The region where the alkyl hydrogens appear (0.1 to 4.0 ppm), including paraffinic and naphthenic hydrogens, can be analyzed and information about the average number of carbons per alkyl chain can be obtained. Using the Dickinson's equation (Equation 9), the average number of carbons per alkyl side chain (n) can be calculated from the integrated regions in the 1H-NMR spectrum (Dickinson, 1980).
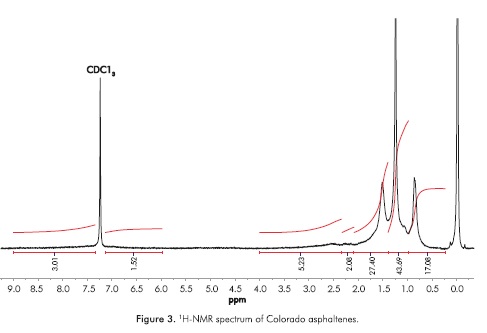
where Hα corresponds to hydrogens in CH3 groups more than three bonds from an aromatic core appearing from -1.0 to 1.0 ppm, Hβ hydrogens in CH3, CH2, and CH groups at two or more bonds from aromatic cores appearing from 1.0 to 2.0 ppm, and Hγ hydrogens in CH3, CH2, and CH groups joined directly to aromatic cores appearing in the regions of 2.0 to 4.0 ppm. In the regions from 6.0 to 9.0 ppm, signals of aromatic hydrogen are detected. The n calculated value was 5.11, indicating that the ALAC is close to five carbons. This result is slightly different to that calculated by FTIR spectroscopy using Equations 3 and 4. The spectrum of 1H-NMR shows the paraffinic nature of the sample, and the signals should be analyzed on the basis of the composition of paraffinic and naphthenic saturated groups in the sample of Colorado asphaltenes. The analysis of the average molecular parameters should be done in conjunction with 1H- and 13C-NMR, given the fact that the integrated area is quantitative.
The liquid 13C-NMR spectrum of Colorado asphaltenes is shown in Figure 4. From data of integrated areas of the aromatic (85-160 ppm) and alkyl (3.0-78 ppm) regions, the aromaticity factor, ƒα, was calculated as:
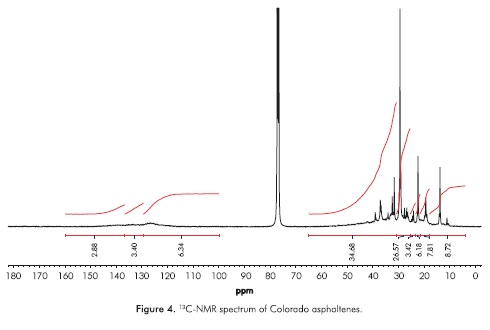
where CAr is the integrated area of aromatic carbons in the region from 85 to 160 ppm, and CAlq is the integrated region of alkyl carbons appearing from 3 to 78 ppm. The calculated value of ƒα was 0.42, a low value when compared to other asphaltene samples obtained from medium and heavy crude oils. The region where aromatic carbons appear can be subdivided into three regions, from 85.0 to 129.2 ppm, assigned to Protonated aromatic carbons,  , olefmic and carbons in benzonaphthenic and alkylic fragments and pericondensed carbons,
  . From 129.2 to 137.0 assigned to those aromatic carbons linked to methyl groups and catacondensed carbons,
  and from 137.0 to 160.0 assigned to those aromatic non-protonated carbons, which correspond to aromatic carbons substituted by alkyl chains,
  , see Table 6. From 1H-NMR we calculate the number of aromatic hydrogens, HAr, see Table 5, which correspond to 3.27, calculated from (H2+H3 )*52.1/100, then HAr is equal to the number of protonated aromatic carbons,
  so it is possible to calculate the number of aromatic pericondensed carbons,
  , and the composition by number is 3.41. From region 129.2 to 137.0 ppm it is possible to calculate the number of aromatic catacondensed carbons, , although one may argue that the number of aromatic carbons linked to methyl groups can be obtained from region 18.5 to 21.5 ppm, then
  , and number 2.20, see Table 6.
By using the region at low frequencies where saturated carbons appear it is possible to obtain new structural data. The total number of carbons in methyl groups results considering the regions C10 and C11. The calculated number of carbons was  . The total number of saturated carbons was calculated from the integrated regions between 3.0 to 78.0 ppm (C7 to C11), 22.83. So, we can obtain a new average number of carbons per alkylic chain, where n is
  . This result is different from that obtained using 'H-NMR data and the Dickinson (1980) approaches as explained above (Poveda & Molina, 2012). An structural explanation to this is the presence of ramifications in the saturated chains. If we suppose that saturated side chains in asphaltenes follow the general formula Cn H2n+2, from the total saturated carbons it is then possible to calculate the theoretical number of hydrogens, which is 47.66. From 1H-NMR spectrum the number of hydrogens in saturates was 47.68. Results are compatible and suggest from a molecular point of view that the presence of insaturations (C=C) was not possible and the presence of naphthenic rings is negligible.
Based on the number of aromatic carbons, it is possible to argue the number of rings present per aromatic layer. Two options can be considered; the first one relates to aromatic unit type acene compounds. There, the aromatic rings are added step by step without the formation of condensation nucleus, in this case pericondensed carbons are not detected in the 13C-NMR spectrum, only catacondensed carbons In this case, it is possible to propose that a general formula for the formation of acenes, a seeder ring (six carbons) and each additional ring require four carbons, then the number of carbons in acenes is expressed as 6+4n, where n is the total number of rings less one, in our case n is 2.64, and the number of aromatic rings RA 3.64. Also, we can analyze the case when a condensation nucleus is present. In this case the central ring requires six carbons plus four carbons for the second ring, additional ring increases the number by 3. Cata- and peri-condensed carbons are present when condensation nuclei are observed in the structure. So, the ratio / is the condensation degree ξ, that shows how is the condensation of the aromatic structure. In the limit when ξ is zero no condensation is observed, as in acene structures, but when it is higher than one it is possible to observe aromatic cores strongly condensated as occurs in coronene C24 H12 (Poveda & Molina, 2012).
For Colorado asphaltenes the ξ, reaches a value of 1.55, which is difficult to explain in terms of aromatic structure for lower mass compounds. From our point of view this cannot be understood strictly based on the numerical results, but explained on the basis of the presence of highly condensed aromatic molecules, as in the case of pyrene C16 H10. Table 7 summarizes the calculated average molecular parameters for samples of Colorado asphaltenes.
The solid-state spectrum of asphaltenes shows mainly wide bands (-10 to 220 ppm). The area of different regions in the spectrum shows differences when compared to those calculated from the liquid state spectrum, see Table 6. In our view, these differences can be attributed to the echoes of resonance bands, which appears at distances of 12000 Hz from central isotropic chemical shift. So, for instance, a resonance signal appearing at 50 ppm, shows echoes at 170 and -120 ppm. From this point of view echoes of aliphatic carbons can contribute to the signal of aromatics, introducing errors in the quantitative relation of signals. Based on this analysis, is not possible to compare solid state NMR data with liquid state NMR data in the current experimental conditions. So, we need to introduce new experiments using a NMR probe that allows rotation rates higher than those used in conventional 4mm probes, p.e. 2.5 mm probe.
Matrix Assisted Laser Desorption Ionization Mass Spectrometry
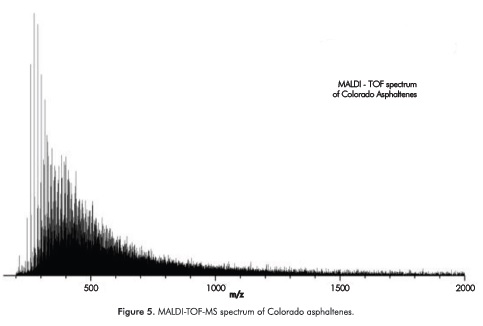
The MALDI-TOF spectrum of the Colorado asphaltenes is shown in Figure 5. From our experiments we observe that high laser energies per pulse and TOF spectra were characterized by the higher mass molecular ions coming from the desorption of dimers-, trimmers- and tetramers- of asphaltenes follow by ionization (Poveda et al, 2011), while at lower energies per pulse above the ionization threshold ions were not observed in the TOF spectra. As explained by McCarley, when anthracene is used as matrix, the laser desorption/ionization produces only a molecular radical cation at m/z 178, along with its corresponding isotope peaks (A, 100%; A + 1, 17%) (McCarley, McCarley & Limbach, 1998). At laser powers near the ionization threshold the mass spectra of anthracene are devoid of matrix-related cluster and fragment ions, which permits their use in the routine analyses of low-molecular-weight compounds (McCarley et al, 1998). As further explained by McCarley, when the anthracene-asphaltenes combinations were used, the anthracene absorb laser radiation and become photoionized C14H10+·, and ion-asphaltene molecules reactions between may result in electron-transfer reactions, yielding asphaltene molecular radical cations and neutral matrix molecules A+*. This sequence of reactions is distinctly different from the more common proton-transfer reactions between various analytes and matrices that lead to protonated analytes. The formation of analyte molecular radical cations vs protonated molecules depends on the type of matrix ions present, as well as the thermodynamic and kinetic properties of the reactants and products (McCarley et al, 1998).
Mass spectrum was processed as follows: baseline correction by peak peeking allow us to calculate the areas of peaks detected in the range from 200 to 2000 Da. Using the areas of peaks in Equations 1 and 2, the Mn and Mw were calculated as 581.03 Da and 704.89 Da, respectively. M_n and M w were used to calculate the molecular parameters together with elemental analysis (Table 1) and NMR data (Tables 5 to 7).The resolution of the R-TOF analyzer was calculated as 40000 at 500 Da peak.
X-Ray Diffraction
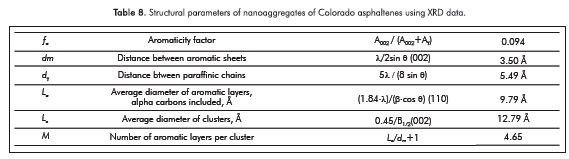
Aggregates of asphaltenes obtained from CCO were also characterized by X-ray diffraction. Measured diffraction pattern is shown in Figure 6. There, the deconvolution of the diffraction pattern shows the different bands obtained from the reflections of the ordered subunits in the asphaltenes. The three major bands γ, (002), (001), positioned 2θ of 18.6°, 25.4°, and 41.8° are due to reflections from paraffinic and aromatic structures in the asphaltenes. (002) and (001) are called graphene bands. Other bands on the high 28 side of the diffraction pattern are (004) and (110) reflections close to the 2θ of 53° and 78.4°.
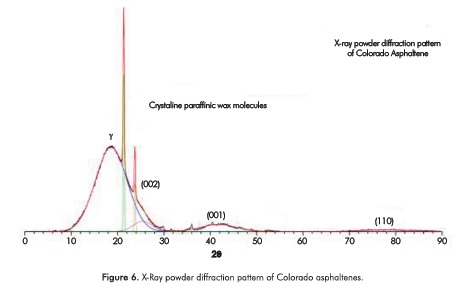
Additionally, we could observe that two reflections at 21.33 and 23.74 were detected. These two reflections correspond to crystallite paraffinic wax molecules (Andersen, Jensen & Speight, 2005). XRD data were analyzed using the method developed by Yen for the calculation of aromaticity and crystallinity parameters many years ago (Chang & Fogler, 1994). The calculation of crystallite parameters is presented in Table 8 and can be briefly summarized as follows: the area of the two main bands designated as y and graphene (002) bands are proportional to the amounts of these structures present in the sample (Yen et al., 1961). Aromaticity (ƒα) can be determined by calculating the areas (A) of the resolved peaks for y and 002 bands using the formula:
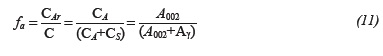
where CS, CA, and C are the numbers of saturated, aromatic, and total carbon atoms per structural unit. Unfortunately, the calculus of ƒα using XRD data is very different from that obtained using 13C-NMR spectroscopy. A summary of other structural parameters that were calculated follow the original work of Yen et al. (1961), Andersen et al. (2005) or Tanaka et al. (2004) is presented in Table 8.
Average Molecular Parameters and Model Structures
By combining elemental analysis (Table 1), average molecular weight mass spectrometry, Mn, and NMR spectroscopy (Tables 5, 6, and 7), it was possible to gather information about the molecular weight of the bulk sample using some average parameters. Some of the molecular parameters were obtained directly from quantitative data of the 1H- and 13C-NMR spectra, where the integrated signals are a representation of the amount of chemical groups in the sample. However, additional parameters can be calculated by some of the set of parameters reported in the literature (Podgorski et al., 2013; Hirsch & Altgelt, 1970; Kietetal., 1978; Ladner & Snape, 1978). Here, we use some of the parameters previously reported by Poveda and Molina (2012). The main problem observed with the procedures to calculate the average molecular parameters reported in the literature had to do with their development and the approaches taken into account for the structural analysis, thus, it is paramount to consider also the chemical nature of samples that can be analyzed using each one of them. As molecular weights increase it is common to observe higher amounts of heteroatoms.
In Tables 5, 6 and 7, it was possible to observe that some regions in the NMR spectra give the relative amount of structural groups and by combining them it was possible to collect further information on average molecular parameters. Composition by number is presented using data from mass spectrometry Mn value. But by taking account data from Raman analysis, the average diameter of aromatic unit (10.15 Å) is compatible with data from X-Ray diffraction, which is possible for aromatic units with structures identical to pyrene compound with saturated side chains of 4 and 5 carbons, also with methyl groups joined to an aromatic unit. By comparing n values reported in Table 7, we can argue that saturated chains are characterized by a little or no chain branching.
4. CONCLUSIONS
- The present work reports the first physiochemical characterization of asphaltenes of the Colombian Colorado light crude oil. Here, we use different data derived from elemental analysis, spectroscopic techniques as Infrared, Raman, and Nuclear Magnetic Resonance, Mass Spectrometry and X-ray diffraction. Evidence obtained by mass spectrometry shows that asphaltenes were characterized by the low average molecular weight and the high ratio H/C when compared to other reported data for Colombian crude. Unfortunately for our knowledge, the reported H/C ratios for Colombian asphaltenes are typical of those obtained from heavy crude oils. We have not found reports on the molecular characterization of asphaltenes obtained from Colombian light crude oils. From FTIR data, we observe that the average length of the aliphatic chains is shorter than the average length of the aliphatic chains observed in other asphaltenes. The areas in the 1H- and 13C-NMR spectra reveal that (13C-NMR, 137.0-160.0 ppm) the number of aromatic carbons substituted with saturated chains is more comparable with previous data (Poveda et al, 2014). Based on the Raman data, the diameter of the aromatic layer in asphaltenes was calculated as 10.15 Á, which is compatible with XRD data. Finally, the combination of data concerning the molecular characteristics obtained using analytical and spectroscopic techniques shows that CCO asphaltenes can be represented by a molecular unit with a central aromatic core with pendant saturated chain, four to six, with an average chain length between four and five.
ACKNOWLEDGEMENTS
The authors wish to thank Universidad Industrial de Santander for the financial support, and the analytical facilities at Parque Tecnológico de Guatiguara and Vicerrectoria de Investigaciones.
REFERENCES
Abdallah, W. A. & Yang, Y. (2012). Raman spectrum of asphaltene. Energy Fuels, 26(11), 6888-6896. [ Links ]
Altgelt, K. & Boduszynski, M. (1994). Composition and analysis of heavy petroleum fractions. New York: Marcel Dekker. [ Links ]
Andersen, S. I., Jensen, J. O. & Speight, J. G. (2005). X-ray diffraction of subtractions of petroleum asphaltenes. Energy Fuels, 19(6), 2371-2377. [ Links ]
Andreatta, G., Goncalves, C. C., Buffin, G., Bostrom, N., Quintella, C. M., Arteaga-Larios, F., Pérez, E. & Mullins, O. C. (2005). Nanoaggregates and structure-function relations in asphaltenes. Energy Fuels, 19(4), 1282-1289. [ Links ]
Asprino, O. J., Elliott, J. A. W., McCaffrey, W. C. & Gray, M. R. (2005). Fluid properties of asphaltenes at 310-530 °C. Energy Fuels, 19(5), 2026-2033. [ Links ]
ASTM D6560-12. Standard Test Method for Determination of Asphaltenes (Heptane Insolubles) in Crude Petroleum and Petroleum Products. Annual Book of ASTM Standarts, Vol 05.03, ASTM International: West Conshohocken, PA, 2012. [ Links ]
Ballard-Andrews, A., Guerra, R. E., Mullins, O. C. & Sen, P. N. (2006). Diffusivity of asphaltene molecules by fluorescence correlation spectroscopy. J. Phys. Chem. A, 110(26), 8093-8097. [ Links ]
Bellamy, L. J. (1957). The infrared spectra of complex molecules. New York: John Wiley & Sons. [ Links ]
Benkhedda, Z., Landais, P., Kister, J., Dereppe, J. M. & Monthioux, M. (1992). Spectroscopic analyses of aromatic hydrocarbons extracted from naturally and artificially matured coals. Energy Fuels, 6(2), 166-172. [ Links ]
Biktagirov, T. B., Gafurov, M. R., Volodin, M. A., Marnin, G. V, Rodionov, A. A., Izotov, V. V., Vakhin, A. V., Isakov, D. R. & Orlinskii, S. B. (2014). Electron paramagnetic resonance study of rotational mobility of vanadyl porphyrin complexes in crude oil asphaltenes: Probing the effect of thermal treatment of heavy oils. Energy Fuels, 28(10), 6683-6687. [ Links ]
Bouhadda, Y, Bormann, D., Sheu, E., Bendedouch, D., Krallafa, A. & Daaou, M. (2007). Characterization of Algerian Hassi-Messaoud asphaltene structure using Raman spectrometry and X-ray diffraction. Fuel, 86(12), 1855-1864. [ Links ]
Calemma, V., Rausa, R., D'Anton, P. & Montanari, L. (1998). Characterization of asphaltenes molecular structure. Energy Fuels, 12(2), 422-428. [ Links ]
Chang, C. L. & Fogler, S. (1994). Stabilization of asphaltenes in aliphatic solvents using alkylbenzene-derived amphipbiles. 1. Effect of the chemical structure of amphiphiles on asphaltene stabilization. Langmuir, 10(6), 1749-1757. [ Links ]
Clutter, D. R., Petrakis, L., Stenger, R. L. Jr. & Jensen, R. K. (1972). Nuclear magnetic resonance spectrometry of petroleum fractions. Carbon-13 and proton nuclear magnetic resonance characterizations in terms of average molecule parameters. Anal. Chem., 44(8), 1395-1405. [ Links ]
Coelho, R. R., Hovell, I., Monte, M. B. M., Middea, A. & De Souza, A. L. (2006). Characterization of aliphatic chains in vacuum residues (VRs) of asphaltenes and resins using molecular modeling and FTIR techniques. Fuel Process. Technol, 87(4), 325-333. [ Links ]
Delpuech, J. J., Nicole, D., Daubenfeld, J. M. & Boudel, J. C. (1985). Method to evaluate benzonaphthenic carbons and donatable hydrogens in fossil fuels. Fuel, 64(3), 325-334. [ Links ]
Dickie, J. P. & Yen, T. F. (1967). Macrostructures of the asphaltic fractions by various instrumental methods. Anal. Chem., 39(14), 1847-1852. [ Links ]
Dickinson, E. M. (1980). Structural comparison of petroleum fractions using proton and 13C n.m.r. spectroscopy. Fuel, 59(5), 290-294. [ Links ]
Ferrari, A. C. & Robertson, J. (2004). Raman spectroscopy in carbons: From nanotubes to diamond. Philos. Trans. R. Soc. A, 362(1824), 2267-2565. [ Links ]
Freed, D. E., Lisitza, N. V., Sen, P. N. & Song, Y. Q. (2007). Molecular composition and dynamics of oils from diffusion measurements. In: Mullins, O. C, Sheu, E. Y, Hammami. A. & Marshall, A. G. (Eds) Asphaltenes, heavy oils, and petroleomics. New York: Springer. 279-299. [ Links ]
Gillet, S., Delpuech, J. J., Valentin, P. & Escalier, J. C. (1980). Optimum conditions for crude oil and petroleum product analysis by carbon-13 nuclear magnetic resonance spectrometry. Anal. Chem., 52(6), 813-817. [ Links ]
Goncalves, S., Castillo, J., Fernandez, A. & Hung, J. (2004). Absorbance and fluorescence spectroscopy on the aggregation behavior of asphaltene-toluene solutions. Fuel, 83(13), 1823-1828. [ Links ]
Goual, L., Sedghi, M., Zeng, H., Mostowfi. F, McFarlane, R. & Mullins, O. C. (2011). On the formation and properties of asphaltene nanoaggregates and clusters by DC-conductivity and centrifugation. Fuel, 90(7), 2480-2490. [ Links ]
Groenzin, H. & Mullins, O. C. (1999). Asphaltenes molecular size and structure. J. Phys. Chem.A, 103(50), 11237-11245. [ Links ]
Groenzin, H. & Mullins, O. C. (2000). Molecular size and structure of asphaltenes from various sources. Energy Fuels, 14(3), 677-684. [ Links ]
Hirsch, E. & Altgelt, K. H. (1970). Integrated structural analysis. Method for the determination of average structural parameters of petroleum heavy ends. Anal. Chem., 42(12), 1330-1339. [ Links ]
Hortal, A. R., Hurtado, P., Martínez-Haya, B. & Mullins, O. C. (2007). Molecular-weight distributions of coal and petroleum asphaltenes from laser desorption/ionization experiments. Energy Fuels. 21(5), 2863-2868. [ Links ]
Hsu, C. S., Hendrickson, C. L., Rodgers, R. P., McKenna, A. M. & Marshall, A. G. (2011). Petroleomics: advanced molecular probe for petroleum heavy ends. J. Mass Spectrom., 46(4), 337-343. [ Links ]
Khadim, M. A. & Sarbar, M. A. (1999). Role of asphaltene and resin in oil field emulsions. J. Petrol. Sci. Eng., 23(3-4), 213-221. [ Links ]
Kiet, H. H., Malthotra, S. L. & Blanchard, L. P. (1978). Structure parameter analyses of asphalt fractions by a modified mathematical approach. Anal. Chem., 50(8), 1212-1218. [ Links ]
Ladner, W. R. & Snape, C. E. (1978). Application of quantitative 13C nuclear magnetic resonance spectroscopy to coal-derived materials. Fuel, 57(11), 658-662. [ Links ]
Liang, W., Que, G, Chen, Y. & Liu, C. (2000). Chemical composition and characteristics of residues of Chinese crude oils, development in petroleum science. In: Yen, T. F. & Chilingarian, G. V. Asphaltenes and asphalts. Volume 40B. Los Angele, CA. Elsevier Science, 281-304. [ Links ]
Lisitza, N. V, Freed, D. E., Sen, P. N. & Song, Y. Q. (2009). Study of asphaltene nanoaggregates by Nuclear Magnetic Resonance (NMR). Energy Fuels, 23(3), 1189-1193. [ Links ]
Liu, D., Wang, Z., Zhou, J., Deng, W, Liang, S. & Que, G. (2001). Characterization of vacuum residuals and their substitution by using FT-IR techniques. 222nd A CS National Meeting, American Chemistry Society. Symposium on General Papers Presented before the Division of Petroleum Chemistry, Chicago, USA. [ Links ]
McCarley, T. D., McCarley, R. L. & Limbach, P. A. (1998). Electron-transfer ionization in matrix-assisted laser desorption/ionization mass spectrometry. Anal. Chem., 70(20), 4376-4379. [ Links ]
McKenna, A. M., Marshall, A. G. & Rodgers, R. P. (2013). Heavy petroleum composition. 4. Asphaltene compositional space. Energy Fuels, 27(3), 1257-1267. [ Links ]
Medrignac, I., Desmaziéres, B., Terrier, P., Delobel, A. & Laprévote, O. (2004). Analysis of raw and hydrotreated asphaltenes using off-line and on-line SEC/MS coupling. International Conference of Heavy Organics Deposition. Los Cabos. [ Links ]
Mullins, O. C. (2010). The modified Yen model. Energy Fuels, 24(4), 2179-2207. [ Links ]
Mullins, O. C, Andrews, A. B., Pomerantz, A. E., Dong, C, Zuo, J. Y, Pfeiffer, T., Latifzai, A. S., Elshahawi, H., Barré, L. & Larter, S. (2011). Impact of asphaltene nanoscience on understanding oilfield reservoirs. SPE Annual Technical Conference and Exhibition. Denver. [ Links ]
Mullins, O. C, Betancourt, S. S., Cribbs, M. E., Dubost, F. X., Creek, J. L., Andrews, A. B. & Venkataramanan, L. (2007). The colloidal structure of crude oils and the structure of oil reservoirs. Energy Fuels, 21(5), 2785-2794. [ Links ]
Murgich, J., Rodriguez J. & Aray, Y. (1996). Molecular recognition and molecular mechanics of micelles of some model asphaltenes and resins. Energy Fuels, 10(1), 68-76. [ Links ]
Pironon, J., Thiery, R., Ougougdal, M. A., Teinturier, S., Beaudoin, G. & Walgenwitz, F. (2001). FT-IR measurements of petroleum fluid inclusions: methane, n-alkanes and carbon dioxide quantitative analysis. Geofluids, 1(1), 2-10. [ Links ]
Podgorski, D. C, Corilo, Y. E., Nyadong, L., Lobodin, V. V., Bythell, B. J., Robbins, W. K., McKenna, A. M., Marshall, A. G. & Rodgers, R. P. (2013). Heavy petroleum composition. 5. Compositional and structural continuum of petroleum revealed. Energy Fuels, 27(3), 1268-1276. [ Links ]
Poveda, J. C, Alvarez, I. & Cisneros, C. (2011). Multiphoton ionization of naphthalene clusters at 266 nm. Rev. Mex. Fis., 57(1), 68-74. [ Links ]
Poveda, J. C. & Molina, D. R. (2012). Average molecular parameters of heavy crude oils and their fractions using NMR spectroscopy. J. Petrol. Sci. Eng., 84-85(1), 1-7. [ Links ]
Poveda, J. C, Molina, D., Martínez, H., Florez, O. & Campillo, B. (2014). Molecular changes in asphaltenes with H2 plasma. Energy Fuels, 28(2), 735-744. [ Links ]
Qian, K., Edwards, K. E., Siski, M., Olmstead, W. N., Mennito, A. S., Dechert, G. J. & Hoosain, N. E. (2007). Desorption and ionization of heavy petroleum molecules and measurement of molecular weight distributions. Energy Fuels. 21(2), 1042-1047. [ Links ]
Qian, S. A., Li, C. F. & Zhang, P. Z. (1984). Study of structural parameters on some petroleum aromatic fractions by 1H n.m.r./i.r. and 13C, 1H-n.m.r. spectroscopy. Fuel, 63(2), 268-273. [ Links ]
Rongbao, L., Zengmin, S. & Bailing, L. (1988). Structural analysis of polycyclic aromatic hydrocarbons derived from petroleum and coal by 13C and 1H-n.m.r. spectroscopy. Fuel, 67(4), 565-569. [ Links ]
Sabbah, H., Morrow, A. L., Pomerantz, A. E. & Zare, R. N. (2011). Evidence for island structures as the dominant architecture of asphaltenes. Energy Fuels, 25(4), 1597-1604. [ Links ]
Schneider, M. H., Andrews, A. B., Mitra-Kirtley, S. & Mullins, O. C. (2007). Asphaltene molecular size by fluorescence correlation spectroscopy. Energy Fuels, 21(5), 2875-2882. [ Links ]
Sheremata, J., Gray, M. R., Dettman, H. D. & McCaffrey, W. C. (2004). Quantitative molecular representation and sequential optimization of Athabasca asphaltenes. Energy Fuel, 18(5), 1377-1384. [ Links ]
Smith, D. E, Rahimi, P., Teclemariam, A., Rodgers, R. P. & Marshall, A. G. (2008). Characterization of Athabasca bitumen heavy vacuum gas oil distillation cuts by negative/ positive electrospray ionization and automated liquid injection field desorption ionization Fourier transform ion cyclotron resonance mass spectrometry. Energy Fuels, 22(5), 3118-3125. [ Links ]
Strohalm, M., Hassman, M., Kosata, B. & Kodicek, M. (2008). mMass data miner: An open source alternative for mass spectrometric data analysis. Rapid Commun. Mass Spectrom. 22(6), 905-908. [ Links ]
Strohalm, M., Kavan, D., Novak, P., Volny, M. & Havlicek, V. (2010). mMass 3: A cross-platform software environment for precise analysis of mass spectrometric data. Anal. Chem. 82(11), 4648-4651. [ Links ]
Strausz, O. P., Mojelsky, T. W. & Lown, E. M. (1992). The molecular structure of asphaltene: an unfolding story. Fuel, 71(12), 1355-1363. [ Links ]
Tanaka, R., Sato, E., Hunt, J. E., Winans, R. E., Sato, S. & Takanohashi, T. (2004). Characterization of asphaltene aggregates using X-ray diffraction and small-angle X-ray scattering. Energy Fuels, 18(4), 1118-1125. [ Links ]
Tuinstra, F. & Koenig, J. L. (1970). Raman spectrum of graphite. J. Chem. Phys., 53(3), 1126-1130. [ Links ]
Williams, R. B. (1958). Symposium on composition of petroleum oil, determination and evaluation. ASTM Spec. Tech.Publ., 224,168-94. [ Links ]
Yen, T. F. (1972). Present status of the structure of petroleum heavy ends and its significance to various technical applications. Am. Chem. Soc. Div. Petrol. Chem. Symposium on advances in analysis of petroleum and its products, Preprints 4,17(1), 102-114. [ Links ]
Yen, T. F., Erdman, J. G. & Pollack, S. S. (1961). Investigation of the structure of petroleum asphaltenes by X-ray Effraction. Anal. Chem., 33(11), 1587-1594. [ Links ]
Yoshida, T., Maekawa, Y, Uchino, H. & Yokoyama, S. (1980). Derivation of structural parameters for coal-derived oil by carbon-13 nuclear magnetic resonance spectrometry. Anal. Chem., 52(6), 817-820. [ Links ]
Zeng, H., Song, Y. Q., Johnson, D. L. & Mullins, O. C. (2009). Critical nanoaggregate concentration of asphaltenes by Direct-Current (DC) electrical conductivity. Energy Fuels, 23(3), 1201-1208. [ Links ]
AUTHORS
Juan-Carlos Poveda-Jaramillo
Affiliation: Universidad Industrial de Santander
Chemist, Universidad Industrial de Santander
M. Sc. In Chemistry, Universidad Industrial de Santander
Ph. D. in Chemistry, Universidad Nacional Autónoma de México
e-mail: jcpoveda@uis.edu.co
Daniel-Ricardo Molina-Velasco
Affiliation: Universidad Industrial de Santander
Chemist, Universidad Industrial de Santander
M. Sc. In Chemistry, Universidad Industrial de Santander
Ph. D. in Chemistry, Universidad Industrial de Santander
e-mail: dmolina@uis.edu.co
Emiliano Ariza-León
Affiliation: Universidad Industrial de Santander
Petroleum Engineering, Universidad Industrial de Santander
M.Sc. in Hydrocarbons Engineering, Universidad Industrial de Santander
Ph. D. Candidate in Chemical Engineering, Universidad Industrial de Santander
e-mail: earizal@uis.edu.co
Natalia-Alexandra Bohorquez-Toledo
Affiliation: Universidad Industrial de Santander
Chemist, Universidad Industrial de Santander
M. Sc. In Chemistry, Universidad Industrial de Santander
e-mail: natalia_bohtol@yahoo.com
Mary-Helena Torres
Affiliation: Universidad Industrial de Santander
Chemist, Universidad Nacional del Colombia
e-mail: mhtf2000@hotmail.com
