Services on Demand
Journal
Article
Indicators
-
 Cited by SciELO
 -
 Access statistics
Related links
-
 Cited by Google
 -
 Similars in
SciELO
 -
 Similars in Google
Share
CT&F - Ciencia, Tecnología y Futuro
Print version ISSN 0122-5383
C.T.F Cienc. Tecnol. Futuro vol.6 no.3 Bucaramanga Jan./June 2016
LIFE CYCLE EMISSIONS FROM A BUS RAPID TRANSIT SYSTEM AND COMPARISON WITH OTHER MODES OF PASSENGER TRANSPORTATION
EMISIONES GENERADAS EN EL CICLO DE VIDA DE UN BUS DE TRANSITO RÁPIDO Y COMPARACIÓN CON OTROS MODOS DE TRANSPORTE DE PASAJEROS
EMISSÕES GERADAS NO CICLO DE VIDA DE UM ÔNIBUS DE TRÂNSITO RÁPIDO E COMPARATIVA COM OUTROS MODOS DE TRANSPORTE DE PASSAGEIROS
Yohen Cuéllar1; Rodrigo Buitrago-Tello1 and Luis-Carlos Belalcazar-Ceron1*
1 Departamento de Ingeniería Química y Ambiental, Facultad de Ingeniería, Universidad Nacional de Colombia, Bogotá, Colombia
e-mail: lcbelalcazarc@unal.edu.co
How to cite: Cuéllar, Y, Buitrago-Tello, R. & Belalcazar-Ceron, L. C. (2016). Life cycle emissions from a bus rapid transit system and comparison with other modes of passenger transportation. CT&F - Ciencia, Tecnología y Futuro, 6(3), 123-134.
* To whom correspondence should be addressed
(Received: Jul. 27, 2015; Accepted: Abr. 27, 2016)
ABSTRACT
This work presents Life Cycle Emissions from the Bus Rapid Transit System (BRT) TransMilenio compared to other modes of passenger transportation in Bogota, Colombia®. We applied the life-cycle assessment (LCA) and the well-to-wheels approach. We used the OpenLCA software, the Ecoinvent database and all the information available in the city to perform this LCA. The impact category climate change (C02-eq) and emissions of PM2.5, CO and NOx were considered. The functional unit is mass of pollutant per kilometer and per passenger transported (mass/km-passenger). Results of this work indicate that public transport buses including BRT produce the lowest emissions of CO2-eq, CO and NOx. While the lowest emissions of PM2.5 were achieved by an electric BRT and buses powered by natural gas. The highest emissions of PM2.5 are given by motorcycles and private cars, and taxis present the highest emissions of NOx. Finally, if TransMilenio buses change from diesel to electricity, C02-eq and PM2.5 emissions would be reduced by 86% and 88%, respectively. However, these values are lowerthan reductions achieved when strategies are focused on controlling emissions from other vehicle categories.
Keywords: Bus rapid transit. Emissions, Climate change, Air quality, OpenLCA, Biofuels, Sustainable urban transport.
RESUMEN
Este trabajo presenta las emisiones del sistema de transporte masivo (BRT) TransMilenio, en comparación con otros medios de transporte de pasajeros de Bogotá, Colombia. Se empleó la metodología Análisis de Ciclo de Vida (ACV) del pozo a las ruedas (well-to-wheels). Se usó el software OpenLCA®, la base de datos Ecoinvent y la información disponible en la ciudad. Se consideraron la categoría de impacto cambio climático (emisiones de C02-eq) y las emisiones de PM2.5, CO y NOx. Se utilizó la unidad funcional masa de contaminante por kilómetro y por pasajero transportado (masa/km-pasajero). El ACV indica que las emisiones más bajas por kilómetro-pasajero de CO2-eq, CO y NOx las genera el TransMilenio, mientras que los BRT eléctricos y los buses a gas natural tienen las menores emisiones de PM2.5. Las motocicletas generan las mayores emisiones de PM2.5, mientras que los taxis generan las emisiones de NOx. Finalmente, si los buses de TransMilenio cambiasen de diésel a electricidad las emisiones de CO2-eq, y PM2.5 se reducirían en 86% y 88%, respectivamente. Sin embargo, esta reducción es poco significativa si se compara con la reducción que se obtendría si las estrategias se enfocaran en el control de las emisiones generadas por otras categorías de vehículos.
Palabras clave: Bus de Tránsito Rápido, Emisiones, Cambio climático, Calidad del aire, OpenLCA, Biocombustibles, Transporte urbano sostenible.
RESUMO
Este trabalho apresenta as emissões do sistema de transporte em massa (BRT) TransMilenio, comparado com outros meios de transporte de passageiros de Bogotá, Colômbia. A metodologia utilizada foi a Análise do Ciclo de Vida (ACV) well-to-wheels. O software e o banco de dados utilizados foram o OpenLCA® e o Ecoinvent, respectivamente, além de outras informações disponíveis na cidade. O trabalho considerou as categorias de impacto mudança climática (emissões de C02-eq) e as emissões de PM2.5, CO e NOx. Foi utilizada a unidade funcional massa de poluente por quilômetro e por passageiro transportado (massa/km-passageiro). O ACV indica que as emissões mais baixas por quilômetro-passageiro de C02-eq, CO e NOx são geradas pelo TransMilenio, enquanto os BRT elétricos e os ônibus a gás natural têm as melhores emissões de PM2.5. As maiores emissões de PM2.5 são geradas pelas motocicletas, e as emissões de NOx são geradas pelos táxis. Finalmente, se os ônibus do TransMilenio mudassem de diesel para eletricidade as emissões de C02-eq e PM2.5 seriam reduzidas em 86% e 88%, respectivamente. No entanto, essa redução é pouco significativa quando comparada com a redução que seria conseguida se as estratégias estiveram focadas no controle das emissões geradas por outras categorias de veículos.
Palavras-chave: Ônibus de Trânsito Rápido, Emissões, Mudança Climática, Qualidade do ar, OpenLCA, Biocombustíveis, Transporte Urbano Sustentável.
1. INTRODUCTION
A Bus Rapid Transit (BRT) system is a comfortable, less expensive and flexible passenger transportation mode as compared to other modes of public transportation. BRT systems are also known as High-Capacity Bus Systems; Metro-Bus; Express Bus Systems; and Busway Systems or surface metro systems (Wright, 2002). An important feature of BRT is that it includes separate stations and terminals (Deng & Nelson, 2011; Hidalgo & Gutiérrez, 2013; Mejía-Dugand et al, 2013; Wright, 2002; Zimmerman & Levinson, 2006). One of the most popular BRT systems in the world is TransMilenio which operates in Bogota since 1999. Some of the benefits achieved by this system include: reduction of travel time, high capacity compared to other transportation systems, reductions in the accident rate and pollutant emissions (Deng & Nelson, 2011; Hidalgo et al, 2013). Due to the success of TransMilenio, this system has been replicated in other cities of the world (Deng & Nelson, 2011; Duarte & Rojas, 2012; Hidalgo & Gutierrez, 2013; Mejía-Dugand et al., 2013; Sengers & Raven, 2015; Wright & Fulton, 2005).
Vehicles powered by internal-combustion engines are an important source of air pollutants (Bergthorson & Thomson, 2014; Dryer, 2015; Kalghatgi, 2015; Turrio-Baldassarri et al., 2006); these pollutants are not only emitted by fuel combustion, but also by the production and transportation of the energy carrier (fuels, biofuels, hydrogen, among others). Life Cycle Assessment (LCA) is a methodology used to assess and compare the potential environmental impacts of the whole production or process chain. LCA assesses the potential environmental impacts associated with a product or process from resource extraction to usage; disposal; recycling or reuse (ISO 14040). LCA have been widely used as a tool for assessing the impact of various fuels and vehicle energy sources in different scenarios (Dincer & Zamfirescu, 2011; Gao & Winfield, 2012; García-Sánchez et al., 2013; Geraldes, Acevedo & Freiré, 2013; Ma et al., 2012; Martínez-González et al., 2011; Messagie et al., 2014). LCA for passenger transportation is generally called fuel cycle analysis or Well-to-Wheels (WTW) (Gao & Winfield, 2012; Messagie et al., 2014). The WTW approach is a specific LCA that typically focuses on the energy source or fuel used by the vehicles.
Although BRT is deemed a sustainable transportation system (Hidalgo et al., 2013; Sengers & Raven, 2015); there are few WTW studies including this transit system. Some studies focused on quantifying the C02 emissions (Baghini, Ismail & Hafezi, 2014; Cui et al., 2010; Wright & Fulton, 2005). These studies suggest to evaluate other pollutants as nitrogen oxides, sulfur oxides and particulate matter. Similarly; a few studies compare the WTW BRT emissions to other modes of passenger transportation. Wright and Fulton (2005) analyzed the following transportation methods: car; motorcycle; taxi; mini-bus; BRT; cycling and walking. They also calculated the economic benefits generated from the reduction of C02 equivalent emissions. Baghini et al. (2014) show that BRT offers a high potential for the reduction of greenhouse gas emissions; however, an evaluation including other pollutants is needed
This work is aimed to develop a WTW LCA for the TransMilenio BRT system (diesel-powered) and to compare it with other transportation modes used in Bogota: gasoline-powered vehicles (motorcycles; private cars and taxis); and diesel-powered vehicles (traditional buses). The open source software OpenLCA; the Eco-invent database and all the information available in the city were used to perform this WTW study. Climate change impact category and pollutant emissions (PM2.5, CO andNOx) were considered. Fossil fuels are blended with biofuels in Colombia, therefore emissions from the production and use of bioethanol and biodiesel are included in this WTW analysis. Alternatives sources of energy and fuels were evaluated for all modes of transportation (compressed natural gas and electricity). The functional units used in this WTW is grams of pollutant per kilometer and per passenger transported (g/ km.passenger).
2. METHODOLOGY
The WTW LCA was performed following the ISO 14040 and ISO 14044 standards. The impact categories considered in this study are Global Warming Potential (GWP) and PM2.5, CO and NOx emissions. The Ecoinvent database and data from different references were used to calculate the life cycle (LC) emission inventory. The software OpenLCA (Buitrago-Tello & Belalcazar, 2013; Ciroth & Winter, 2014) was used to calculate the life cycle inventory. The functional unit chosen is grams of pollutant per km-number of passenger transported (g/km.passenger).
Inventory Data Sources
Inventory data collection and the measurements for vehicle emission factors were conducted prior to or in 2012, therefore the base year for this study is 2012. In Bogotá, 93% of the fleet corresponds to gasoline vehicles (cars; motorcycles; taxis; etc.); while the rest are diesel, natural gas, LPG and electric powered vehicles. Traditional buses and BRT (diesel vehicles) represent only 1.2% of the fleet. It is important to mention here that in this city, motorcycles represent about 24% of total vehicles.
BRT buses are only 0.1% of the fleet; and almost all of them run on diesel. However, the local authority plans to replace these buses by electricity-powered buses. The gasoline sold in Bogota contains 10% of ethanol (E10 blend) and diesel contains 5% of biodiesel (B5 blend). These fuels have low content of sulfur compared to the rest of the country (300 ppm for gasoline and 50 ppm for diesel).
To develop the LCA, representative vehicles were chosen from each vehicle category. The local official database was used to make this choice. In addition, this study also considers alternative energy sources. Here we also evaluate natural gas powered vehicles (compressed natural gas); and electric vehicles which are rarely used in the city.
System Boundaries
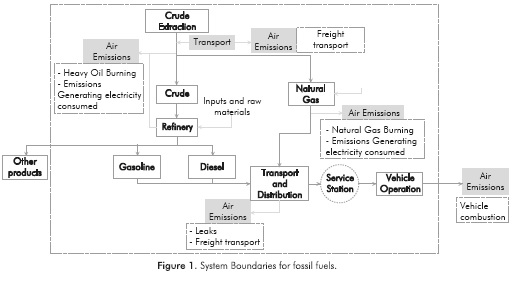
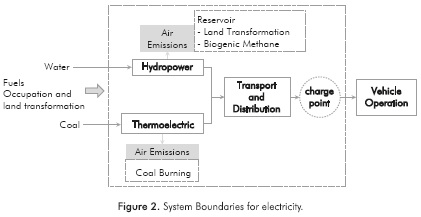
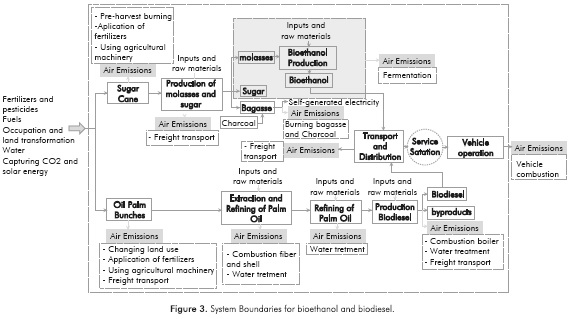
The system boundaries include the whole production chain of fossil fuels; biofuels; and electricity: extraction of raw materials; transportation; biomass cultivation; production; transportation; distribution and use in the vehicle. The systems chosen for the different energy sources are represented in Figures 1, 2 and 3.
Biofuels inventory data
The LC inventory for biofuels (bioethanol and biodiesel) was based on references (CUE, 2012). For these systems, an allocation factor was used based on the price of each sub-product in the market and the quantity produced for each subproduct per kg of biofuel (Buitrago-Tello, 2014; CUE, 2012). This study does not include the indirect land use change impact generated by the crop replacement or displacement of other activities to other regions.
Fossil Fuels inventory data
The Ecoinvent v2.2 (Swiss Centre for Life Cycle Inventories, 2010) was used to calculate the LC inventory of fossil fuels (diesel, gasoline and compressed natural gas). Information about the production of these fuels is not easily available in Colombia. Nevertheless, results obtained in this study were compared to results reported by the Colombian government. In the case of the climate change impact category, the results of this LCA were about 12% higher than the results reported by the Colombian government and thus we conclude we can use Ecoinvent to analyze other impact categories.
Electricity inventory data
Dam construction requires land occupation and transformation, besides, water storage is a source of biogenic emissions. In Colombia, emissions associated with this stage of the electricity production are not available. Therefore, the LC inventory data for the electricity production were taken from the Brazilian production modules available in the Ecoinvent v 2.2 database. (Swiss Centre for Life Cycle Inventories, 2010). These data were modified and adapted to local conditions according to the contribution of existing sources of electricity in Bogota and the region (92% hydropower and 8% thermal coal) (Subdirección de Energía Eléctrica - Grupo de Generación, 2015). Local authorities provided information about emissions from the thermoelectric operation.
Emission Factors
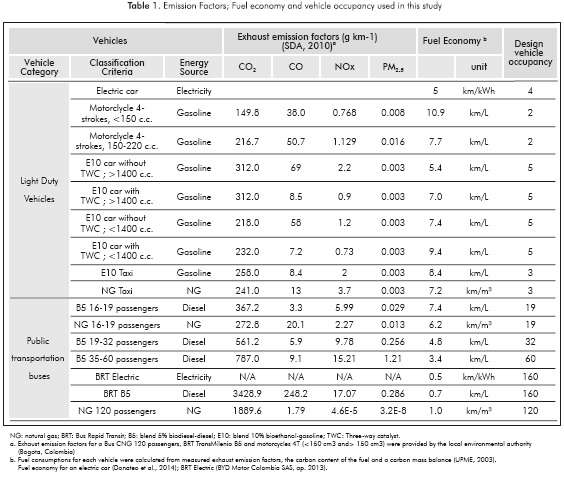
Vehicle exhaust emission factors for the different pollutants (C02; CO; NOx and PM2.5) were provided by the local environmental authority (SDA, 2010). Fuel consumptions for each vehicle were calculated from measured exhaust emission factors, the carbon content of the fuel and a carbon mass balance (UPME, 2003). (Table 1).
Vehicles Occupancy
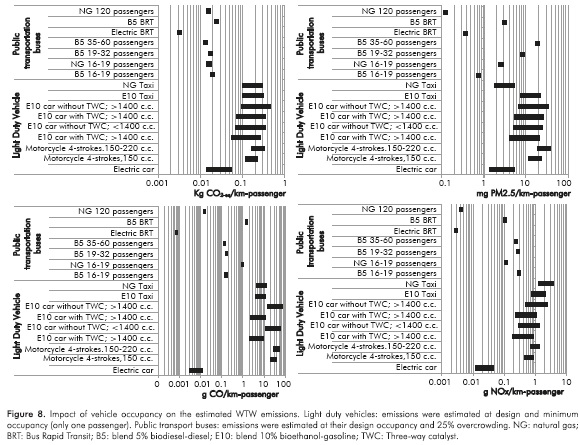
In order to compute emissions per passenger transported, it is necessary to define the number of passengers that a vehicle is able to transport (number of passengers/vehicle). Information about real occupancy is difficult to estimate and is not available in the city. Public transportation systems in Bogota are overcrowded at rush hour, the rest of the day these vehicles usually transport passengers at their design capacity. Some estimates indicate that at peak hour public buses transport 25% more passengers than their design capacity (Concejo de Bogotá D.C., 2012). In this study, we first evaluated vehicles in terms of their design capacity; this corresponds to the maximum capacity reported for each vehicle type. Vehicular occupancy in taxis approaches 3 passengers (not including driver) and the design capacity of an articulated bus from the BRT system is 160 passengers (Table 1). We also conducted a sensitivity analysis to evaluate the impact of the number of passengers transported on the results. In the case of light duty vehicles, we estimated emissions at their design and minimum occupancy (only one passenger). In the case of public transport buses, we evaluated vehicles at their design occupancy and 25% overcrowding.
3. RESULTS
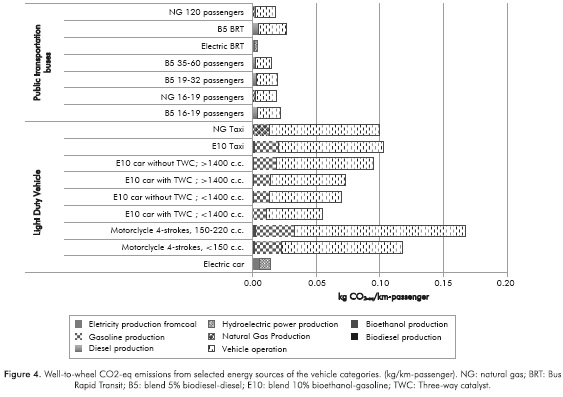
Figure 4 shows the well-to-wheel C02-eq emissions from selected energy sources/vehicle categories. This figure shows emissions in the different stages of the LCA: Electricity production from coal, Hydroelectric power, Bioethanol, Gasoline, Natural Gas, Biodiesel, Diesel production and the Vehicle operation. In this case, the functional unit is g C02-eq /1km- passenger transported at design capacity of the vehicle. Light duty vehicles are the vehicle categories that generate the highest C02-eq emissions per km- passenger transported. In this category, taxis running on gasoline (E10) and natural gas (NG) are significant. The vehicles with lower C02-eq emissions are current TransMilenio buses (BRT-TM B5) followed by traditional public service buses (bus B5). If BRT electric buses were implemented in Bogota a reduction of 86% in C02-eq would be achieved. Furthermore, the implementation of electric passenger vehicles would significantly reduce emissions from this category.
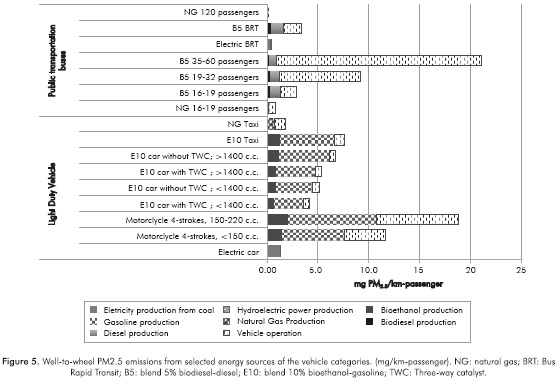
Figure 5 shows the PM2.5 emissions per km-passenger transported. In this case, the production of the energy source (electricity, fossil fuels and biofuels production) show a significant contribution for most of the light duty vehicles, reaching a maximum value of 91% of the emissions.
It is important to highlight that the main source of PM2.5 for the bioethanol production is the Sugar cane field burning before harvesting (pre-harvest burning). Motorcycles emissions are well above emissions from all vehicle categories; most of these emissions are released during the operation stage. In contrast, emissions from other light duty vehicles are released during the gasoline production stage. Buses from the traditional system are also an important source of PM2.5. Current BRT and vehicles running on natural gas are the vehicle categories that produce the lowest PM2.5 emissions. If BRT electric buses were implemented in the city, PM2.5 emissions would drop about 88%. However, much more significant reductions would be achieved if motorcycles are replaced by other modes of transportation.
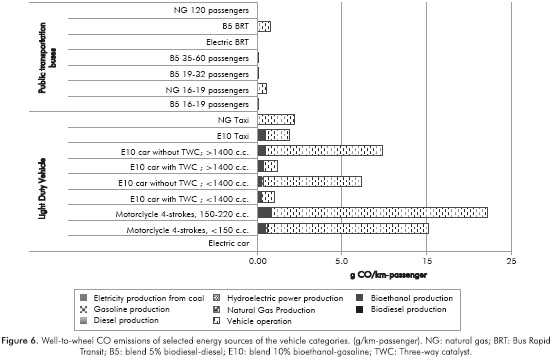
The well-to-wheel CO analysis indicates that most of the CO emissions are produced during the operation stage (Figure 6). Emissions generated in stages prior to combustion reach as much as 6% of the total. Passenger cars >1400 c.c. produce the highest CO emissions. Current BRT CO emissions are near to light duty vehicles with TWC. Electric vehicles show a significant reduction in CO emissions.
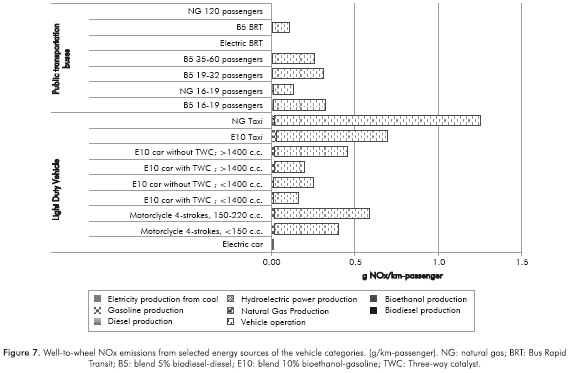
Figure 7 shows the well-to-wheel NOx emissions. In this case, most of the emissions are produced during the operation stage for all the vehicles considered. Light duty vehicles, particularly taxis running on gasoline and natural gas, produce the highest NOx emissions. It is worth noting that NG powered taxis emit more NOx than E10 taxis. Current BRT buses, generate lower NOx emission per Km per passenger. Similarly, electric vehicles also produce the lowest emissions (electricity mix 92% hydropower and 8% thermal coal).
Figure 8 shows a sensitivity analysis performed to assess the impact of vehicle occupancy on the WTW emissions. This analysis show light duty vehicles emissions are more sensitive to the number of passengers transported, public transport buses show a smaller variability and thus are less sensitive to vehicle occupancy. Light duty vehicles generate the highest emissions even if they transport passengers at their maximum capacity. Current B5 BRT is one of the vehicles that generate lower emissions. This analysis also shows that electric BRT and NG buses have the lowest level of emissions. Electric BRT emissions are even smaller than the emissions produced by an electric car.
In summary, the BRT system, NG buses and specially the electric BRT produce the lowest WTW emissions. In this case, the use of electrical vehicles represents a sizable reduction in emissions, since most of the energy provided in Colombia comes from hydropower. Recent studies report similar results (Gao & Winfield, 2012).
4. CONCLUSIONS
- In this study, a well-to-wheel LCA for the BRT system operating in Bogota was developed. We also compared this system to other modes of transportation used in the city. Results of this work indicate that light duty vehicles produce the highest emissions per kilometer and per passenger of all the pollutants considered in this study. A sizable portion of PM2.5 emissions from light duty vehicles are produced in stages prior to the vehicle operation, mostly in the gasoline and bioethanol production. However, most of the C02-eq., CO and NOx emissions are produced during the operation of the vehicle. Our results also indicate that public transport buses produce lower pollutant emissions per kilometer and passenger transported. If current BRT buses (diesel powered) are replaced by electric buses, significant reductions on pollutant emissions may be achieved (C02-eq: 86%; PM2.5: 88%; CO 99% and NOx: 97%). However, strategies should first focus on the control of light duty vehicle emissions. Emissions from these vehicles are very sensitive to vehicle occupancy, therefore an increase in vehicle occupancy may cause some emission reductions for all light duty vehicles except for motorcycles. Despite motorcycles are an affordable and convenient mode of transport, our results show that they have a significant impact on air quality and thus policymakers should control the increased use of this mode of transportation. Finally, the results of this study confirm that BRT systems are an effective and sustainable transportation method and their use should continue spreading to other cities of the world.
ACKNOWLEDGEMENTS
The author of this work would like to thank the Research group in Air Quality at Universidad Nacional de Colombia (Bogota). We also thank the program "Jóvenes Investigadores e Innovadores 2013" from Colciencias.
REFERENCES
Baghini, M. S., Ismail, A. & Hafezi, M. H. (2014). Bus Rapid Transit (BRT) system impacts to environmental quality. Res. J. Appl. Sei., Eng. Techno!., 7(7), 1158-1164. [ Links ]
Bergthorson, J. M., & Thomson, M. J. (2014). A review of the combustion and emissions properties of advanced transportation biofiiels and their impact on existing and future engines. Renew. Sust. Energ. Rev., 42: 1393-1417. doi:10.1016/j.rser.2014.10.034. [ Links ]
Buitrago-Tello, R. (2014). Evaluación de los efectos ambientales de la gasolina, diesel, biodiesel y etanol carburante en Colombia por medio del Análisis de Ciclo de Vida. Tesis de Maestría. Ing. Química y Ambiental. Universidad Nacional de Colombia. Bogotá. 81pp. [ Links ]
Buitrago-Tello, R. & Belalcázar, L. C. (2013). Análisis del ciclo de vida para la producción de bioetanol en Colombia por medio de OpenLCA. Epsilon, 21: 145-156. [ Links ]
BYD Motor Colombia SAS. (n.d.). BYD100% Buses Eléctrico para Transporte Masivo. Bogotá D.C.: BYD Motor Colombia SAS. Retrieved from http://www.transmilenio.gov.co/sites/default/files/byd_buses_electricos_articulado_.pdf. [ Links ]
Ciroth, A. & Winter, S. (2014). OpenLCA 1.4 overview and first steps. Berlin: GREENDELTA. Retrieved from http://www.openlca.org/documents/14826/0/openLCA_l+4_overview_and_first_teps_v1.pdf. [ Links ]
Concejo de Bogotá D.C. Proyecto de acuerdo 161 de 2012 (2012). Bogotá D.C. Retrieved from http://www.alcaldiabogota.gov.co/sisjur/normas/Normal.jsp?i=47995. [ Links ]
CUE. (2012). "Evaluación del ciclo de vida de la cadena de producción debiocombustibles en Colombia". Capitulo II: Estudio AC V - Impacto Ambiental. In Evaluación del ciclo de vida de la cadena de producción de biocombustibles en Colombia (p. 203). Medellín: BID, Banco Interamericano de Desarrollo Mmec, Ministerio de Minas y Energía República de Colombia. [ Links ]
Cui, S., Niu, H., Wang, W., Zhang, G., Gao, L. & Lin, J. (2010). Carbon footprint analysis of the Bus Rapid Transit (BRT) system: A case study of Xiamen City. Int. J. Sust. Dev. World, 17(4), 329-337. doi: 10.1080/13504509.2010.490657. [ Links ]
Deng, T. & Nelson, J. D. (2011). Recent developments in bus rapid transit: A review of the literature. Transport Rev., 31(1), 69-96. doi:10.1080/01441647.2010.492455. [ Links ]
Dinçer, I. & Zamfirescu, C. (2011). Life-Cycle Assessment. In Springer (Ed.), Sustainable Energy Systems and Applications (pp. 663-700). Chapter 15 New York. doi:10.1007/978-0-387-95861-3. [ Links ]
Donateo, T., Ingrosso, R, Licci, F. & Laforgia, D. (2014). A method to estimate the environmental impact of an electric city car during six months of testing in an Italian city. J. Power Sources, 270: 487-498. doi:10.1016/j. jpowsour.2014.07.124. [ Links ]
Dryer, F. L. (2015). Chemical kinetic and combustion characteristics of transportation fuels. P. Combust. Inst., 35(1), 117-144. doi:10.1016/j.proci.2014.09.008. [ Links ]
Duarte, F. & Rojas, F. (2012). Intermodal connectivity to BRT : A comparative analysis of Bogotá and Curitiba. JPT, 15(2), 1-18. Retrieved from http://www.nctr.usf.edu/wp-content/uploads/2012/07/JPT15.2Duarte.pdf. [ Links ]
Gao, L. & Winfield, Z. C. (2012). Life cycle assessment of environmental and economic impacts of advanced vehicles. Energies, 5(12), 605-620. doi:10.3390/en5030605. [ Links ]
García-Sánchez, J. A., López-Martínez, J. M., Lumbreras-Martín, J., Flores-Holgado, M. N. & Aguilar-Morales, H. (2013). Impact of Spanish electricity mix, over the period 2008-2030, on the Life Cycle energy consumption and GHG emissions of electric, hybrid diesel-electric, fuel cell hybrid and diesel bus of the Madrid Transportation System. Energ. Convers. Manage., 74: 332-343. doi:10.1016/j. enconman.2013.05.023. [ Links ]
Geraldes, É., Acevedo, H. & Freiré, F. (2013). Greenhouse gas intensity of palm oil produced in Colombia addressing alternative land use change and fertilization scenarios. Appl. Energy, 114:958-967. doi:10.1016/j.apenergy.2013.09.010. [ Links ]
Hidalgo, D. & Gutiérrez, L. (2013). BRT and BHLS around the world: Explosive growth, large positive impacts and many issues outstanding. Res. Transport. Econ., 39(1), 8-13.doi:10.1016/j.retrec.2012.05.018. [ Links ]
Hidalgo, D., Pereira, L., Estupiñán, N. & Jiménez, P. L. (2013). TransMilenio BRT system in Bogota, high performance and positive impact - Main results of an ex-post evaluation. Res. Transport. Econ., 39(1), 133-138. doi:10.1016/j.retrec.2012.06.005. [ Links ]
ISO 14040:2006. Environmental management - Life Cycle Assessment - Principles and framework. Ginebra: ISO. [ Links ]
ISO 14044:2006. Environmental management - Life Cycle Assessment - Requirements and guidelines. Ginebra: ISO. [ Links ]
Kalghatgi, G. T. (2015). Developments in internal combustion engines and implications for combustion science and future transport fuels. Proceedings of the Combustion Institute, 35(1), 101-115. doi:10.1016/j.proci.2014.10.002. [ Links ]
Ma, H., Balthasar, E, Tait, N., Riera-Palou, X. & Harrison, A. (2012). A new comparison between the life cycle greenhouse gas emissions of battery electric vehicles and internal combustion vehicles. Energy Policy, 44:160-173. doi:10.1016/j.enpol.2012.01.034. [ Links ]
Martínez-González, A., Casas-Leuro, O. M., Acero-Reyes, J. R. & Castillo-Monroy, E. E (2011). Comparison of potential environmental impacts on the production and use of high and low sulfur regular diesel by life cycle assessment. CT&F- Ciencia, Tecnología y Futuro, 4(4), 123-136. [ Links ]
Mejía-Dugand, S., Hjelm, O., Baas, L. & Ríos, R. A. (2013). Lessons from the spread of Bus Rapid Transit in Latin America. J. Clean. Prod., 50: 82-90. doi:10.1016/j. jclepro.2012.11.028. [ Links ]
Messagie, M., Boureima, E S., Coosemans, T., Macharis, C. & Mierlo, J. V. (2014). A range-based vehicle Life Cycle Assessment incorporating variability in the environmental assessment of different vehicle technologies and fuels. Energies, 7(3), 1467-1482. doi:10.3390/en7031467. [ Links ]
SDA. (2010). Plan Decenal de Descontaminación del Aire para Bogotá. Bogotá D.C. Retrieved from http://ambientebogota.gov.co/en/c/document_library/get_file?uuid=b5f3e23f-9c5f-40ef-912a-51a5822da320&groupld=55886. [ Links ]
Sengers, F. & Raven, R. (2015). Toward a spatial perspective on niche development: The case of Bus Rapid Transit. EIST, 17:166-182. doi:10.1016/j.eist.2014.12.003. [ Links ]
Subdirección de Energía Eléctrica - Grupo de Generación. (2015). Informe mensual de variables de generación y del mercado eléctrico colombiano - Enero de 2015 (p. 16). Retrieved from http://www.siel.gov.co/portals/0/generacion/2015/Seguimiento_Variables_Enero_2015.pdf. [ Links ]
Swiss Centre for Life Cycle Inventories. (2010). Ecoinvent data v2.2. Retrieved October 10, 2014, from http://wwwecoinvent.org/. [ Links ]
Turrio-Baldassarri, L., Battistelli, C. L., Conti, L., Crebelli, R., De Berardis, B., Iamiceli, A. L., Gambino, M. & Iannaccone, S. (2006). Evaluation of emission toxicity of urban bus engines: compressed natural gas and comparison with liquid fuels. Sci. Total Environ., 355(1-3), 64-77. doi: 10.1016/j.scitotenv.2005.02.037. [ Links ]
UPME. (2003). FACTORES DE EMISIÓN DE LOS COMBUSTIBLES COLOMBIANOS (FECOC). SIAME - Sistema de Información Ambiental Minero Energético. Retrieved from http://www.siame.gov.co. [ Links ]
Wright, L. (2002). Bus Rapid Transit. In K. Fjellstrom (Ed.), Sustainable Transport: A Sourcebook for Policy-makers in Developing Cities (p. 48). Eschborn, Germany: Deutsche Gesellschaft fur Technische Zusammenarbeit (GTZ). Retrieved from http://discovery.ucl.ac.uk/112/l/BRT_e-book.pdf. [ Links ]
Wright, L. & Fulton, L. (2005). Climate change mitigation and transport in developing nations. Transport Rev., 25(6), 691-717. doi:10.1080/01441640500360951. [ Links ]
Zimmerman, S. & Levinson, H. (2006). The facts about BRT. Planning, 72(5), 34-35. [ Links ]
AUTHORS.
Yohen Cuellar-Álvarez.
Affiliation: Universidad Nacional de Colombia
Chemical Engineer, Universidad Nacional de Colombia
M.Sc in Environmental Engineering, Universidad Nacional de Colombia.
e-mail: ycuellara@unal.edu.co
Rodrigo Buitrago-Tello
Affiliation: Universidad Nacional de Colombia.
Chemical Engineer, Universidad de America.
M.Sc in Chemical Engineering, Universidad Nacional de Colombia.
e-mail: rbuitragot@unal.edu.co
Luis-Carlos Belalcazar-Ceron.
Affiliation: Universidad Nacional de Colombia.
Chemical Engineer, Universidad de America.
M.Sc in Civil Engineering, Universidad de los Andes.
PhD in Environmental Engineering, Swiss Federal Institute of Technology - EPFL.
e-mail: lcbelalcazarc@unal.edu.co


