


 English (pdf)
 Article in xml format
 Article references
 Send this article by e-mail
 Cited by SciELO
  Cited by Google
  Similars in
SciELO
Similars in
SciELO  Similars in Google
 Permalink
1. INTRODUCTION
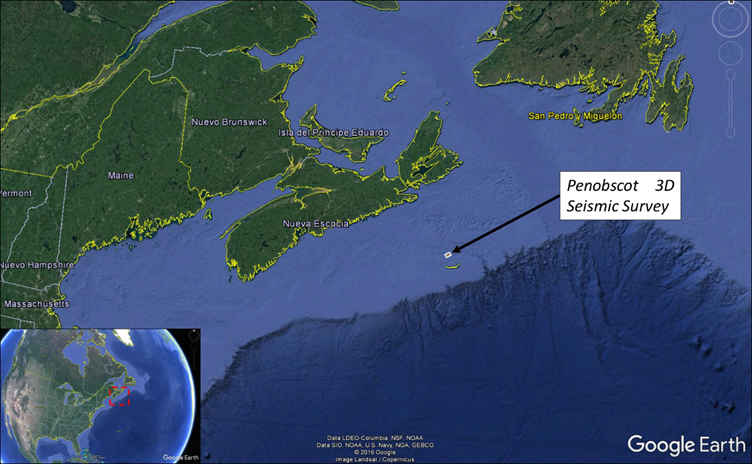
The study area is Located in Offshore East Canada, more specifically in the Nova Scotia Basin (Figure 1). Now, extended works have improved understanding of the Nova Scotia basin since the 1960s [2] - [3], in order to find the most profitable plays. In this context, approximately 180 exploration wells have been drilled on the shelf of the Scotian basin [3], as well an another eight wells on the slope [4]. Most of the discoveries made on the Scotian Shelf relate mainly to gas or condensate [3]. These discoveries have been principally encountered in the Cretaceous and Jurassic Formations in the Scotian Basin [5]. The main target of this paper is the Banquereau Formation, which is a Late Cretaceous to early Quaternary stacked series of prograding sequences that downlap unconformably onto the Wyandot Formation [6].
The geology and stratigraphy of the Scotian Shelf and the Sable Sub-basin have been described in several papers [6]-[9], but due to the lack of prospectivety for hydrocarbons, little attention has been paid to the structure of the Banquereau Formation, its implications for paleogeography and relative sea level [10]. Mclver [6] described the main lithologies of the Banquereau Formation as mainly mudstone with few intervals of silt and argillaceous sandstone, which is found in increasing amounts in the upper half of the Formation. In this context, Mclver [6] also stated that the mudstone of the Banquereau Formation is commonly burrowed or highly reworked. On the other hand, the sandstone of the Banquereau Formation is very fine to fine grained and is finely laminated with channel features identifiable in the upper portion of the Formation [6]. Mclver [6] also described the lithology of this Formation in detail, but, due to poor well control at the time of publication, this paper does not mention the internal geometry of the Banquereau Formation. Fensome et al. [8] describes the lithology of the Banquereau Formation as sandstone deposited at the topsets of clinoforms, with mudstone fore- and -bottomsets. Fensome et al. [8] also states that the lower interval of the Banquereau Formation is comprised of "prograding deltaic clinoform units that built basinward" [10].
While most of the previous work done on the Banquereau Formation was based on limited information (well-logs separated from seismic data), the scope of this paper is to show how the integration of these sorts of information through different advanced geological and geophysical data interpretation techniques led to the generation of a robust sequence stratigraphy model that accounts for the characterization of the submarine channels and valleys found in the Penobscot Block (Figure 1), more specifically in the Banquereau prograding Tertiary delta complex.
2. THEORETICAL FRAME
All the reported Formations of the Sable Sub-basin are shown on the stratigraphic column in Figure 2. In chronological order, the Formations are Abenaki, Mississauga, Logan Canyon, Dawson Canyon, Wyandot and Banquereau. Abenaki Formation is Jurassic in age, while Mississauga, Logan Canyon, Dawson Canyon, and Wyandot Formations are all from the Cretaceous. Banquereau Formation is Late Cretaceous to early Quaternary in age [13]. Mississauga Formation is mainly sandstone with some minor shale beds. This Formation is commonly broken into an Upper and Lower unit, with the "Base O-Marker". The member Base O-Marker is a regional stratigraphically correlatable unit, which is easy to identify on seismic data and comprises mainly sandstone, minor carbonates and shale [14]. Mississauga Formation can broadly be defined as comprising fluvio-deltaic sediments [15]. Logan Canyon Formation has several members with variable percentages of sandstone and shale, but the main component is a thick shale succession, interpreted as a marine transgression above the Mississauga Formation [15]. Dawson Canyon Formation is mainly shale, while Wyandot Formation is chalk-dominated, highly bioturbated, with minor amounts of marl and shale [13]. In fact, paleontological evidence indicates there is a hiatus associated with the top of the Wyandot Formation [6] above which lies the Banquereau Formation. As mentioned before, Banquereau Formation is mudstone dominated, with minor amounts of siltstone and sandstone in a prograding series of clinoforms [6], [8].
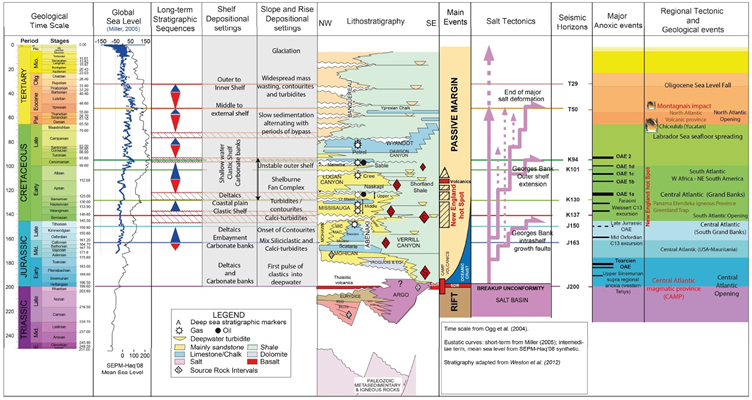
Figure 2 Generalized stratigraphic column for the Sable Sub-basin (Modified and updated from [11] and [12]).
According to Wach and Mosher [16], Cretaceous sediments and the entire Cenozoic sedimentary succession above the Wyandot are designated the Banquereau Formation [6]. Marine shelf mudstones, sandstones and conglomerates of the Banquereau Formation were influenced throughout the Cenozoic by several major unconformities related to sea level fall [16]. Unconformities are noted during the Paleocene, Oligocene and Miocene intervals where fluvial and deep-water currents eroded largely unconsolidated sediments, subsequently depositing them on the abyssal plain [7],[17]. Winnowing and reworking of deep-water sediment by bottom currents began in the Oligocene [18],[19], providing the earliest evidence of thermohaline circulation. Sediment distribution of Miocene successions were strongly influenced by the Western Boundary Undercurrent with periods of intensified bottom current activity also occurring in the Late Pliocene [19], [20], followed by widespread gully cutting in the Early Pleistocene. During the Quaternary to recent, several hundred meters of glacial and marine sediment were deposited on the outer shelf and slope [7],[17]-[22]. Wach and Mosher [16] also argues that on the Scotian Shelf and Grand Banks, the widespread hiatus eroding either the upper part or all of the Oligocene is marked by a regional unconformity; the nature of which includes canyon formation. Canyon incision at the shelf edge initiated during the Eocene and was extensive by the Oligocene [8]. Pe-Piper and Piper [23] noted that although Oligocene strata are absent on the Scotian Shelf and Grand Banks, they are present both on the Labrador Shelf [24] and on the New Jersey margin where small hiatuses are correlated with the global eustatic 1987 sea-level curve of Haq [25], [26]-[28]. Wade and MacLean [29] attributed the missing Oligocene strata on the eastern Scotian Shelf to a broad southeasterly- trending canyon associated with a sea-level Lowstand, although Grist and Zentilli [30] argued for thermal inversion in the Late Cretaceous to Early Cenozoic, based on results from apatite fission track analysis.
3. EXPERIMENTAL DEVELOPMENT
In this paper, a stratigraphic sequence model, as defined by Catuneanu, Hancox, Cairncross, and Rubidge [31] (Figure 3), will be used to generate all the sequence stratigraphic analysis and to build a system tracts model.
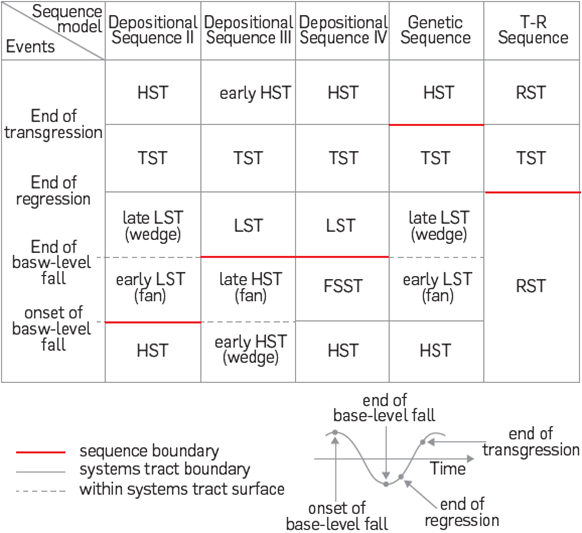
Figure 3 Timing of system tracts and sequence boundaries for the sequence models currently in use. (Modified from [31]).
The principal data of this study is a high-quality 3D PSTM from the Penobscot block, located in Nova Scotia Offshore of Canada (Figure 4). The dataset consists of 2 wells with a set of well logs, time to depth tables for the seismic well tie process and the seismic volume mentioned previously (Figure 4). Figure 5 shows the workflow applied to the dataset to obtain the final model. All steps and partial results are illustrated and briefly described in the following sections. It is worth mentioning that this study was conducted in a non-prospective interval. Nevertheless, this methodology may be applied to seismic surveys that image similar geological features. All dataset interpretation was performed in Petrel & Opendtect software packages.
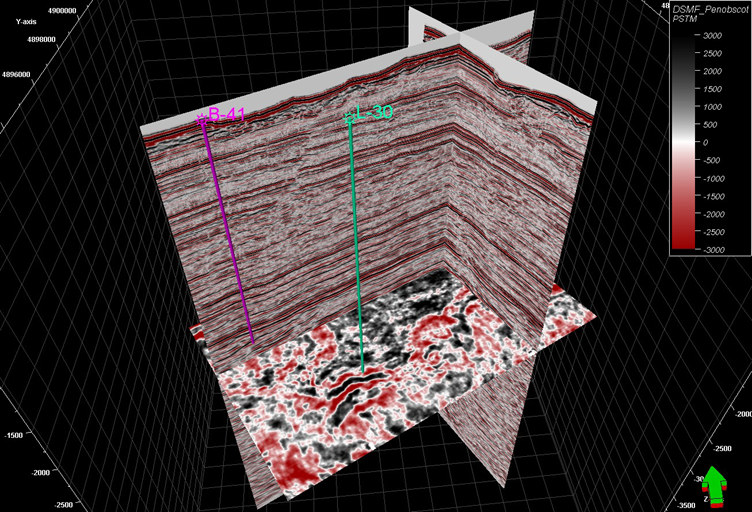
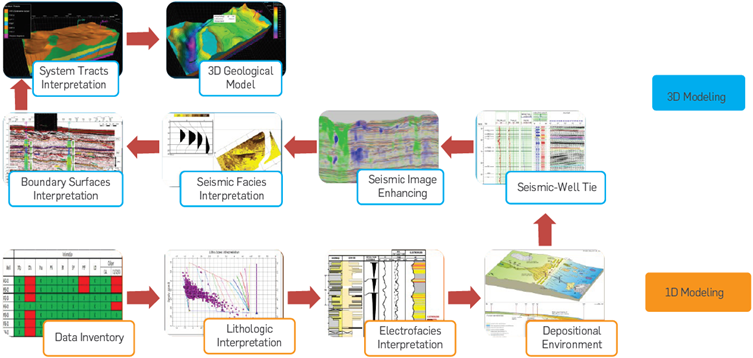
Figure 5 Workflow applied to transform petrophysical and geophysical information into a 3D geological model.
WELL-LOG INTERPRETATION
Following the workflow illustrated in Figure 5, data processing began with well log data interpretation. Figure 6 illustrates the available well logs for one of the correlation wells (Gamma ray [GR], P-Sonic [DTp] and Deep resistivity [ILD]). The first step in the well log interpretation was the definition of the Vshale model, following Asquith and Krygowski [32], using the Gamma ray [GR] and the Equation 1. In this context, Figure 8 illustrates the resulting Vshale model. The next step involved the interpretation of the facies model based on both the Vshale model defined in this study and neural networks as proposed by Bhatt and Helle [33]. By using neural networks, one can associate as many well log properties as there are available, thus finding clusters of points in a crossplot that share similar ranges of the rock properties used as input data. Therefore, one of the clusters defined during the application of neural networks in classification mode would represent a specific lithology with a given range of porosity, shale fraction, density, P-wave etc.
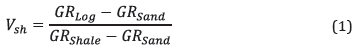
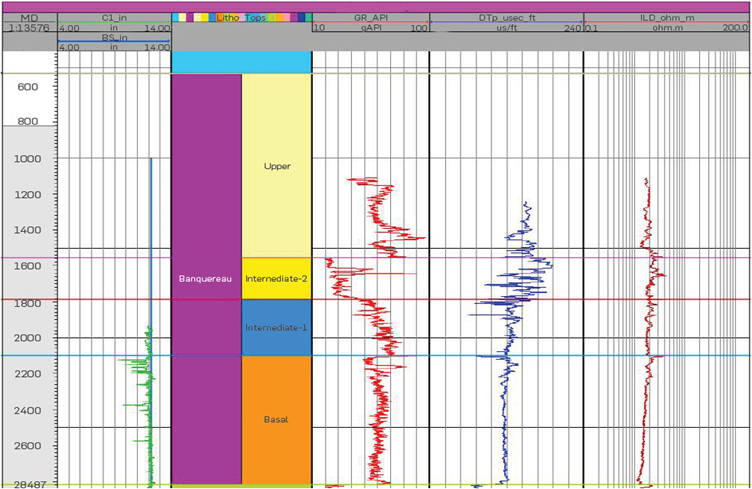
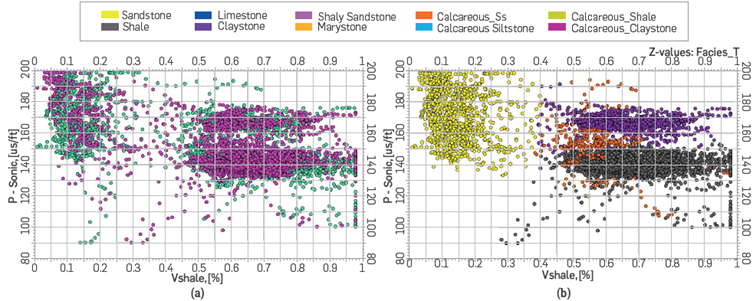
Figure 7 Final crossplot for the facies modeling obtained by applying neural networks and Vshale. Crossplot (a) shows the range of values of Vshale and P-sonic and crossplot (b) illustrates the facies classification for Banquereau Formation.
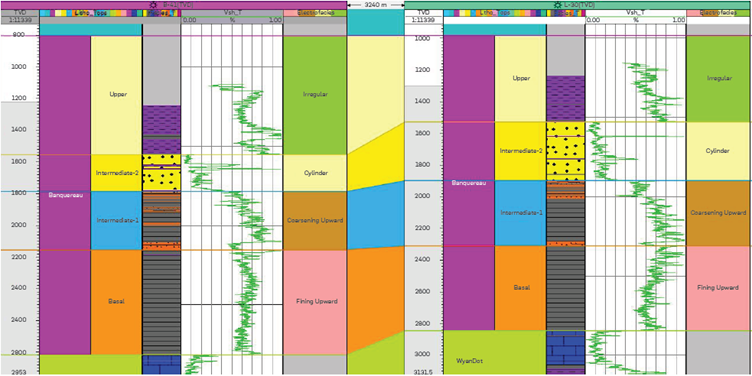
Additionally, the classification of different types of claystone may also be performed by applying neural networks. Figure 7 shows the resulting crossplot of the facies modeling where 3 different LithoLogies were interpreted as sandstone, claystone and shale. Figure 7 shows the ID facies model in the correlation wells along with the Vshale model proposed.
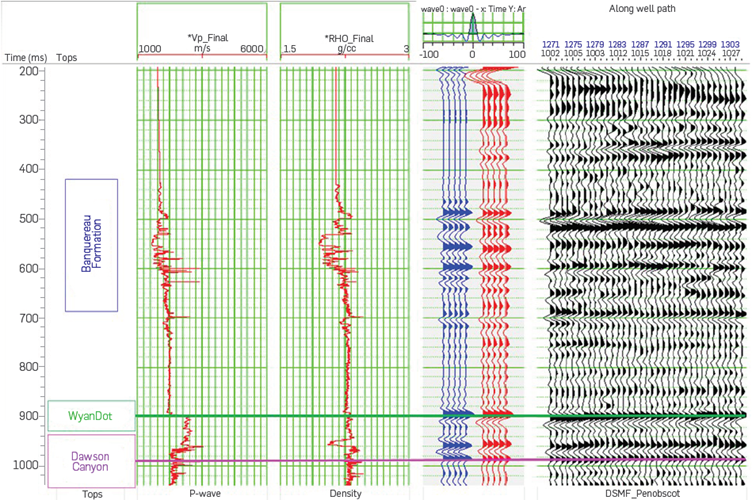
Once the ID facies and Vshale model were generated the electrofacies were interpreted, enabling the definition of the sedimentary environments per interval, which correlates with the facies model defined herein (Figure 8). Now, with the sedimentary environments interpreted, the next step was to carry all the nformation from the ID models to the 3D scenario. In order to achieve that, seismic-well tie was performed in the correlation wells using the P-Sonic [DTp] and Density [RHOB] logs available. Figure 9 shows the resulting synthetic seismogram from which the depth-time model was obtained to take the ID stratigraphic information generated (facies, electrofacies and sedimentary environments) to the 3D seismic information
SEISMIC IMAGE ENHANCEMENT & INPUT DATA FOR SEQUENCE STRATIGRAPHIC INTERPRETATION
After tying the correlation wells to the seismic, the interpretation of the 3D seismic data began with enhancement of the seismic mage. This process included reflector relative dip estimation and the enhancement of reflector continuity. Based on the reflector relative dip attribute known as Dip Steering (which was calculated using Opendtect) an amplitude filter (Dip Steered Median Filter, DSMF) was applied to the original PSTM image so that the reflector continuity could be enhanced [34] (Figure 10) and thus facilitate the manual interpretation of stratigraphic surfaces. In this context, using the methodology proposed by Odoh, llecgukwu and Okoli [34], a fault enhancement filter (FEF) was also applied so that the fault surfaces could be easily interpreted using geometric seismic attributes based on the result of this fault filter (Figure 11). Following the manual interpretation of the main stratigraphic surfaces and faults in the entire seismic volume, a set of about 240 horizons were automatically tracked in the interval of analysis using the main unconformity horizons and faults as constraints. These horizons neatly follow the reflectors and therefore represent timelines that will be used in the following steps. It is worth mentioning that this set of horizons is truncated if they approach each other up to a certain distance defined by the interpreter, therefore making it even easier to interpret stratigraphic features such as sub-aerial unconformities.
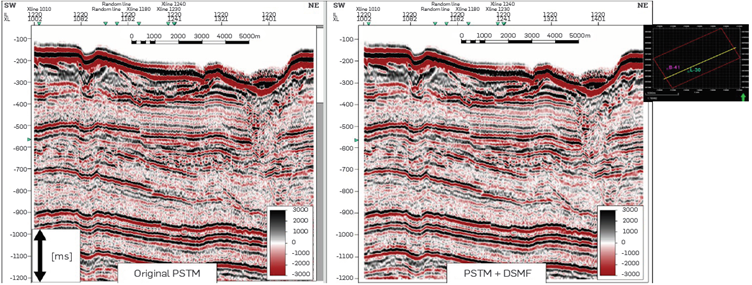
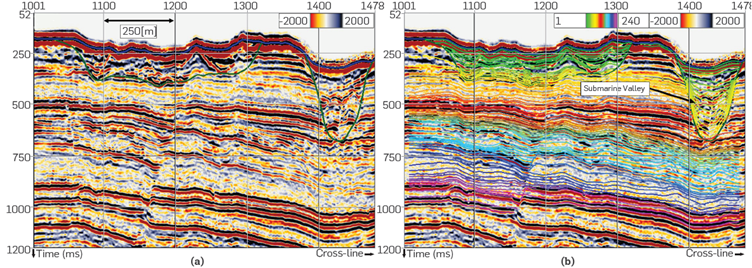
Figure 10 Comparison between the original PSTM image (left) and the enhanced PSTM image (right) using the Dip Steered Median Filter (DSMF).
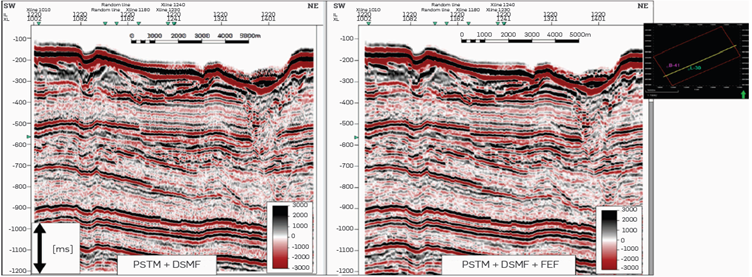
Figure 11 Comparison between the DSMF image (left) and the FEF (right) using the Dip Steered Median Filter (DSMF).
This 3D horizons framework, combined with attributes such as thickness variations, make it possible to define time attributes for the bounding surfaces.
Using both the enhanced seismic data and the 3D horizons framework it is possible to interpret the paleo-geomorphology of the entire seismic volume and identify stratigraphic features such as erosional events, non-depositional hiatuses [35], submarine channels, debris flows and most importantly turbidites. Figure 12 illustrates the enhanced seismic image and the corresponding 3D horizons framework for an Inline of the seismic survey. The prograding delta deposited during the late Cretaceous and Tertiary is incised by recent submarine channels and valleys, which is adequately represented by the horizons framework generated in this study.
4. RESULT
SEQUENCE STRATIGRAPHIC INTERPRETATION
Based on the horizons framework, the corresponding reflector terminations and seismic facies interpretation (Figure 13), a complete set of stratigraphic surfaces was defined that was Later used to interpret the systems tracts (Figure 14). Using the stratigraphie surfaces and the reflector terminations defined in Figure 14, the seismic data was transformed to Wheeler domain where erosion events and non-deposition hiatus were interpreted (Figure 15). The wheeler diagram, together with the well-log interpretation, made it possible to interpret the system tracts associated with each interval and to propose a base level curve for the study area (Figure 16).
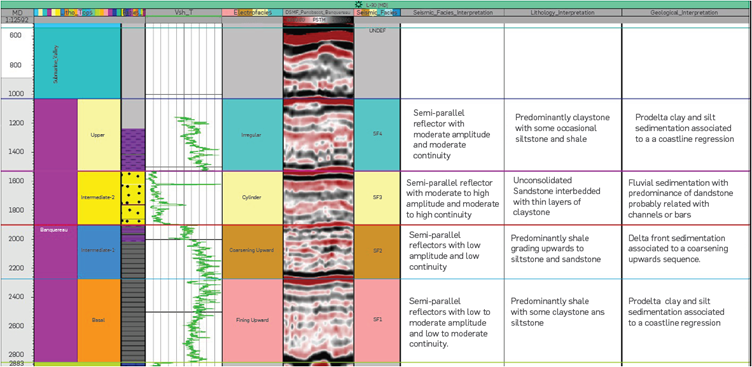
Figure 13 ID Facies model, electrofacies and seismic facies defined for one of the correlation wells.
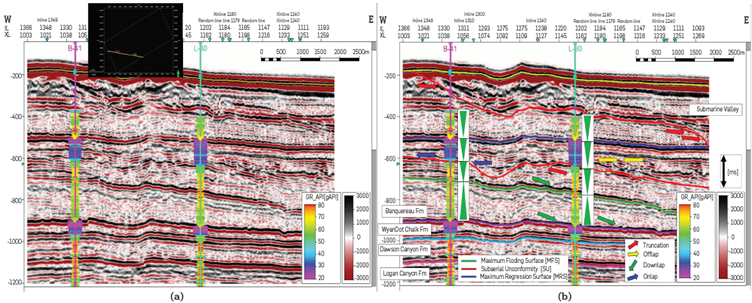
Figure 14 (a) Arbitrary seismic line extracted from the seismic volume showing the correlation wells, (b) Stratigraphic surfaces associated to reflector terminations.
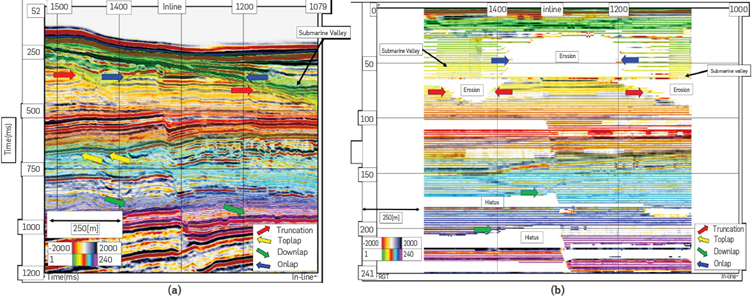
Figure 15 Wheeler domain along with the horizon framework on Xline 1258. The image (a) illustrates the enhanced seismic image with the horizon framework and image (b) shows its corresponding Wheeler diagram interpreted.
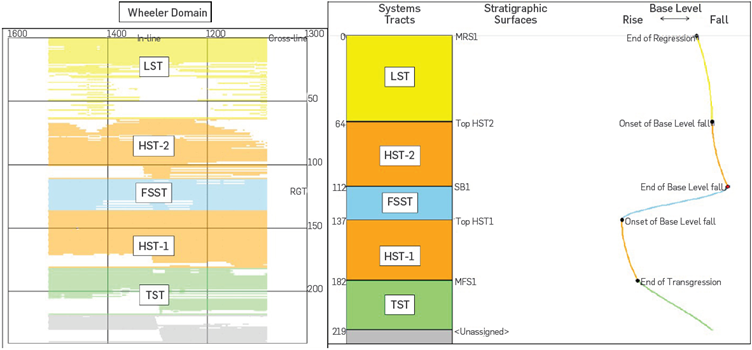
Figure 16 Wheeler domain along with the system tract interpretation and the base level change curve.
Following the interpretation of the base level curve, system tracts were interpreted in the entire 3D seismic survey, thus creating a 3D sequence stratigraphic model calibrated with well log information (Figure 17). In Figure 14 (b), from bottom to top, it can be seen that the package bounded by the purple (WyanDot Chalk Fm) and the Light green surfaces show a downlapping stacking pattern, which can also be seen in the Wheeler domain (Figure 15). It can also be seen that, in the correlation wells, the purple surface represents the top of the WyantDot Chalk Formation and on top of it there are fining upward electrofacies associated with the base of the Banquereau Formation (Figure 13). Therefore, the light green surface represents the end of the transgression and so it is interpreted as a maximum flooding surface [MFS], This package also corresponds to a set of prograding clinoforms with a gentle dip that downlaps the WyantDot Chalk Formation. Additionally, this package consists of semi-parallel reflectors with low to moderate amplitude and low to moderate continuity, which was interpreted as seismic facies 1 (SF1, Figure 13). This package is bounded at the bottom by the previous sequence and atthe top by the Maximum Flooding Surface [MFS] (Figure 14 & Figure 16). According to the stacking patterns and all the features just mentioned, this package is interpreted as a Transgressée System Tract [TST] (Figure 16).
The overlying package, between the light green and red surfaces, is characterized by downlapping reflectors of a prograding set of clinoforms overlying the MFS. These prograding clinoforms are being truncated at the top by an erosional surface (Figure 14). Moreover, this package consists of semi-parallel reflectors with low amplitude and low continuity, which was interpreted as seismic facies 2 (SF2) and also exhibits coarsening upwards electrofacies in the correlation wells (Figure 13). This package was interpreted as a Highstand System Tract [HST] and is bounded at the bottom by a Maximum Flooding Surface [MFS] and at the top by a Sub-aerial Unconformity (SU) (Figure 14).
The next package, between the red and dark blue horizons, consists of semi-parallel reflectors with moderate to high amplitude and moderate to high continuity, and was interpreted as seismic facies 3 (SF3, Figure 13). This package consists of a set of offlap and onlap reflectors that exhibit prograding and aggrading stacking patterns, which together result in a forced regression of the coastline. This is an indicator of two important changes in the base level which are the end of base level rise and the beginning of the base level fall. Based on the offlap and onlap reflector terminations and the prograding stacking patterns, it was inferred that during the early stages of sedimentation of this package the accommodation space is utterly consumed by the sedimentation rate, thus creating a regression of the coastline and progradation of fluvial and nearshore facies, which is common in early stages of base level fall and is supported by the electrofacies interpreted in the correlation wells (Figure 13). This package was interpreted as a Falling Stage System Tract [FSST] (Figure 16) and is bounded at the bottom by a Sub-aerial Unconformity (SU) and at the top by the Maximum Regression Surface [MRS] (Figure 14).
For the following package, between the dark blue and the red surfaces, it can be seen in the Wheeler domain (Figure 15) that the clinoforms start retrograding, which means that the base-level is rising again. Moreover, this package consists of semi-parallel reflectors with moderate amplitude and moderate continuity, which was interpreted as seismic facies 4 (SF4) and also exhibits an irregular electrofacies sequence in the correlation wells (Figure 13). This package was interpreted as a HST based on the characterization mentioned previously.
The youngest package interpreted in this section, between the red and sea floor surfaces, relates to a prograding stacking pattern which is being incised by a prominent submarine valley that eroded down to the last HST. This package consists of semi-parallel reflectors with moderate to high amplitude and moderate to high continuity, which was interpreted as seismic facies 3 (SF3). Additionally, this package is characteristic as it exhibits truncation reflector termination and submarine channel sedimentation (purple dashed lines in Figure 18). Based on the aforementioned description, this package was interpreted as a LST.
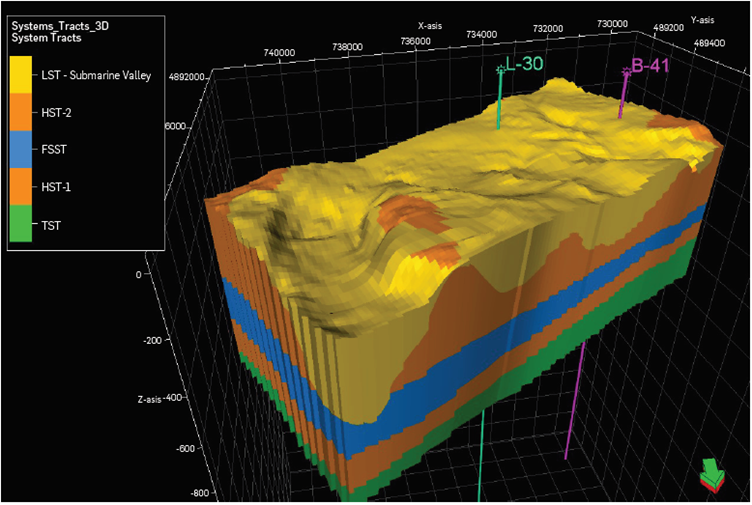
Figure 17 3D System tracts model interpreted in the 3D survey. This model is in the time domain and has a vertical exaggeration of 20.
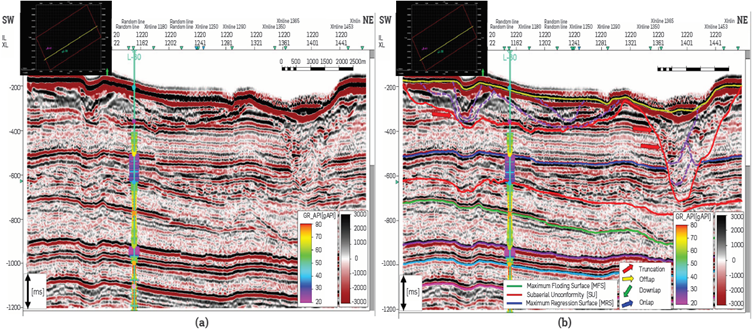
Figure 18 (a) Inline 1220 along with correlation well L-30. (b) Stratigraphic surfaces and submarine channel geometries interpreted are in Inline 1220. This image shows the amalgamated channels deposited inside the submarine canyon (purple dashed lines on the right).
Associated to each system tract, a set of seismic facies was interpreted (Figure 13), which helped in the process of defining the gross deposition environment, which is a fluvio-delta prograding from NW to SE of the study area. Each seismic facies has a particular waveform that may be mapped in the entire seismic survey. Now, using Opendtect's UVQ workflow®, it was possible to map each seismic facies. Figure 19 illustrates the waveform of the seismic facies and a seismic facies distribution map at the MSR. One can clearly see how the seismic facies change as they go deep in the basin.
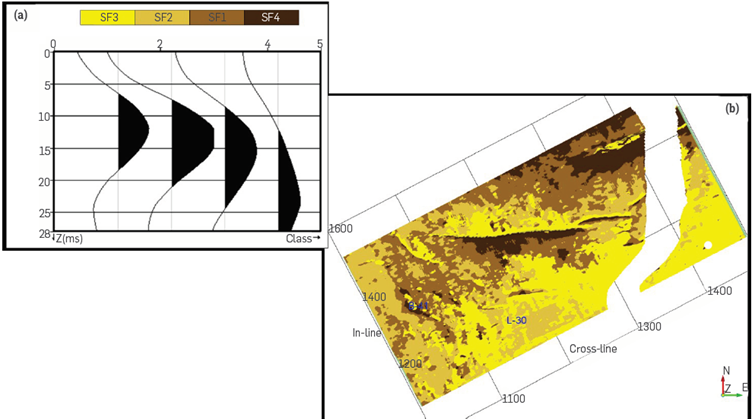
Figure 19 Wheeler domain along with the system tract interpretation and the base level change curve.
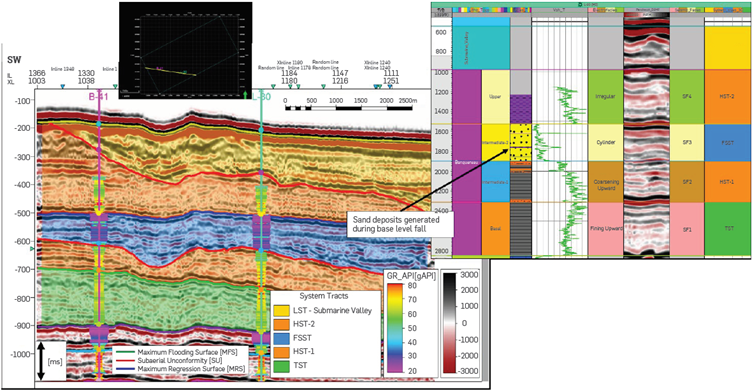
Figure 20 Seismic section illustrating the sand deposits associated with base level fall during the FSST.
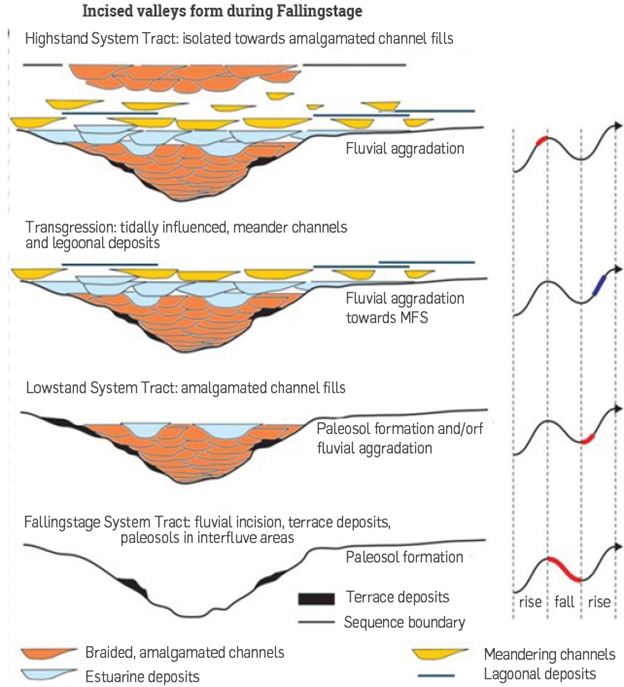
Figure 21 Illustration of how sedimentation occurs in an incised valley during the different stages of base level fall and rise (Modified from [36]).
SUBMARINE CANYON FILL RECONSTRUCTION
The study area is located in the continental shelf of the Sable sub-basin. According to Wach and Mosher [16], marine shelf mudstones, sandstones and conglomerates of the Banquereau Formation were influenced throughout the Cenozoic by several major unconformities related to sea level fall. As mentioned before, sediment distribution of Miocene successions was strongly influenced by the Western Boundary Undercurrent with periods of intensified bottom current activity also occurring in the Late Pliocene [19] - [20], followed by widespread Gully cutting in the Early Pleistocene. These events of bottom current activity and Gully cutting in the Early Pleistocene probably marked the beginning of the formation of the canyon being analyzed. Later, during the Quaternary to recent, several hundred meters of glacial and marine sediment were deposited on the outer shelf and slope [17],[21]-[22], Wach and Mosher [16] also argues that on the Scotian Shelf and Grand Banks, the widespread hiatus eroding either the upper part or all of the Oligocene, is marked by a regional unconformity; the nature of which includes canyon formation. Canyon incision at the shelf edge was initiated during the Eocene and was extensive by the Oligocene [8]. These erosional events are seen in the seismic information where after the base level fall, thick sandstone sequences (200 - 400 [ft]) were deposited on the shelf at the end of the FSST (Figure 20). In this context, the sedimentation within the canyon occurred in stages where the energy of the source of sediments, and therefore the grain size, varies according to the stage.
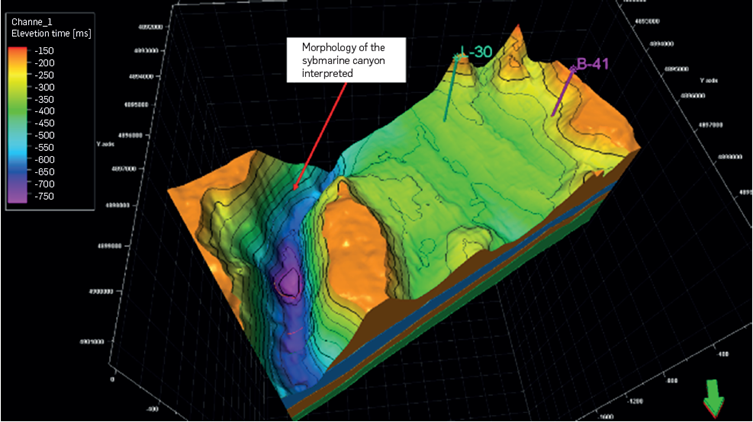
Figure 23 Illustration of the 3D geological model built for the study area. This model is in the time domain and has a vertical exaggeration of 15.
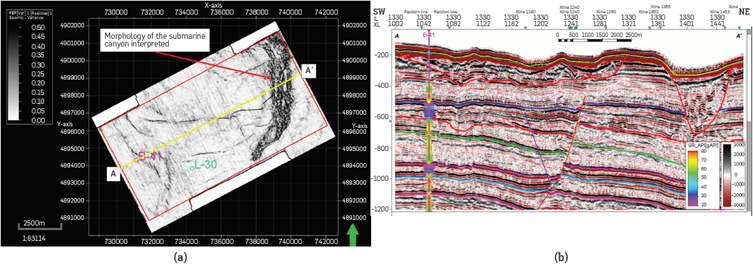
Figure 21 illustrates how sedimentation occurs in an incised valley during the different stages of base level fall and rise, which explains how, after the incision of the valley, the sedimentation evolved to a set of amalgamated channels across the valley where few or no levees of the channels were preserved (Figure 18). In Figure 21 it can also be seen that the sedimentation started with what seems like an embedded stack of channel deposits in the lowest part of the canyon and, as mentioned before, it evolved to a set of amalgamated channel deposits upwards. Figure 22 and Figure 23 illustrate the morphology of the canyon across the seismic survey and the 3D geological model built from the integration of stratigraphic and structural seismic interpretation. Now, Figure 19 shows the Seismic Facies 3 (SF3) related to the Falling Stage System Tract (FSST) shown in Figure 20, which possesses the highest percentage of sandstones, and therefore the seismic facies distribution map shown in Figure 19 can be used as a guide for well placement in the decision making process.
4. RESULTS ANALYSIS
It is highly recommended that stratigraphic columns generated from the description of core and cuttings samples be used as input data to calibrate all of the interpretations of litho-types made based on neural networks or any other methodology, since well logs represent an indirect measure of a physical property of the rocks while having a rock sample from the interval of interest is priceless.
Since the 3D seismic stratigraphic model proposed by this methodology is mainly based on seismic data, it needs to have a good S/N (signal/noise) ratio so that the automatic horizon tracking can produce a horizon framework where the resulting horizons will not cross seismic reflectors. Another way to improve the quality of the horizon framework used for sequence stratigraphic analysis is to incorporate the maximum possible number of horizons as constraints, calibrated with stratigraphic analysis performed with core data and well logs. The more guidelines the algorithm has to perform the automatic tracking of the horizon framework, the better the resulting horizon framework will be. Now, the constraints horizons need to be interpreted based on stratigraphic analysis and preferably, sequence-bounding surfaces, thus the interpreter will have control of how the automatic tracking of the horizon framework would turn out.
Referring specifically to system tracts interpretation from the base level curve (Figure 16), it could be argued that right after the Falling Stage System Tract (FSST) an almost completely eroded Transgressive System Tract (TST) might be interpreted following the high negative amplitude above the Maximum Regression Surface (MRS) at approximately 550 [ms] (Figure 18).
Besides just having a basic 2D sequence stratigraphic model, this methodology provides the interpreter with a 3D geological model that incorporates 3D sequence stratigraphy, structural geology and sedimentation history, thus allowing the extraction of geobodies from the seismic facies associated with a specific system tract that has the highest probability of sandstone discovery. Together, these work as a tool that helps the interpreter when it comes to well placement decisions.
CONCLUSIONS
The implementation of advanced techniques for 1D facies modeling, such as neural networks calibrated with core description, represents a step forward in the definition of accurate 1D facies models that are used to calibrate the final 3D facies model.
The workflow proposed in this paper for seismic image enhancing guarantees that the seismic data will have the quality necessary for stratigraphic interpretation. Using the resulting enhanced seismic image, a set of four seismic facies were interpreted and properly linked to the electrofacies in the correlation wells, enabling the identification of two main stratigraphic sequences in the Wheeler domain.
Based on the 3D sequence stratigraphic model calibrated with well data, a set of system tracts such as TST, HST, FSST and LST were identified, corresponding to the transgression and regression phases associated with the sedimentation of the Banquereau Formation. This Formation was deposited in a fluviodeltaic environment that was eroded down to the last TST sequence by a submarine canyon during the HST-2.
During the description of the stratigraphic packages in the seismic information, the top of the Banquereau Formation is interpreted as the base of a submarine canyon that was generated throughout the prominent erosion event at the end of the prograding HST-2, which afterwards was filled up by an amalgamated channel complex, indicating that the sedimentary environment interpreted matches the description made by Wach (2010).
The integration of advanced techniques for 1D facies modeling along with seismic facies modeling from waveform and 3D seismic stratigraphic analyses allows the interpreter to draw much deeper conclusions about the gross deposition environment and, most importantlysps, have the right information for decision making in the exploration phase, thus reducing the uncertainty in prospective areas.

