English (pdf)
 Article in xml format
 Article references
 Send this article by e-mail
 Cited by SciELO
  Cited by Google
  Similars in
SciELO
Similars in
SciELO  Similars in Google
 Permalink
1. INTRODUCTION
The vortex tube is a simple device with no moving parts and can divide a high-pressure stream into two relatively lower pressure streams, flowing at temperatures higher and lower than the inlet flow. The device consists of a simple circular tube, with one or more tangential nozzles for flow inlet, and two outlets. The high-pressure fluid enters the tube tangentially and produces strong vorticity flow in the tube. The gas separates into two streams of different temperatures, one flowing along the outer wall and the other along the axis of the tube in the opposite direction. The gas streams leaving the vortex tube have higher and lower temperatures, respectively than the temperature of the inlet gas [1],[2]. This effect is known as "temperature separation" and was first observed by Ranque in 1931 when studying processes in a dust separation cyclone [3].
In general, this device is used for cooling air for specific applications, from cabinet cooling to dental applications. Owing to the vortex tube applicability advantage, scientists have utilized various experimental, analytical, and numerical data to study the transport phenomena inside the tube [4]-[7]. Most of the work found in literature therefore use air as a working fluid in both experimental and modeling research; also, there was not much work concerning fluids other than air, focused on gas species separation applications. It should also be mentioned that the use of axi-symmetric or two-dimensional models to simplify computational calculations is a trend in the literature consulted; however, the hypothesis that the flow inside the vortex tube is axi-symmetric is not consistent with the actual flow nature, which is why the use of simplifications (in which a section of the tube is modeled) is not considered in this work. Moreover, this numerical study represents an approach, using methane as working fluid, to the vorticity phenomenon in a commercial Ranque-Hilsh vortex tube, with a view to coming up with a tool that provides preliminary information on vortex tube industrial implementation for liquefying natural gas; In addition, we hope that this study contributes to the understanding of the energy separation phenomenon within the device, for further research that includes the integration of vortex tubes in thermal cascades, for example, and other uses, such as those investigated by Bazgir, Adib & other authors [8]-[11],
2. THEORICAL FRAMEWORK
In general, a vortex tube is designed to obtain either (i) maximum temperature separation or (ii) maximum efficiency. At a given delivery pressure, however, many vortex tubes with different design parameters can produce the same temperature separation [12]. A schematic diagram of the vortex tube is shown in Figure 1 and consists of the following parts: (i) Main tube, (ii) nozzles and / or Inlet chamber, (iii) cold-end orifice, (iv) flow regulation valve, and (v) hot-end bore. The chamber facilitates the tangential entry of the gas stream at high speed on the hot side, which has a cylindrical cross-sectional area. The control valve obstructs the gas flow through the hot side and also controls the amount of hot air through the vortex tube [13].
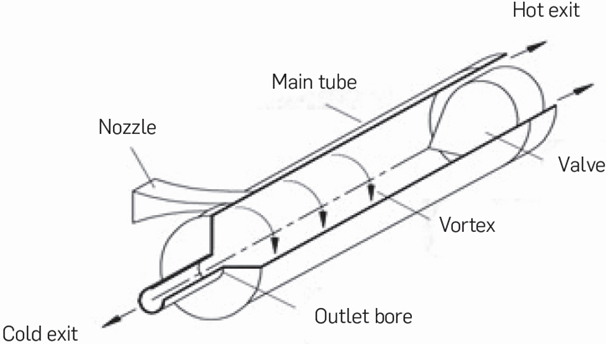
Vortex tubes are typically used either for their cooling or heating capacity in specific conditions, for example, microchip cooling, welding, polymer solidification, or for heating control valves in very low temperature weather conditions. Vortex tubes can be useful in many situations, since they are small, simple to construct and repair, and do not require any electrical or chemical energy input [14].
The most recent research is focused on improving the temperature delta, looking to improve device performance and the phenomenon description inside the vortex tube, to understand the nature of the physical phenomena that govern the flow dynamics inside the tube [16]. In the literature on the two main streams, experimental and modeling analyses are identified; however, the CFD analyses carried out usually are supported by experimental results. As found, the following has been analyzed: the influence of the number of nozzles, both experimentally and computationally [17],[18], the vortex generator material, with the aim of measuring its influence on the thermal performance of the device [19], the nozzle geometry [20], alternative geometries studied for the vortex generator in experimentation [21]-[24], the valve for the hot discharge [25]-[27], the influence of the tube curvature [28],[29] and the use of thermal Insulation focused mostly on refrigeration device applications [30], [2].
However, recent efforts have successfully used computational fluid dynamics (CFD) modeling to explain the fundamental principles behind the energy separation produced by the vortex tube [31], The compressible two-dimensional (2D) steady axisymmetric and turbulent vortex tube was researched numerically using the CFX code system by Fröhlingsdorf and Unger [32], where the velocity profiles were at their maximum near the tube wall and at their minimum in the tube center, with high velocity observed in the cold side discharge (exit of the vorticity chamber). Promvonge [33] applied an Algebraic Stress Model (ASM) for the simulation of a strong vorticity flow in a vortex tube and found that the use of the ASM model results is a more accurate prediction than the standard k-e model. Behera et al. [34] researched geometrical ratio in the tube and the energy separation in a CFD analysis using the k-e turbulence model of the Star-CD code. The research showed that L/DO ratio in the range of 25 -35 is optimum for achieving best thermal performance for a 12 mm vortex tube. These optimized vortex tubes could produce na maximum hot gas temperature of 391 K at 12-15% hot gas fraction and a minimum cold gas temperature of 267 K at about 60% cold gas fraction. The total temperature from CFD analysis showed that peripheral flow is warm and core flow is cold relative to inlet temperature for a hot gas flow fraction of about 28%, and for experiments conducted with nearly identical conditions, the error percentage between the thermal jumps in both cases does not exceed 5.3%. Also, the maximum coefficient of performance (COP) of the vortex tube is found to be 0.59 as a heat engine and 0.83 as a refrigerator.
Aljuwayhel et al. [15], using a two-dimensional axi-symmetric CFD model, studied the energy separation mechanism in a counter flow vortex tube. They reported that the vortex tube flow field can be divided into three regions that correspond to: flow that will eventually leave through the hot exit (hot flow region), flow that will eventually leave through the cold exit (cold flow region), and flow that is entrained within the device (recirculating region). They also reported that, in general, smaller diameter vortex tubes will provide more temperature separation than larger diameter ones and the magnitude of the energy separation increases as the length of the vortex tube increases to a critical length (22.5 cm); however, a further increase in the vortextube length beyond the critical length does not improve the energy separation.
Moreover, Skye et al. [14] studied a two-dimensional (2D) steady axisymmetric CFD model (with swirl) that used both the standard and renormalization group (RNG) k-epsilon turbulence models. In the experiment, the cold fraction is directly related to the pressure at the hot exit; In addition, changing the hot exit pressure caused the cold exit pressure to change due to the pressure drop associated with the additional flow through the cold orifice. Finally, the model consistently under-predicts the cold and hot temperature separation by approximately 16 and 4 K, respectively, and both the experimental data and the model show maximum power separation with a cold fraction of about 0.65. Shamsoddini and Nezhad [35] performed numerical work to analyze the effect of nozzle number on the flow and cooling power of a vortex tube. In their work, the effects of these two factors were studied using a three-dimensional fluid dynamic model and it was observed that, as the number of nozzles Increases, the cooling power increases significantly, while the cold outlet temperature decreases moderately. Khazaei et al. [36] numerically researched the effect of gas properties and geometric parameters on vortex tube performance through a 2D CFD model. They showed that the size of the hot side outlet and its shape do not affect the energy distribution in the vortex tube, while a very small pipe diameter adversely affects the temperature separation.
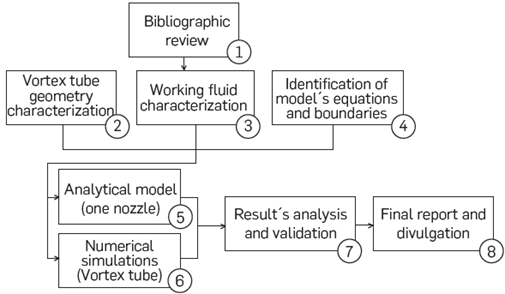
The literature consulted on the vorticity phenomenon in a Ranque-Hilsch vortex tube in general is divided into 2 groups, as previously mentioned: experimental research focused on geometric and thermophysical parameters to explain the phenomenon and optimize its geometry, to thus obtain its maximum efficiency; and, on the other hand, the analytical and/or numerical research that contributes to the analysis of the mechanism inside the tube. Nevertheless, although there is a lot of literature about the vorticity phenomenon, most authors use air as a working fluid, and there are few studies considering working fluids such as natural gas. This study thus relates to the second group of research into this subject, since it is a numerical-analytical piece of research that, besides simulating the vorticity phenomenon in a vortextube, uses methane as a working fluid in order to evaluate the possibility of using this device for natural gas liquefaction. This numerical study then represents a first approach to the vorticity phenomenon using methane as working fluid and is developed in order to come up with a tool that provides, under certain process inlet conditions, preliminary Information on the vortextube industrial implementation to obtain liquefied natural gas. The methodological scheme for this work is shown in Figure 2.
3. EXPERIMENTAL DEVELOPMENT
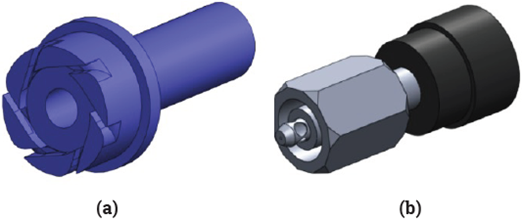
The Ranque-Hilsch Vortex Tube used in this work is a counter flow commercial model produced by Arizona Vortex Tube MFG CO®. The tube main length is 89.3 mm. The energy separation occurs in this section, and it used as a geometric domain for the CFD model. The cold and hot outlets are axial holes with areas of 30.1 mm2 and 89.24 mm2, respectively. Figure 3 shows the vortex tube analyzed and its components.
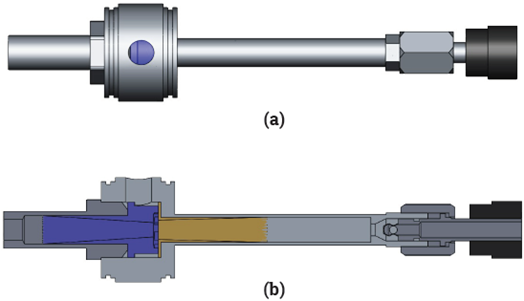
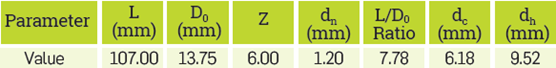
The vortex tube has a radial inlet, requiring a specific component called a "vortex generator," necessary to transform the radial motion of the fluid into a tangential motion (this is shown in Figure 4). The generator is located in a plenum chamber, and it is composed of a series of circumferential nozzles, which allow the flow to reach a high tangential velocity while it moves to the center of the tube. Table 1 presents the main geometrical parameters of the vortex tube studied.
The flow in the vortex tube is simulated using a 3D computational model to obtain a better understanding of the behavior of the fluid and the energy. Figure 5 shows the computational domain used for the solution for the phenomenon, considering simplifications such as: the fixed position of the hot outlet valve (cold fraction of 60%) shown in Figure 4, the thin wall suppression in a portion of the vorticity chamber and the sharp edges at the outputs of the generator and the metal seal.
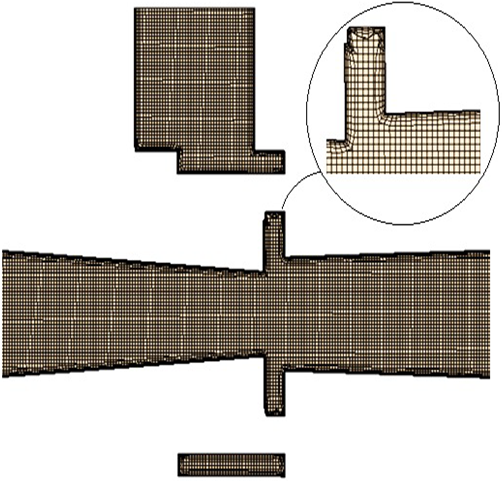
A three-dimensional computational grid with trimmer-type volumetric cells was used with 5 prismatic layers near the walls, considering a base size of 10mm and refinement in the hot outlet region corresponding to the cone valve. Figure 5 shows the grid implemented.
STAR-CCM+ software solves the compressible turbulent flow conservation of mass, momentum and energy and state equation and the turbulence model used was Kappa-Epsilon, whose main equations for calculating the turbulent kinetic energy (k), and the rate of dissipation (ε), are obtained from the equations shown as (1) and (2). For more information on all the equations considered, see Kandil & Abdelghany (2015) in reference [37].
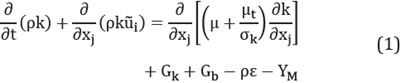
The model constants are: C1ε=1.44, C2ε=1.92, C3ε=0.09, σε=1.3, σk=1.0 [37]
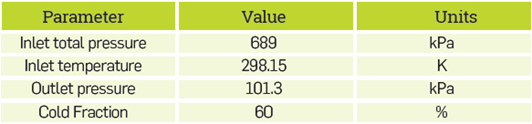
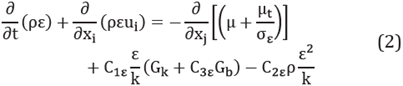
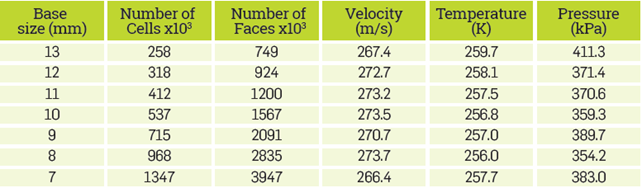
The boundary conditions applied to the model are shown in table 2. The tube wall was considered adiabatic and a non-slip boundary condition was applied too. A grid independence study was also carried out, Table 3 shows the specifications for the mesh sizes evaluated and the variables measured at nozzle discharge: velocity temperature and pressure. These results by themselves are not enough to determine whether the mesh is good enough to attain reasonable results. Comparison of these variables showed that velocity exhibited fluctuations and took longer to be stabilized Figure 6 presents the stability of the velocity for the different mesh sizes considered. One can see that velocity becomes stable when the base size is bigger than 9 mm. Because of that, and in order to assure the results from the CFD simulation, a base size of 10 mm was selected. Furthermore, a minimum iterations number was established at 25000 as a convergence criterion [38]
To solve the problem analytically, the following values were considered: inlet and outlet areas of the nozzles corresponding to 11.03 mm2 and 6.10 mm2, respectively, average length of the nozzle, 4.9 mm. Air and methane were considered as the working fluid. The calculation was performed considering isentropic conditions with an ¡sentropic constant (γ) of 1.4 for air and 1.3 for methane, and gas constants: Ra=0.287 kJ/kg-K and Rm=0.5182 kJ/kg-K.
The main properties (temperature, pressure and density) are calculated by relating them to the stagnation properties and Mach number and the discharge pressure and the critical area as well obtained from the stagnation pressure and Mach number [39];
4. RESULTS
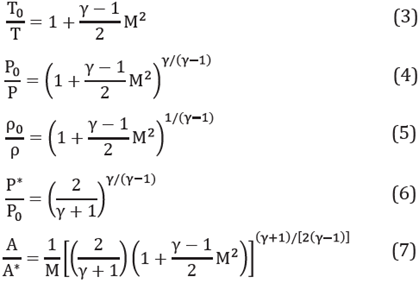
This section initially shows an analytical model to determine the profiles of some properties along a vortex generator sentropic nozzle of a vortex tube with the geometry specified above in the experimental development section making use of the equations (3)-(7) and considering air and methane as working fluids. Subsequently, the results obtained from the numerical simulations are shown for the same properties evaluated in the analytical model, corresponding to Mach number, velocity, pressure and temperature, considering all the tube geometry as the computational domain (Figure 4). In section 5, relating to the analysis results in this document, the results obtained from both models shown in this section are compared and the validation of the computational model is shown.
An analytical model was followed to calculate the change in Mach number, pressure and temperature for the vortex tube nozzle geometry, for air and methane. The results obtained for air were compared with analytical data and CFD results in order to validate the CFD model developed in this paper. Figure 7 shows pressure, temperature, velocity, and Mach number profiles along the one nozzle, considering air as working fluid. Temperature and pressure decrease as air moves downstream the nozzle towards the outlet, while the air velocity and the Mach number increase. Figure 8 presents the pressure, temperature, velocity, and Mach number as methane is moving downstream the nozzle. It was noticed that the results exhibit a similar trend for both working fluids. For purposes of carrying out the methane simulation, the same boundary conditions used for air were established and the cold fraction corresponding to 60% was also tested.
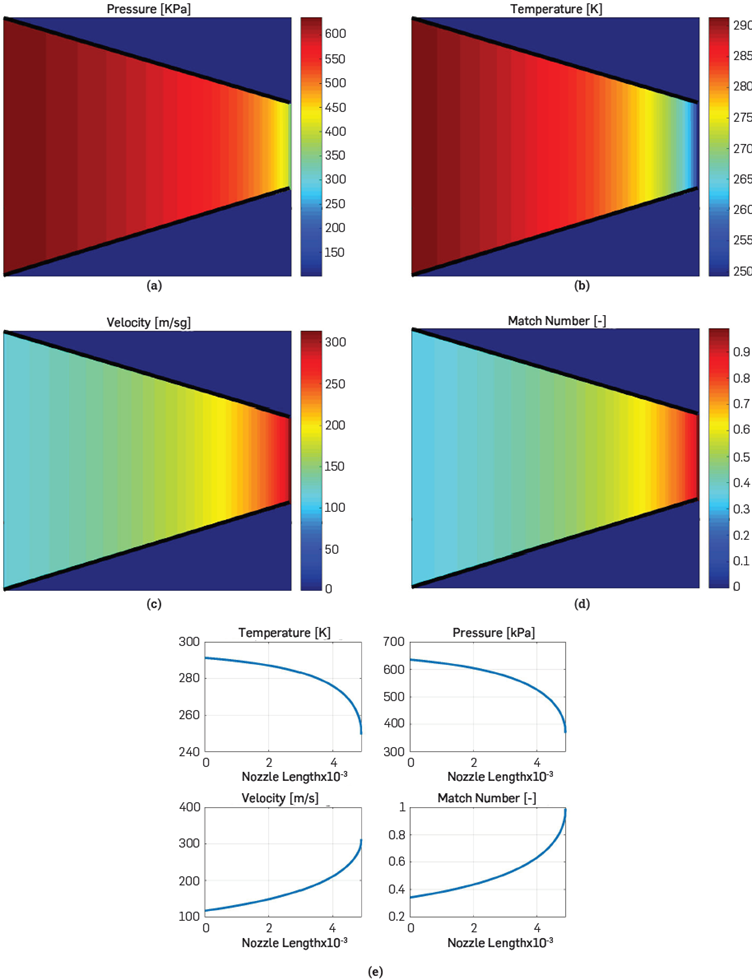
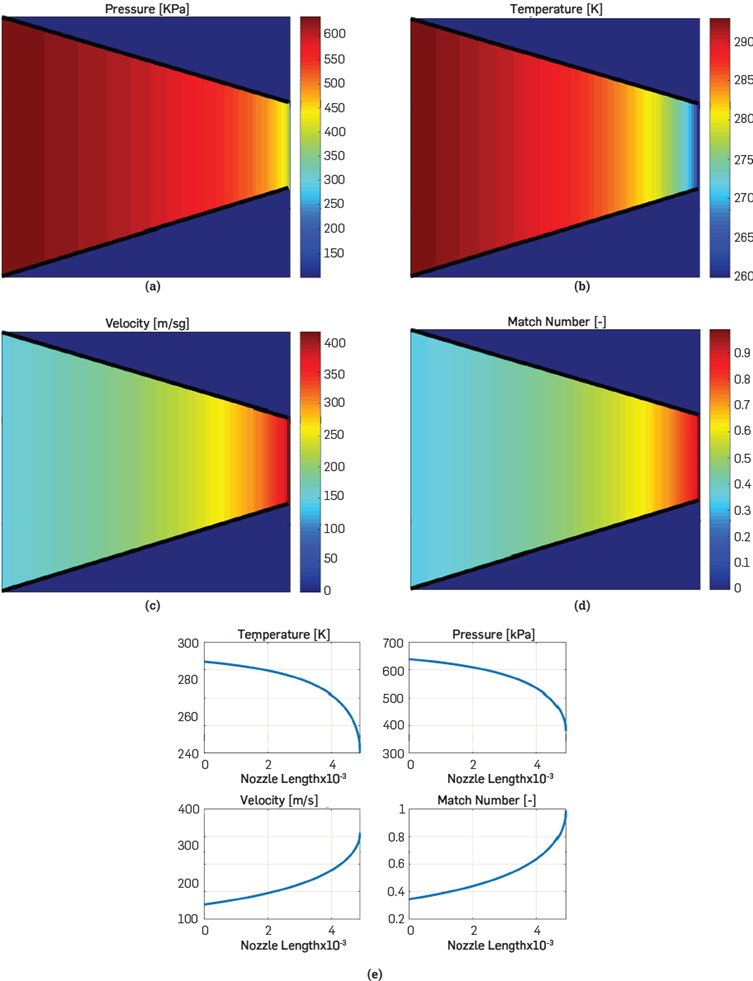
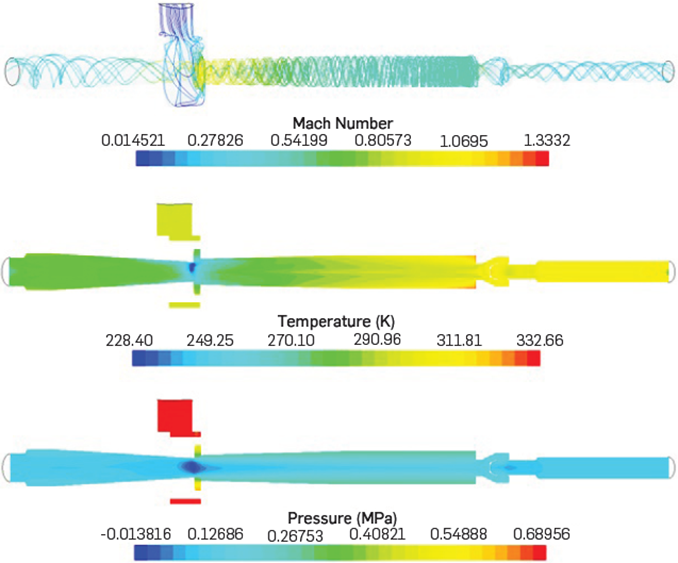
In general, the results for the variables profiles: pressure temperature and velocity of the analytical model for an isentropic nozzle, are shown in Figures 7 and 8 for both working fluids. One can see in Figures 7 and 8 that Mach number increases, going from a value close to 0 (the fluid is moving slowly and the pressure is maximum), to a value equal to 1 at the exit of the nozzles located in the generator. The pressure is transformed in velocity at the generator and because of that, the internal energy drops, and it is reflected as a temperature drop. Figure 9 shows the results from the CFD simulations considering a 60% cold fraction for air as the working fluid. The temperature, pressure and the Mach number profiles are shown.
The tangential geometric configuration of the nozzles creates a rotating flow that can be observed in the Mach number figure (see Figure 9). The rotating flow coming from the generator remains in contact with the pipe conducting the flow from the generator to the hot side exit, where the control valve is Located. When the flow reaches the control valve, part of the fluid exits while the rest returns through the center of the pipe towards the generator.
The effect of this counterflow motion creates a temperature difference between the flow moving against the wall of the pipe and the flow moving in the opposite direction at the center of the pipe. This temperature difference is also observed in Figure 9 for the schematic of temperature profiles in the tube; it is also evident that the lowest temperature in the vortex is in the critical zone corresponding to the device vorticity chamber. Finally, regarding the pressure distribution (see Figure 9), one sees the pressure increase from the generator in the direction to the control valve for the flow in contact with the wall. When the flow moves in the opposite direction through the center of the pipe, the pressure decreases, and this pressure behavior helps to generate the counterflow. Also, because of the temperature, pressure, velocity and direction difference between the external and internal flow, the internal channel is created.
Methane motion is similar to the behavior set out for air in the Vortex tube. Pressure, temperature and Mach number distribution can be observed in Figure 10. For this working fluid, a less visible flow separation pattern is observed considering the same boundary and initial conditions as those evaluated in the case of air. However, the Mach number is higher for this second case in the critical area of the device (at the exit nozzles). In general and as can be seen in Figure 10, there are no significant differences in the profiles of the evaluated variables in comparison with the results obtained considering air as the working fluid, and where slight differences were seen between both fluids was in the Mach number and velocity correlated variables; this can also be seen in Table 4 of the results analysis section.
5. RESULTS ANALYSIS
Comparing the results obtained from the analytic model with the isentropic nozzle profile (Figures 7 and 8), for the two working fluids: air and methane, and the values for the three main properties calculated at the nozzles exit: velocity, pressure and temperature with the simulation results at the nozzles exit too, one can see in Table 4 that a maximum error of 13.40% is attained for methane, which is an acceptable percentage, according to the authors of this work.

It should be noted that this comparison was made at the nozzle exit and the data is the average of the variables at this boundary. Also, the nozzle exit is selected as the main area of interest, because this zone relates to the device's critical zone; in other words, the zone where the high and low peaks of the properties arise.
However, according to the results obtained from the simulations (Figures 9 and 10), the highest pressure drop, the lowest temperature in the Vortextube, and the greatest speeds close to 300 m/s (Mach tends to 1) are obtained at the nozzle exit. Therefore, both results obtained from the proposed CFD model and the analytical model shown in the previous section for the vortex tube nozzles, show similar results.
The thermal jump for the hot and cold vortextube discharges is the main variable to be considered in this phenomenon according to the available literature. Table 5 compares the results attained in this work for the CFD analysis, with data available in the literature for the cold side (ΔTc) and hot side (ΔTh) thermal jumps, considering a 60% cold fraction, air as the working fluid and similar boundary conditions. Table 5 shows the relative error, taking as real data (x) the values reported in literature, and as measured data (xO), the values obtained in this work, from a CFD model (28.84K cold thermal jump and 36.67K hot thermal jump). It was noticed that the results obtained by CFD in this work differ from the results from other authors, with an error lower than 14.6%. Taking into consideration the experimental data reported [14], the error is 16.22%. Furthermore, It was corroborated with the authors considered in Table 5 that the equipment critical area is just at the exit nozzles, in the vorticity generator. At the nozzle exit, the highest velocity and the lowest pressure and temperature values are achieved [1],[15],[39]
Table 5 Comparison of CFD with other authors (Tube Discharges)
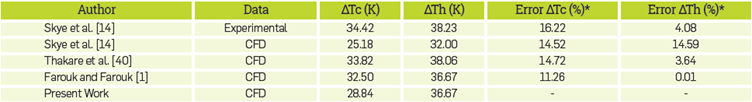
* The relative error for both thermal jumps is calculated from  [41]
[41]
CONCLUSIONS
Through this work, it was possible to provide a first approximation of the vorticity phenomenon in the vortex tube and develop analytical and computational models to predict the behavior of the device under certain operating conditions. The results obtained area tool to investigate the possibility of obtaining liquefied natural gas using vortex tubes.
The computational model showed an error no greater than 15% in comparison with the analytical solution for an isentropic nozzle of the tube vorticity generator, while the data obtained in this work for the computational model (CFD) differ from other authors with an error less than 16%, considering air as the working fluid and boundary conditions, governance equations and similar turbulence models.
Meanwhile, the simulation with methane as a working fluid shows a high probability of liquefaction of natural gas with the vortextube if a thermal cascade is used for this purpose; since, with a single device, it is not possible to obtain a stream with enough pressure and cooling to liquefy the gas (atmospheric pressure and temperature close to -160ºC)