


 English (pdf)
 Article in xml format
 Article references
 Send this article by e-mail
 Cited by SciELO
  Cited by Google
  Similars in
SciELO
Similars in
SciELO  Similars in Google
 Permalink
1. INTRODUCTION
Electric energy end-use applications are being updated due to the advent of new technologies such as Smart Grids (SG), that provide added value to services and make it possible to face challenges such as online DSM [1],[2]. A critical feature of new electric power systems is the handling of two-way customer information that enables active participation by customers [3],[4]. This makes it possible to create new scenarios for functionalities such as DSM, which comprises several strategies aimed at modifying consumption patterns from end-user customers connected to SGs. One of the tactical objectives of DSM is efficient energy management [5].
The potential role that Information and Communication Technology (ICT) can play in improving the energy performance of buildings has been recognized worldwide [6]. Several studies support the view that the use of Smart Metering Systems can increase energy efficiency [7]. However, adequate metering is required in order to understand the base performance level to ascertain the current efficiency of the process [8].
Energy efficiency improvement is a common target of ISO NTC 50001 energy management systems [9],[10] and to determine the dynamics of user consumption according to the type of load at any time.
In this paper new KPIs, which are suitable for new available technologies, are proposed, aimed at DSM implementation strategies. These indicators seek to quantify energy consumption, portraying them under different aspects according to the time of day. Based on the analysis thereof, we determine which strategy should be used for each case in order to bring about change in consumption patterns. A case applied at the Universidad Nacional de Colombia -Bogotá campus facilities is studied.
Firstly, a theoretical framework is presented that enables DSM to be related to KPI uses. Also, it justifies the use of indicators in real time. Then, the values obtained from traditional indicators are presented, for the case study, specifically for one of the campus buildings. New KPIs based on AMI are presented and the results obtained are analyzed. Based on this, the results in percentage energy savings are quantified for each DSM strategy.
2. THEORICAL FRAMEWORK
Due to global warming and the energy shortage, energy consumption and efficiency has become a popular research topic. The energy management and savings achieved from KPI use in study cases is still being researched and are different for each building, industry or equipment. The availability of monitoring and control systems are essential to increasing efficiency; for example, building energy management systems (BEMS) are fundamental to achieving this goal. Cases with the following energy savings have been documented: 50% in industrial process including motors, heaters and other power facilities, 21% in Companies that have HVAC systems, artificial lighting systems and office automation equipment [11].
KPIs have always been necessary to measure, verify and optimize energy consumption, even if there are no automatic control systems [12]. In buildings that comprise different uses, the energy indicators make it possible to know and detail the consumption in order to increase efficiency [13]. Currently, the implementation of energy KPIs is very common within energy-intensive industries and different buildings. In any case, deciding on which energy KPIs to use can be a difficult and time-consuming process. However. benchmarking energy consumption could be a solution to standardize energy management in terms of quantity and quality [14].
Worldwide, the implementation of KPIs is crucial to the application of energy audits [15],[16] and obtaining ISO 50001 certification. Measuring the energy consumption of a process makes it possible to assess the optimization potential and helps visualize verifiable benefits from improvement measures. The development and application of energy efficiency indicators depends on the purpose for which they will be applied. Usually, the indicators are ratios describing the relationship between an activity and the required energy [17]. In Europe, there are specific directives for improving building energy performance, taking into account local conditions and cost-effectiveness [18].
ADVANCED METERING INFRASTRUCTURE
An AMI system integrates hardware and software elements to form a smart metering-based communication infrastructure, which allows two-way communication exchanges and Real-time recordings [19],[20]. Elements of the system interact with each other in a trustful, flexible and efficient way to enable end-users to interact with the utility (SmartGrid.Gov) [21]. AMI systems are formed by four core elements: 1) a smart meter, 2) data controller, 3) communication network and 4) data management system. The meter has features that make it possible to collect and transfer consumption data to relevant agents. The communication infrastructure also makes it possible to transmit information so that a management system can analyze it and make decisions about the data observed; also, it is used for processing, storing and distributing the information among agents. Figure 1 shows this general system.
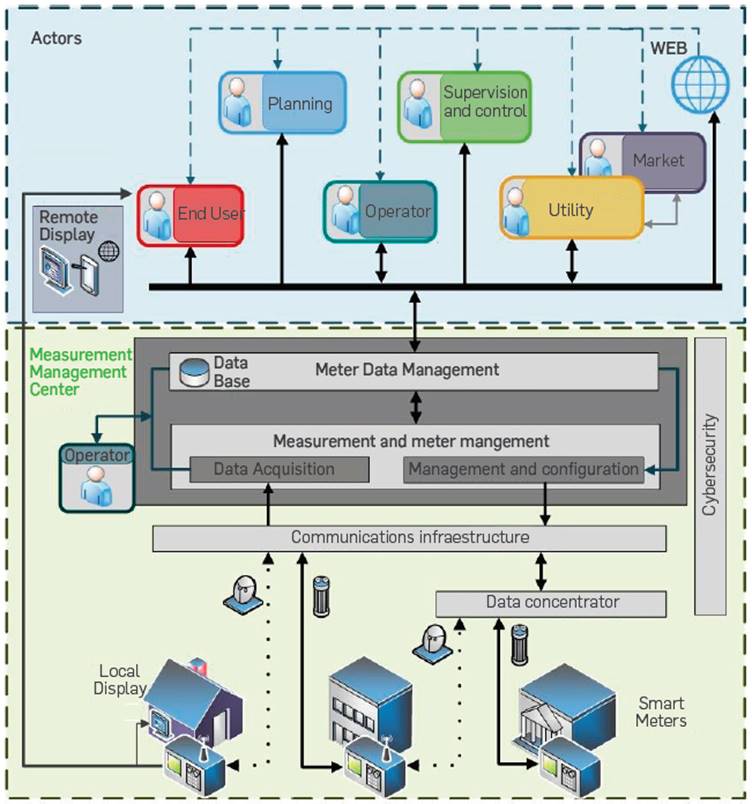
Figure 1 General overview of an AMI system (Adapted from Téllez Gutiérrez, Rosero García, & Céspedes [22]).
Smart meters: At the bottom of the infrastructure, there are smart meters. They can be installed directly into the user's home or in place outside through a meter in a centralized unit. In this latter case, the information measured is supplied to the user through a display that is located at her/his home.
Communication infrastructure: The transmission of information from the meter to the management system can be performed through two distinct pathways: 1) directly from the meter to a management center and 2) through a data controller receiving information from a set of meters and then transmitting it to a management center. In both cases, communication technologies through both wired and wireless are used. Also, communication infrastructure includes the tools, resources and working methods necessary to ensure the cybersecurity of the information in the system.
Management of data from the metering: It is composed of two main parts: 1) Meter - management of the measure, which deals with the reception and transmission of data into and out of the device and 2) Meter Data Management (MDM) that carries out the information storage and processing functions. The loop inside the MDM represents the operation-related data that permanently travel around the communication infrastructure.
DEMAND-SIDE MANAGEMENT: VOLUNTARY RESPONSE
Some strategies that are mainly based on client’s voluntary response may lead to consumption patterns modification, taking as a basis the availability of consumption information to carry out educational campaigns and public disclosures of historical consumption values and projections [23]-[25]:
Consumption information display: AMI systems allows user on-line access to consumption information and comparatives
Information sharing: periodic disclosures of consumption information and comparative savings for each building or end user cluster fosters client’s involvement.
Impact of quantification and disclosure: Energetic, economic and environmental impact quantification associated with programmed-and-made energy savings exert a positive influence on end-use consumption patterns.
Awareness of good practices: Good practices related to energy end-use can be taught through educational campaigns and disclosure mechanisms.
ENERGY PERFORMANCE INDICATORS
To assess the energy performance of organizations, processes and buildings, specific KPIs are employed to indicate the intensity of energy consumption per unit of reference. These indicators relate electricity consumption with factors such as amount of manufactured product, amount of delivery service or built area [26]. For every applied case, an indicator is prepared in accordance with specific demands of the process [27]-29]. Energy efficiency improvement has been reported worldwide, supported by the use of specific indicators for each production sector [30]-[33].
Ascertaining whether or not an energy consumption system is consistent with planned targets is determined by KPIs. Also, it must be possible to monitor KPIs at time intervals that are congruent with energy regulations [34]. KPIs must have some essential features [35]:
Relevance: they must be able to describe the achievement of goals correctly
Availability: they must be calculated based on the available information
Simplicity: they are reachable for whoever interprets them
Validity: they are formed by parameters that correlate substantially
Specificity: they actually reflect what needs to be measured
Reliability: they come from reliable data
Awareness: they identify several situations through changes to them
Suitability: to a sufficient extent to be assessed
Explicitness: Ability to fully express what they estimate.
TRADITIONAL INDICATORS
Traditional energy indicators cannot be correctly applied to all type of energy end-use; nor do they satisfy all listed features as set out above [36]. An example of this is monitoring the energy consumption and efficiency of a building used for educational purposes. Traditionally, monthly energy consumption information is used to calculate KPIs that relate such energy per built area (kW.h/m2 a month). The results register changes in monthly energy value per each area studied. Nevertheless, these indicators do not take account of determining factors in consumption patterns such as time of day, end usage of the area or the number of people who occupy it.
An Energy vs. Production curve that makes it possible to assess an industrial consumption baseline, does not have a straight application to a university campus building, due to the fact that there is no product directly correlated with energy consumption in educational processes. A monthly period analysis is a very wide time window compared to consumption changes. In conclusion, traditional KPIs are not adequate for the purpose of estimating energy savings nor supporting consumption decision-making processes due to that they do not comprise interdaily follow up in terms of load changes
PROPOSED INDICATORS
Correct energy monitoring for a building, which is supported by smart metering, makes it possible to establish new Energy Key Performance Indicators in Real Time (eKPIRT). They include factors such as actual occupancy of the area under study and the energy end-use.
An indicator may involve the number of people present in the allocation where consumption has been measured to ascertain the consumed power (P) per each user on an interdaily basis, as presented in Equation 1.

Equation 2 shows a new indicator that relates energy (E) consumed by each energy end-user (hall lighting, offices, rooms, ancillary services) with the total energy for the building. This value can be found for each hour of the day to reveal consumption patterns.

Once a consumption dynamic is assessed for each energy end-use, it is possible to develop DSM strategies and different savings targets (A) for each one of them, as presented in Equation 3:

3. EXPERIMENTAL DEVELOPMENT
CASE STUDY: UNIVERSIDAD NACIONAL DE COLOMBIA BOGOTÁ CAMPUS
The Universidad Nacional de Colombia-Bogotá campus comprises an area of 1,213,500 m2 and 125 buildings. The electricity network consists of an area of 8.5 km that interconnects 35 substations through 37 lines [37]. There are several electric energy end-uses; there are several types of end-user: students, teachers, managers and support staff. The dynamics of daily energy consumption are different in each case. It is important to mention that the university community does not pay directly for consumption; generally, they do not have an awareness of energy payments. A culture of saving is catching on thanks to the implementation of DSM programs.
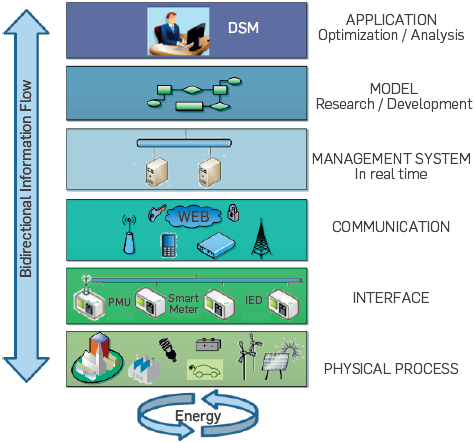
Laboratorio Nacional de Redes Inteligentes (LAB+i - National Smart Grid Laboratory) has been rolled out into Universidad Nacional de Colombia, Bogotá campus. The SG platform system, in accordance with Figure 2, enables energy management in real time. It acquires and shares on-line information so that a user can become aware of her/his energy behaviour [38].
METHODOLOGY
In order to perform analysis of information as well as to set up indicators, a methodology had been defined on the basis of data available from LAB+i, as shown in Figure 3. It is appropriate to clarify that data filtering should be carried out to remove incorrect data in each case.
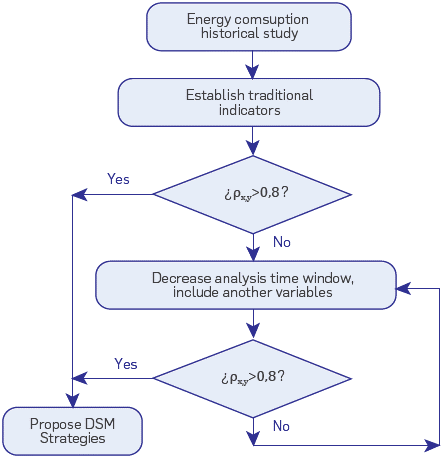
The aim of experimental development is to control the variability of random processes in energy consumption [40]. There are non-controllable variables at the root of this variability, thus the responses from consumption patterns should be studied in clusters (such as months, days of the week, type of end-use consumption) The relevance of the variables in each indicator shall be validated by a correlation analysis (> x,y)
4. RESULTS
TRADITIONAL INDICATORS
Educational facility analysis in relation to monthly consumed energy is associated to Indicators that study global patterns, but that Leave out the possibility of monitoring relevant factors as part of energy management. Figure 4 presents energy and power values associated with university campus total consumption.
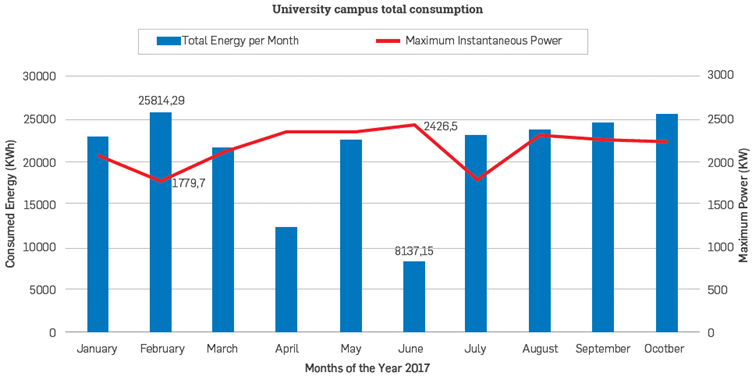
The monthly consumed energy value reflects a relatively high standard deviation, 28%. This variation is present due to several causes. For example, Easter (in April) was included, as were June's two week-long vacation for everyone resulting in a significant reduction in consumption (Easter is not celebrated by Colombians even though they celebrate "Semana Santa" that is indeed an entire week of religious celebrations and very often teachers, students, managers and support staff are given the entire week off from work). A monthly energy indicator does not enable these type of direct inferences because the observation time window is too wide in contrast with changes in consumption patterns.
Also, Figure 4 shows a value for instantaneous power consumed per each month. It can be observed that this value has a high correlation with monthly consumed energy (Annual correlation =0.48). For example, February reflects the highest monthly energy consumed per year (25814.29 kWh); instead, maximum power consumed was 1780 kW, the lowest of the year. In contrast, June reflects Lower consumed energy monthly (8137.15 kWh and the greatest instantaneous power value (2427 kW).
INTERMEDIATE INDICATORS
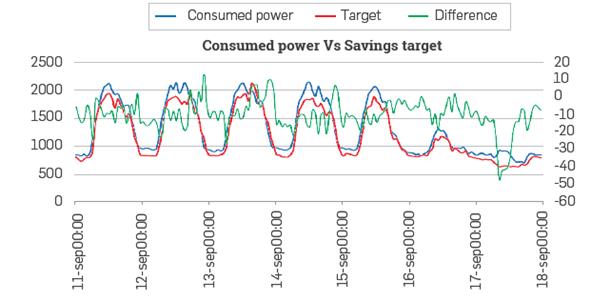
Savings targets can be established with historical daily energy consumption, then fulfilment can be evaluated with smart metering systems. This is the case with the #AhorraUN proposed program by the Oficina de Gestion Ambiental. Universidad Nacional de Colombia - Sede Bogotá in 2017 [41], which set a total savings target of 10% for the campus during 2017 (according to 2015). To follow up on target fulfilment, historical consumption data was filtered for each day of the week (Monday, Tuesday, etc.); also graphs with a target line have been prepared. Figure 5 shows daily graphs including the target line, actual consumption and the perceptual difference between them. This is a graphical intermediate indicator that enables verification and documentation of target fulfilment, but does not make it possible to identify specific savings opportunities.
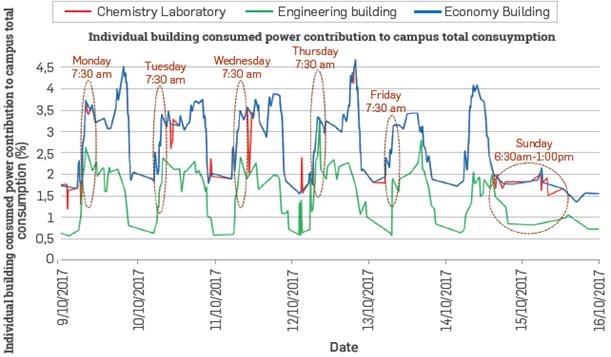
Campus buildings provide various services, and load has a particular composition: a building may have class rooms, offices, laboratories, Libraries, among other spaces. With AMI system availability for each building, through KPIs It is possible to assess each building's contribution to total consumption at the campus, as Figure 5 and Equation 4 show.
Each building's contribution to total power consumed relative to the campus total is variable, and also it does not depend on the size of the area nor the nominal installed power. In Figure 6, you can see that In each case consumption patterns are different: the Economics building's (blue line) primary usage relates to classrooms the Engineering building (green Line) has classrooms and administrative offices, in contrast to the Chemistry laboratory (red Line) which has a pilot facility with laboratory equipment for the purpose of teaching and research. It Is evident that consumption patterns vary according to day of the week and the usage that each building has; nonetheless, It Is possible to Identify the time at which more energy Is consumed, though there Is not enough Information to Impact on consumption patterns.
PROPOSED INDICATORS
Based on the availability of Information concerning building on-line consumption and building on LAB+I database Interaction, there are new Energy Indicators that make It possible to analyze Interdally time windows, also which Include Information directly associated with consumption patterns.
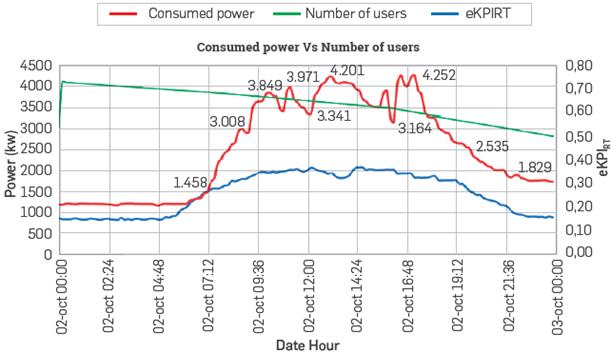
The eKPIRT presented before In Equation 1 could be calculated for different conditions. The number of users has been obtained from system-reported Information from the number of user Internet connections. In relation to the campus In Figure 7, campus' overall consumption eKPIRT Is shown for a typical week. It Is evident that consumption characteristics are associated to bad practices that represent Improvement opportunities: both the quantity of users and consumed power between 9 pm and 6 am (Interval during which no academic activities are carried out at the University) reflect a higher Indicator value than expected. Also, it Is observed that the eKPIRT value does not stay constant, showing that campus users present different energy consumption according to the hours and day of the week.
A detailed study of the dynamics of consumption at the university campus has been conducted as a base case In the Engineering Building (453) due to this building presenting different end uses, such as for administrative offices, classrooms, auditoriums, ancillary services, among others. Controlled experiments (relating to switching on-and-off) have been carried out in order to assess the perceptual participation of each type of Load relative to total building consumption, taking into account the electric system's actual use. For example, lighting and loads such as computers and printers are used simultaneously in offices.
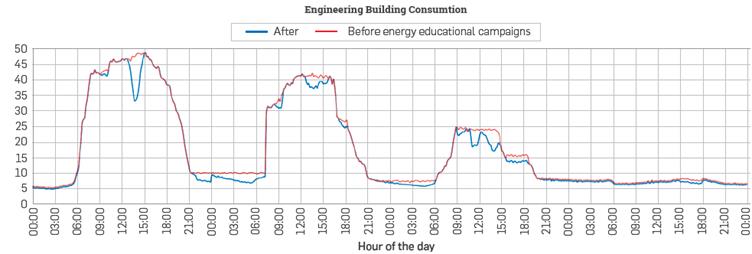
Historical building consumption has been analyzed for three typical months. Similar consumption behavior had been found from Monday to Thursday, with a variation in average daily energy consumption of 2.54%. Friday shows a different dynamic of consumption due to the fact that, on that day, there are no scheduled classes after 2 am and administrative offices close at 4 pm, On Saturday, there are academic activities until 2 pm. Sunday is a day of rest. Daily consumption profiles are shown in Figure 8: a significant drop is observed during the middle day from Monday to Thursday. This s caused by workers who turn off Lights and turn computer equipment to Low-power modes while they have Lunch. This action has been accomplished thanks to energy-related educational campaigns.
The eKPIRT proposed in Equation 2 shows the dynamic of daily consumption associated to each end use. Figures 9 to 11 show each end use's interdaily contribution for the week,
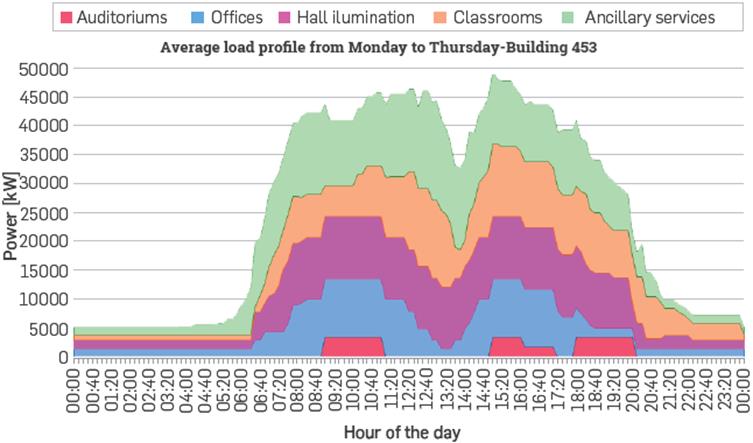
In Figure 9, it is shown that energy consumption s related to the particular activities for each hour. For example, ancillary services start activities at 6 am; near midday, additional Loads such as microwaves and copy machines are used. From 6 to 8 pm auditorium and classroom Loads are used while office Loads decrease, in terms of the overall average per day, the auditoriums' energy consumption is 3.5%, office consumption is 18%, Lighting consumption is 25.1%, classroom consumption is 23.8% and ancillary service consumption is 29.6%.
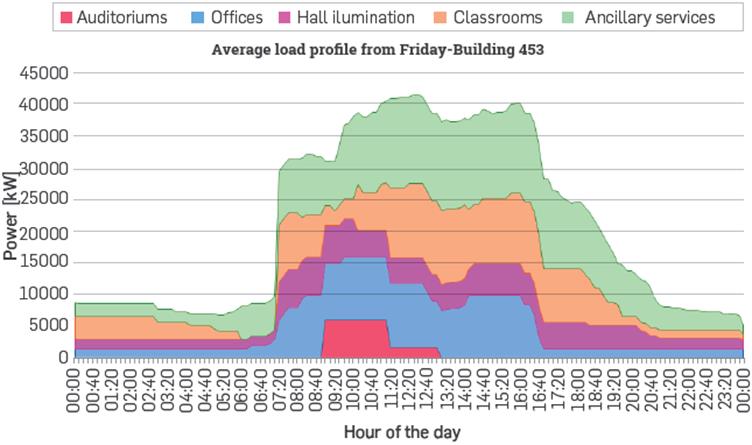
Figure 10 shows Friday's demand. Consumed energy in office hours is 64%; the remaining 36% is consumed during non-office hours, Analysis of different final uses shows changes every hour of the day. Some cases stand out, such as ancillary service consumption reaching 14.6% (75.65 kWh.) from 5 pm to 6 am.
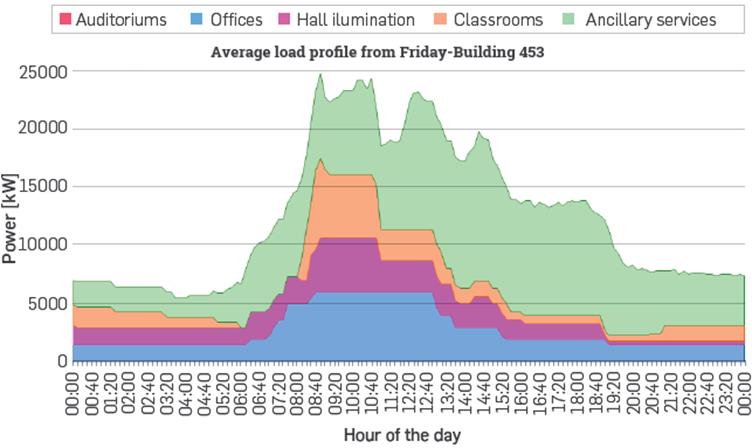
Figure 11 corresponds to Saturday consumption. It is evident that some loads increase, such as ancillary services.
A comparative analysis of these daily consumption patterns makes it possible to infer information related to consumption:
Each end customer's contribution is not directly proportional to building total consumption during every hour of the day. Different loads are used according to the specific necessities.
Primary consumption of energy is not only associated to teaching activities. On the whole, classroom (orange strip) and auditorium (red strip) associated consumption is less than ancillary services (green strip) consumption.
Energy consumption in office hours versus non-office hours does not align with prospective expectations. This indicates that high energy consumption is present in early hours in offices and for hall lighting.
Dynamics for auditoriums and classroom consumption vary simultaneously with class hours. Office consumption depends basically on the office schedule. Energy waste associated with ancillary services does not follow predictable patterns and varies during the day.
RESULTS ANALYSIS
ENERGY KEY PERFORMANCE INDICATORS IN REAL TIME
The case study presented for the Universidad Nacional de Colombia-Bogotá campus, can be taken as specific documentation that serves as a reference for the preparation of new energy indicators, such as eKPIRT. In order to develop new Indicators, we propose:
Understanding the parameters that influence the dynamics of consumption: end usage of the place under the study, day of the week, hour of the day, among others.
Establishing a parameter for each indicator, so that real energy saving opportunities can be found.
Assessing indicator visualization frequency.
Establishing each indicator analysis’ variables and values.
Incorporating economic evaluations of energy performance.
Including, if any, high consumption loads such as air conditioning, elevators and motor pumps.
DEMAND-SIDE MANAGEMENT STRATEGIES
Given the information provided by eKPIRT, different strategies can be proposed to modify each end use consumption pattern It is important to recall that everyday people on campus do not pay for their consumption directly; therefore, DSM strategies must be different to traditional programs based on time variable rates [42]. Other mechanisms and actions are proposed:
Optimization of energy consumption per user: As shown in Figure 7, this KPI has high variability for different times of the day. It Is logical that a group of users does not consume the same amount of energy every hour of the day. For example, in the evening, lighting can increase consumption levels. Table 1 groups average eKPIRT values by different hourly segments of similar behavior.
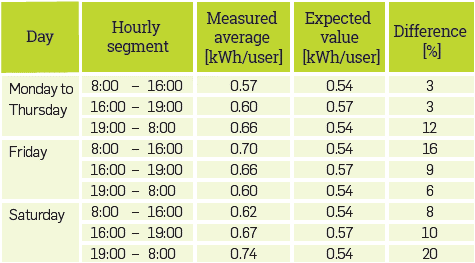
The detailed analysis of the relationship between power consumed vs. number of users provides evidence that in working days, towards the 4 pm, the number of occupants at the campus decreases at a significantly greater ratio than energy consumption. This might happen because after people leave their work and study areas, they Leave the lights on and the computers and devices connected to the grid. This represents a power-saving opportunity. There are a range of potential savings opportunities (of between 3% and 20%) for the different hourly segments.
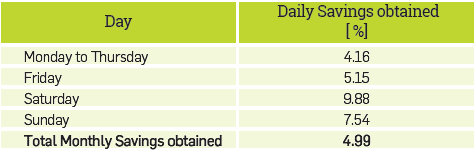
Voluntary management: covers all the consumption-related actions that the user changes voluntarily based on information availability in real time, historical consumption values, public dissemination and projections, and encouraging an energy saving culture. Energy educational and awareness campaigns are needed, which are focused on rational use and good practices.
In the case study, via educational campaigns, savings of 7.3% were made at peak times of daily consumption. This represents savings of 4.99% in monthly energy consumption. This was shown previously in Figure 8. The savings calculations obtained were made by calculating the area under the curve and are summarized in Table 2
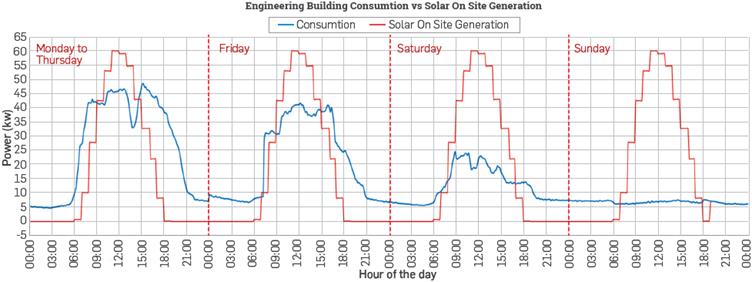
On-site generation: own energy sources available to meet Local energy needs. This reduces energy requirements from the electric system. Photovoltaic panels on buildings' roofs would straighten supply-demand from 10 am to 4 pm, without associated batteries. Figure 12 shows average consumption curve for the building under study and a generation curve that corresponds to the photovoltaic generation which could be installed in the building. In this way and for the case study, energy savings of 40.26 % can be obtained, reducing the energy required from the electric grid.
Energy efficiency: refers to permanent changes regarding equipment and definitive improvements to a system that imply immediate and permanent energy savings. Arrangements made, such as enduse equipment technology replacement (guaranteeing better efficiency), are included in this category. Also included are electric infrastructure improvements that enable independent and unbundled circuit control. Specific savings that would arise via replacement of lighting, should consider not only power consumption but also hours of use.
The results obtained within this case study show that consumption dynamics vary at different times during the day in both cases, i.e. the energy value associated with each user and the one associated to each end-use. Also, energy consumption profiles are affected by the day, the week or the season of the year. Table 3 presents an overview of the percentage effectiveness per month associated with each DSM strategy.
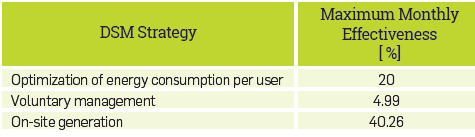
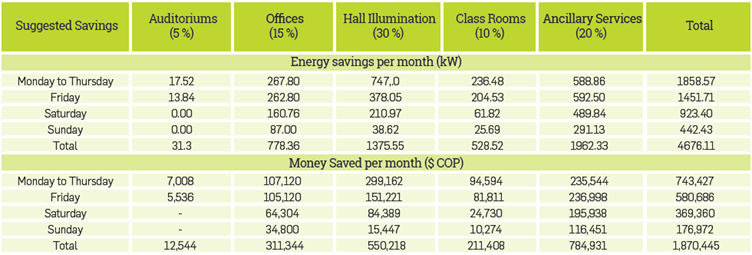
Table 4 shows a savings case that would be obtained if each of the end uses decreases perceptually, through different DSM strategies implementation (without including on-site generation). For example, during auditorium usage hours there is minimal consumption flexibility, due to the electric load is associated with lighting, which is an essential service. There is a 15% reduction proposed for offices in terms of savings during non-office hours that would be achieved through voluntary management. By the same token, a 10% reduction is planned for classroom consumption. In order to reduce consumption relating to hall lighting during every hour of the day infrastructure improvements and technological replacements are required. Ancillary services need a combination of strategies aimed at reducing consumption.
CONCLUSIONS
On the basis of the case study, an experimental design was envisaged that makes it possible to set and validate energy performance indicators for buildings.
It was discovered, through actual values for energy consumption, that Intra-daily and Itemized information on consumption is needed in order to set KPIs. This underscores the importance of AMI both to global consumption measurements and sub-metering processes, in accordance with the end-uses of energy or particular zones.
The KPIs presented in this paper led to the conclusion that effective DSM strategies can be deployed with the guarantee of money savings on energy consumption, notwithstanding that no intraday differentiated tariffs are charged to the client.
Campus load profile visualization through AMI makes It possible to create specific KPIs that accomplish aspects that are needed in order to obtain savings, and also to identify energy savings.
In order to manage demand, it is fundamental to have a KPI that would make it possible to ascertain, in a dynamic and intra-day manner, the energy consumption per user; because that is the way to provide evidence of situations related to poor practices and the need for technological replacement. In the case study, potential savings were identified of up to 20% per capita consumption in different hourly segments.
The implementation of mass campaigns that promote the culture of energy-saving has a positive impact on users' consumption patterns. In the case study, the KPI Implemented provides evidence of daily energy savings up to 5% attributable to this process. Therefore, energy education can be regarded as a DSM strategy.
The eKPIRT availability makes it possible to properly estimate potential savings associated with technological replacement relating to lighting
The dynamic nature of eKPIRT Increases its importance and validity as performance indicator that enables monitoring of energy efficiency behavior and related decision making. eKPIRT implementation enables DSM strategy implementation that makes it possible to modify energy end-users' consumption patterns.
The eKPIRTs shows that the dynamics of consumption vary at different hourly segments of the day in both cases, i.e. energy value per capita and the one associated with each final-use. This is why DSM strategies have reached different effectiveness levels and should be combined to achieve optimum results. In the case study energy savings of 5% - and even up to 40% - were made.
Energy savings targets must be proposed in time units consistent with changes in values for power consumed. When daily Load graph is dynamic, targets must have that interdaily feature.
When a cumulative monthly savings target is defined for which compliance can only be verified at the end of a period, this target does not make it possible to assess the factors that influence savings.
In order to correctly assess the load fora building vs. total consumption for the campus, it is not sufficient to have information about its area or installed power; you also need information about the parameters associated with the dynamics of consumption for each end use in the building.
Inter-dally and comparative consumption analysis for buildings makes it possible to find useful information for the electric system, such as peak demand coincidence. This makes it possible to predict optimal system operation, addressing the coordination of protection and the substitution of generated energy,
DSM strategies must consider aspects such as energy end-use, consumption's hourly flexibility and labour dynamics.
Regarding future work in this area, on the basis of the experimental development envisaged in this paper, it should be pointed out that it would be appropriate to develop eKPIRT to target industrial processes. It would also be useful to Include economic evaluations in future indicators.

