1. INTRODUCTION
Tracer tests were developed to identify groundwater movement in the early 1900s, being of little interest to the oil industry until the mid-1950s [1], Oil industry development and especially reservoir engineering advances have made tracer technology an excellent alternative to determine the dynamic behavior of flow and to monitor the movement of the different injection fluids in enhanced oil recovery processes. The integrated methodology for the execution of the inter-well tracer test presented in this article can significantly reduce the uncertainties about the reservoir continuities and directional features in a reservoir before and after an enhanced recovery process. Likewise, this article demonstrates how tracer technology has been successfully used in Colombian oil fields to improve IOR/EOR projects.
A tracer is an inert substance that follows the fluid path, traveling along with fluid present in the reservoir without any undesirable reaction. This technology allows engineers to understand certain phenomena during the transport of fluids within the porous medium [2]. In general, tracer tests involve two critical elements: the injection of a chemical into the reservoir and the control of its recovery over time in several producing wells for its subsequent quantification and analysis.
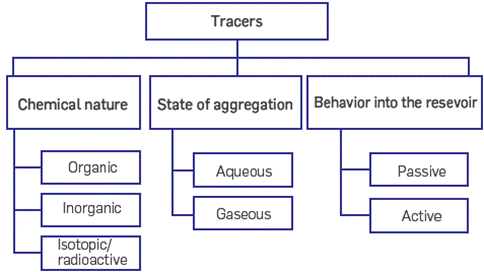
The tracer classification is broad and varies according to the test purpose. Three groups are commonly identified according to their chemical nature, state of aggregation, and behavior into the reservoir. The following figure (Figure 1) presents the general tracer technology classification
A tracer must have the following characteristics [1] [3]:
Remain in the injected fluid and being chemically stable
Travel at the same speed as the injected phase
Non-toxic / environmental friendly / low cost
Easy to detect in the production fluids
Do not alter the flow direction or affect reservoir permeability
Typically, it is no present in significant quantities in the reservoir
Should not be filtered or adsorbed by the porous medium
Remain in the injected fluid and being chemically stable Travel at the same speed as the injected phase Non-toxic / environmental friendly / low cost Easy to detect in the production fluids Do not alter the flow direction or affect reservoir permeability Typically, it is no present in significant quantities in the reservoir Should not be filtered or adsorbed by the porous medium
The implementation of a tracer test can be carried out with different well configurations, including injection and production through the same well or single well tracer test (SWTT). These tests are generally performed in an injection-production mode, in which the tracer is injected until reaching a defined investigation radius and subsequently produced. The/ other type of test is developed in well patterns or inter-well tracer tests (IWTT), where the tracer is injected through an injector, and its production is monitored in one or more producers.
The physical phenomena (static and dynamic) that occur during tracer injection in a reservoir are dispersion, diffusion, convection adsorption, desorption, ionization, all of them combined with chemical reactions. Each of these processes must be considered in the tracer test design and during the interpretation of the tracer's response. Analytical and numerical modeling try to replicate them, even when certain conditions of the reservoir are unknown in advance [4]
A critical parameter during test design is the amount of tracer to be injected capable of being detected in producer wells. Analytical methods commonly used for estimating the mass of tracer required combine different reservoir engineering techniques; three of the most important are described in Table 1.
Table 1 Tracer quantity calculation methods.
| Method | Characteristics | Formula | Observations |
| Total dilution | Concentration is estimated with the assumption of the uniform dilution of the tracer in the contacted volume. |
|
A safety factor (generally equals to 10) is used to obtain an average concentration of 100 times the minimum detectable limit (MDL) and a correction factor (F). These are based on the non-symmetry of barriers, location of wells, production of external water to the pattern, and other restrictions that may modify the drainage area [1]. |
| Brigham and Smith Model | Analytical solution of the diffusivity equation. It considers longitudinal dispersion in the flow direction and no communication between layers. |
|
Limitations: Only applicable to five-point patterns and dispersion is assumed to be due to divergent flow only [5][6]. |
| Abbaszadeh, Dehghani and Brigham Model | Extension of the Brigham and Smith model for any repeated pattern where the unitary mobility ratio limitation, between injected fluid and formation water, is met. |
|
It relates the amount of tracer injected with the produced tracer concentration peak based on the pattern geometry and reservoir properties [7-10]. |
The interpretation of a tracer test can be performed using qualitative and quantitative techniques. For example, the evaluation of hydraulic connectivity between wells can be qualitative information. On the other hand, estimation of reservoir parameters using analytical models corresponds to quantitative data.
Some analytical solutions to the diffusivity equation for the interpretation of tracer tests are available in the literature[11]-[12] [5]. Also analytical models assuming homogeneous reservoirs have been proposed [10][13]-[19]. Likewise, there are models representing the tracer flow through non-homogeneous media such as stratified reservoirs and naturally fractured reservoirs, where different conditions for the matrix and fracture are taken into consideration [20]-[25].
The most popular solution in the oil industry for the analysis of tracer tests is the Method of Moments (MoM), which does not depend on unknown properties of the reservoir for calculations [26]. Deans [27] was the first to introduce residence time analysis to interpret tracer tests in the petroleum industry. The use of residence times was initially developed by Danckwerts [28] to describe the flow in chemical reactors. It was extended by Deans to determine swept volumes in the reservoir, as well as by other authors to estimate the residual oil saturation and heterogeneities [28]-[31].
The tracer distribution curve analysis is performed by relating the moments of the distribution curve with possible flow models in the reservoir. The first moment of the curve is the mean residence time, representing a probability distribution that describes the amount of time that a differential element of fluid can spend within the reservoir. The second moment (the variance) can be related to the Peclet number, which denotes the relationship between the convective and dispersive forces. From these moments, the variations of the flow conditions in the reservoir can be described.
If the tracer is injected into the reservoir as a pulse and there is no recirculation into the formation, the method of moments can be used to estimate the swept volume (VSij) and the tracer production data [29][31]-[32]:
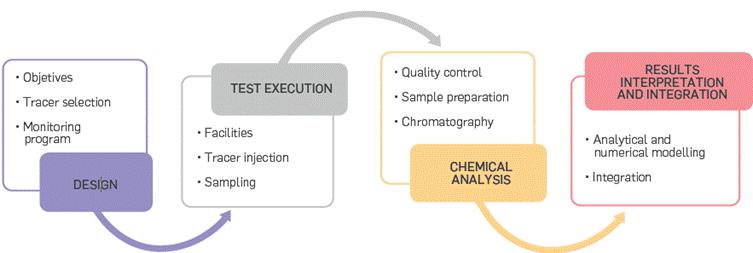
Based on the models mentioned above, the integrated methodology for the execution of the inter-well tracer test presented in this article was developed. The steps considered at each stage are described, from the design, implementation, chemical analysis, to the interpretation and final integration of the results.
In terms of Colombian experiences, tracer test applications have been mainly running to monitor waterflooding processes or to evaluate the feasibility of applying chemical conformance. IWTT test campaigns have been carried out in different fields such as Caracara Sur, Casabe, Toldado, San Francisco, Palo Grande, Chichimene, Castilla, and La Cira. These tests objectives were to evaluate connectivity between wells, identify cases of injected water channeling, estimate contacted pore volumes, and effective permeability. Additionally, the experience with the SWTT tracer test implemented in the Caracara Sur field to estimate remaining oil saturation and evaluate the efficiency of an EOR process was the first implementation in Colombia [33].
2. THEORETICAL FRAMEWORK
Tracer project evaluation requires integrating dynamic data of the reservoir obtained through different sources such as pressure tests, production-injection history, water cut, WOR, injection profiles, and static information from well logging and geology. This integration looks to understand the fluid transport processes that occur in the porous medium. Based on experts criteria, the development of inter-well tracer tests can be divided into the following four stages [2][34]-[36]:
Test design: First step, which corresponds to the definition of the test objectives. It involves identifying the target wells, type of injection-production arrangement, selecting the type and quantity of tracer, injection scheme, sampling schedule and analysis of samples, and identifying the impact of tracer recycling.
Test execution: This is the operational stage, between design and evaluation. It embraces all the field requirements, including transporting the tracer to the location, organizing injection facilities, executing injection protocols and disposal of materials, and executing the monitoring schedule.
Chemical analysis: Laboratory phase, which corresponds to the tracer analysis of the samples collected in the field through experimental protocols and quality control of analytical results.
Results interpretation and integration: In this stage, the engineers evaluate the results gathered from the previous steps. Some qualitative and quantitative parameters are obtained after analyzing laboratory tests, tracer arrival times, tracer production curves, and the preferential direction of flow. This phase involves mathematical and numerical modeling.
A critical element of tracer testing's success is the integration of all knowledge areas of the team, such as reservoir engineering, geosciences, field operations, and tracer technology specialists [36]. The scheme of the proposed methodology is presented in Figure 2.
TEST DESIGN
The first stage of this methodology is the tracer test design, which involves essential parameters such as the tracer's selection and amount, planning the acquisition, injection of the tracer into the reservoir, analytical strategy, sampling schedule and, detection limits, among others [37].
The first element in the designing stage is to determine what information is required from the tracer test and then selecting the injection and producing wells according to the needs and objectives of the test. Monitoring producers could be an economic decision since, according to previous experiences, sample analysis represents around 60% of the project's total cost. For this reason, wells in which some type of connectivity has been identified through other sources of information should be selected in advance [38]-[39].
The amount of tracer injection can be calculated by any of the methods presented in the previous section. However, the total dilution method is the most widely used in the oil industry due to its simplicity. It does not include mechanical dispersion, which is a property with high uncertainty. The tracer's mass (or volume) estimated must ensure that is enough concentration to be detected by the analysis equipment once it comes out in producers [40]. Numerical simulation with an available and well-matched reservoir model can be used to verify the amount of tracer calculated by analytical methods and estimate the tracer breakthrough time and concentrations.
The sampling frequency should be established within the monitoring strategy according to the conditions identified in the injection pattern. The primary considerations to take into account are: monitoring the appropriate wells, not losing the tracer breakthrough, obtaining adequate profiles of produced tracer, making correct calculations of the volumes of produced tracer, and optimizing the cost of monitoring [36][41]. In the literature, several sampling schemes proposed by different authors can be found, which in some cases are a function of the tracer breakthrough time [35]-[36],[41]-[46].
Although it is common to observe the design of tracer injection-monitoring schedules using from spreadsheets to numerical simulation models, these techniques are not recommended without adequate reservoir analysis which includes:
Fluid production-injection history.
Production (PLT) and injection (ILT) logs.
Diagnostic plots (Hall or Chan among others).
Stratigraphic correlations.
WOR vs. Np.
Mechanical condition of injectors and producers.
The example of the integration of reservoir engineering tools is illustrated in Figure 3, showing the WOR vs. Np plot of two 5-well patterns (inverted and regular). Based on Figure 3a, the behavior of the produced fluids, the injected tracer would flow first through wells P1 and P5 due to the rapid and abrupt increase in WOR just after water injection have started (red triangle). Next, theoretically, the tracer would be detected in wells P2 and P4 in this chronological order.
A way to validate the breakthrough sequence aforementioned is by verifying the pattern dynamic balance (replacement factor = 1). Also, the BHP in the producers does not present a very high variation that may cause the preferential flow due to a high drawdown between injection and production. The latter layer can be interpreted as a high flow capacity (Kh) layer. Therefore, it is essential to understand the wells' operational conditions for designing a tracer test.
Figure 3b describes an injection pattern with a producer well confined by four injection wells. The WOR vs. Np plot suggests that increasing water production comes from injector wells I1 and I2 (symbolized by the red and yellow triangles). In this case, the analysis should combine the interpretation of the well to well injection-production history (e.g., I1 P5 and I2 - P5) and the information on well completion and injection profiles (orange and blue triangles represent the beginning of the injection in wells I3 and I4, respectively). Although the production of oil banks that appear as valleys in the WOR vs. Np plot is observed, these may be associated with injection into wells I3 and I4 or from secondary channels with lower flow capacity (Kh) from injectors I1 and I2.
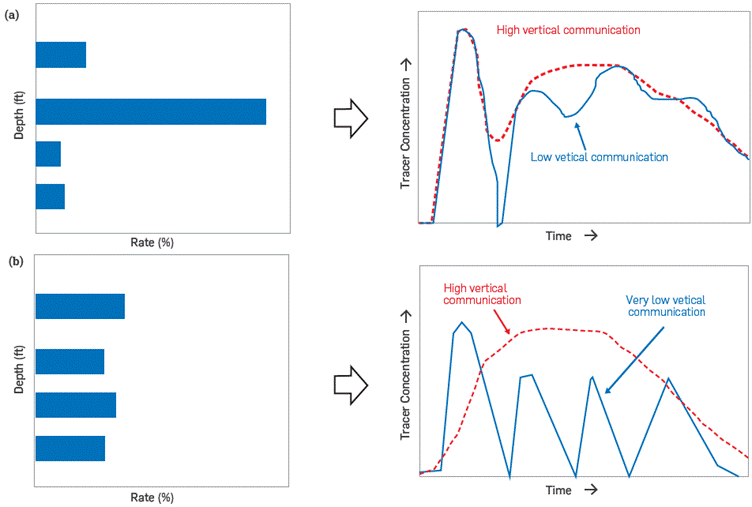
A stratified reservoir with low vertical communication (Kv/Kh) should be monitored more frequently than one with high vertical communication. If the monitoring frequency is not correct, the tracer response curve will not represent the reservoir's reality, including the loss of tracer breakthrough in the producing wells.
Figure 4a corresponds to the injection profile and the tracer production curve for a stratified reservoir, where a high sampling frequency is necessary from the beginning of the test. This type of profile suggests a rapid channeling of the injected water. The channeling is due to the presence of fractures or channels with high flow capacity (Kh), which implies that the tracer's irruption occurs in periods of hours to a few days.
Figure 4b presents the injection profile and the tracer production curve for a homogeneous reservoir where the sampling frequency may be high from the beginning to the breakthrough and may subsequently decrease.
Heterogeneity and vertical communication are critical parameters to consider during the design of the sampling schedule to capture a correct tracer response. In this case, the sampling frequency must be high to avoid losing the different peaks and valleys describing hydraulic channels. It is also essential to take into account the information on the injection profiles, regarding the possible tracer breakthrough in the producer wells.
In a stratified reservoir with very low or no vertical communication between the layers (Kv/Kh between 0 and 0.1), it is reasonable to expect tracer concentration curves like those of the injection profile (blue line, Figure 4b). However, sampling must be maintained for a long time to identify each of the hydraulic channels. Figure 4 summarizes in general how to correlate injection profiles with the tracer response curve according to heterogeneity and the existence of preferential flow channels
TEST EXECUTION
The next stage of the methodology is the execution of the field test, which involves the tracer injection and the producing wells monitoring. In general, tracer injection (Fluorobenzoic Acids -FBAs specifically) does not require unusual surface facilities. A simple pumping kit consists of two reciprocating pumps. Essential elements, such as mechanical mixers to perform the tracer dilution and a storage tank, are enough for the tracer injection. It is common to find all these elements coupled to the same vehicle that simplifies the mobility to different well locations.
The chemical tracers (FBA) usually are solid-state (pulverized), which requires the solubility of the FBA in water (with neutral pH). The tracer is mixed with a base (caustic soda) in a one-to-one relationship, looking for an acid-base reaction that produces a salt with higher solubility in water. An example of the chemical reaction of an FBA with caustic soda is presented in Figure 5.
The tracer injection can be performed as a pulse or as a continuous injection, the former being the most used for technical and economic reasons [35]. In both cases, the operating conditions must be controlled, particularly the pump and the wellhead pressure. Furthermore, different tracers can be injected into the same well through a selective completion, ensuring the insulation of the layer of interest [47].
Sampling is one of the most critical stages in tracer projects due to the information obtained from the samples collected. Even though it is the cheapest stage in the project, it is the one that requires logistics organization and operational control.
A tracer test's success depends on adequately completing the sampling schedule established during the design stage [35]. Samples can be collected directly at the wellhead or in a test separator, ensuring that the water sample is representative of the monitored well. Sampling generally involves the challenge of separating water and crude oil, especially when the collection is made in the wells and not in the separator [1].
It is imperative to mention that the collected samples must be correctly labeled with details such as the name of the well, date and time of the sampling, and stored in a suitable environment under conditions of pressure and temperature that does not deteriorate or contaminate the sample.
CHEMICAL ANALYSIS
The third stage of the methodology corresponds to the experimental analysis of the samples collected. Advanced analytical methods allow detecting very low tracer concentrations depending on the equipment resolution up to parts per trillion.
Because testing one sample can cost around USD 200-250, it is not feasible to analyze all taken samples. The selection of sample evaluations must be planned in the designing stage, where the tracer breakthrough must be capture for the analysis.
Along with the analysis, when a tracer is identified, previous samples will be analyzed to determine the exact moment of irruption. The irruption is confirmed when the tracer is detected in three consecutive samples. On the other hand, when no tracer is identified in the selected sample, a subsequent sample will be analyzed, and the described procedure will be repeated.
Currently, state of the art ultra-performance liquid chromatography coupled with tandem mass spectroscopy (UPLC / MS-MS) is used to quantify chemical tracers such as FBAs. The detection is achieved through derivatization processes carried out on the samples collected in the field, allowing detection limits up to parts per trillion (ppt) level. The advantages of this methodology are simplicity, speed, and high sensitivity. A drawback is a necessity to guarantee the complete reaction of the derivatizing reagent. Detection could be affected by interference due to the excess of the reagent or the production of different derivatives components.
INTERPRETATION
The last stage of the integrated methodology and, therefore, the final objective of an inter-well tracer study is to interpret the tracer response, integrate results, and estimate parameters of the rock-fluid system. Integrating test results with available data gives a better understanding of the fluid flow in the porous medium, and not only the verification of the communication between the injector and production wells [37].
Interpreting tracer tests can be performed from three levels of complexity, which encompass qualitative, analytical, and numerical interpretation. This classification involves a simple task and also a more complex analysis of the test to solve the inverse problem [34][48].
The qualitative interpretation is made by observing the response curves (tracer concentration recovered against time) looking for qualitative properties of the pattern, such as the existence of high-permeability channels, barriers and fractures between wells; communication between different layers, stratification in the reservoir; and preferential flow directions [24][49]-[51].
To illustrate the explanation, the continuous curve in Figure 4a corresponds to a high permeability channel, while the dotted curve in Figure 4b corresponds to a reservoir with less vertical heterogeneity. Each peak in curves corresponds to a particular reservoir unit, and this can be verified with an injection profile, as presented in Figure 4. However, false negatives may exist. In other words, the absence of a tracer in a given well does not mean the lack of a flow pattern between the injector-producer wells. If additional information is not available to corroborate the statement, it can only be inferred that for the evaluated conditions, the tracer does not flow at a concentration sufficient to be detected [4].
In reservoirs with high vertical communication or massive formations with low clay intercalations (flow barriers), the tracer production curve would show no inflections, suggesting a high level of tracer dispersion in the reservoir (dotted red line in Figure 4a). This scenario tends to show a low recovery of the injected tracer. However, formations with limited vertical communication, the tracer production curve may indicate some inflections that represent these barriers between the different flow channels (solid blue line in Figure 4a). On the other hand, Figure 4b corresponds to an example of possible tracer production curves in reservoirs with high and very low vertical communication from an injector well with a balanced water injection profile. Each peak presented on the solid blue line in Figure 4b represents a hydraulic channel for a low vertical communication reservoir. At the same time, a high Kv/Kh generates a tracer response curve where only one wide bell is identified (dotted red line).
It is essential to take into account the injector's behavior, observing that there are no infectivity losses that can negatively influence the interpretation of the trace test. It should be verified that the injection pattern is not in filling upstage, especially if the pressure is suspected to be less than the saturation pressure or there is evidence of free gas. The presence of a gas cap will modify the flow lines due to hysteresis and trapped gas, negatively impacting the tracer test's interpretation.
The quantitative analysis is more complicated than the qualitative interpretation and requires a series of assumptions about the reservoir conditions and the tracers' flow behavior. Mathematical models and numerical simulation are used in this type of analysis, each of them with its particular assumptions and limitations due to differences with reality [29][48][52].
Mathematical modeling uses different solutions for the diffusivity equation, where rock-fluid system parameters can be obtained by solving the inverse problem, minimizing the difference between the responses observed in the field test (tracer production curve) and the predictions by the selected analytical model. The model must appropriately represent all the processes that influence the tracer flow through the entire reservoir [2][53]-[56].
There are different techniques for solving the inverse problem, including deterministic simulation, genetic algorithms, partial differential equations, and gradient-based methods [55]. Inverse modeling consists of three main components:
An initial mathematical model of the system under study.
An objective function that allows calculating the deviation between the model prediction and the actual behavior of the system (tracer response curve).
An optimization technique to minimize the objective function and improve the estimation of the model parameters.
Using tracer tests for inverse modeling allows to obtain or update variables to calibrate the existing geological model of the reservoir.
The most widely used analytical model for inter-well tracer tests is the method of moments. This method helps to analyze the residence time distributions, estimate the total pore volume swept by water and sweep efficiency, construct a flow-storage capacity diagram, and estimate the Dykstra-Parsons coefficient [29].
The importance of numerical simulation for interpreting the results of a tracer test lies in obtaining parameters of the fluid-rock system through the simulation of tracer injection in the reservoir with a finite-difference simulator or "streamline" [2][57]. In cases where there is a reliable simulation model, the tracer simulation application can generate some important advantages for better characterization of the reservoir in terms of fluid flow paths, reservoir continuity, transmissibility and flow barriers.
However, a simulation model with an incorrect injection profile can show a satisfactory matching of pressure and water cut if the models are matched for oil production instead of total fluids. When the model is matched for oil production, the behavior of water production (where the tracer will travel) is generally not representative and can generate errors (Figure 6). This error generates a difference between the real production history (solid blue line) and the production history obtained through the simulation (dotted black line). Adjusting the tracer production history, helps to identify potential simulation model errors [58]-[59].
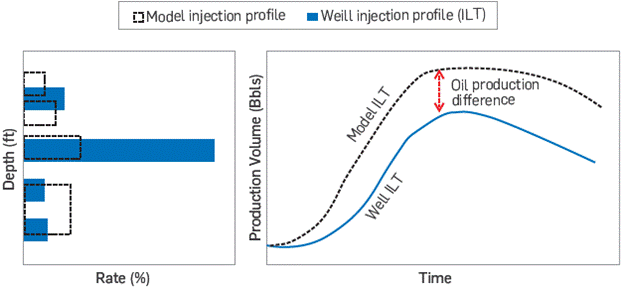
Figure 6 Difference in predicting oil production due to the non-incorporation of dynamic information in simulation models [60]
In general, some of the benefits of integrating the results of the tracer test with other sources of information are:
Redefining and calibrating geological models.
Adjusting the extension of the layers (as in the case of Figure 6),
To incorporate or eliminate reservoir characteristics, such as flow barriers, vertical communication, or high permeability channels.
TYPICAL TRACER COST DISTRIBUTION
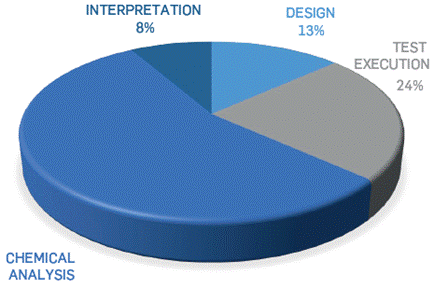
As additional information, Figure 7 presents the distribution of the cost of a typical tracer test carried out in a Colombian field according to the stages proposed in the integrated methodology. Design costs refer to the cost of tracer acquisition. Meanwhile, test execution encompasses the cost of injection equipment, sampling, sample storage, and consumables.
The most significant economic impact on a tracer project turns out to be the chemical analysis of the samples, mainly due to the high volume of samples and the unavailability of specialized equipment in the country for this purpose and need to send samples abroad
3. EXPERIMENTAL DEVELOPMENT
The application of the described methodology of tracer injection ncludes an implementation of a tracer test at a laboratory scale and the second application in a field case operation. Both cases presented look fora better understanding of the proposed workflow.
LABORATORY TEST
During coreflooding evaluations, tracer tests help to understand the behavior of the fluids and validate relevant parameters for the technology assessment's feasibility studies. The following case corresponds to a polymer flooding evaluation in the lab and how the tracer test helped to evaluate dynamic adsorption of the polymer (a critical value for field implementation). Since polymer flooding is widely applied as cEOR [61], the application in experimental assessment of tracer combined with this technology becomes a relevant contribution for the EOR community.
In this case, 0.1 PV of KCl was injected as a tracer before and after a commercial HPAM polymer flood in a Berea core 100% water-saturated to monitor the polymer injection. The following table shows the core characteristics:
Table 2 Polymer Lab test characteristics for tracer test evaluation.
| Property | Value |
| Pore Volume | 70 cm3 |
| Porosity | 31 % |
| Klinkenberg permeability | 550 mD |
| Polymer concentration | 250 ppm |
| Injection rate of the tracer pulse (before polymer | 1 cm3/min |
| Polymer injection rate (after tracer) | 1 cm3/min |
| 3 cm3/min | |
| 5 cm3/min | |
| Injection rate of the tracer pulse (after polymer) | 0.3 cm3/min |
| Polymer injection volume | 100 PV |
| Tracer slug used in both tests | 7 cm3 |
The injection rate of the tracer pulse before the polymer was 1 cm3/ min. Tracer injection was followed by polymer injection at rates of 1 cm3/min, 3 cm3/min, and 5 cm3/min. Subsequently, a KCl tracer pulse was rerun at 0.3 cm3/min.
The decrease in the rate was due to a differential pressure presented evidencing a possible reduction of the hydraulic channel during the injection of polymer or subsequent water. The permeability values changed from 437 mD before the polymer injection to 23mD after the polymer injection. Using the method of moments (MoM), the estimated pore volume (PV) contacted by the tracer was achieved, as shown in Figure 8.
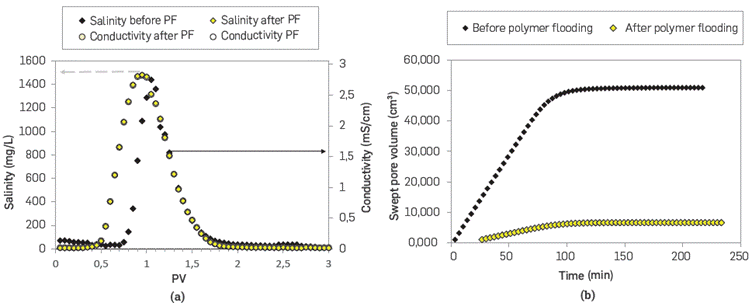
Figure 8 Tracer production curve (a) and swept pore volume by KCl (b) before and after the polymer flooding (PF)
Relevant variations in swept volumes by the tracer before and after the polymer injection show a decrease from 53 cm3 to only 6.7 cm3 (Equatiom 4). This permeability reduction was related to the decrease of the accessible PV for the flow of the second tracer njected. The results of this test suggested the high adsorption and retention of the polymer in the porous media evaluated, which discarded its application in the case studied.
Regardless of the results, this experiment represents an example to evidence the tracer breakthrough of both KCl tracer slugs (Figure 8a) The first KCl injection shows a tracer breakthrough approximately after 0.8 PV of water injected. However, the irruption of the second tracer slug was achieved around 0.4 PV injected. The early tracer breakthrough (=0.4 PV faster) recorded during the second KCl slug shows the impact of the permeability and PV reduction caused by the adverse polymer-rock interactions registered in this test. This example evidences the value of tracer injection to interpret fluid flow and possible interactions in porous media.
FIELD TRACER TEST
The described methodology was applied to evaluate the hydraulic communication in a water injection pattern using an inter-well tracer test. The area corresponds to a mature field located in northeastern Colombia, discovered in 1941. The main primary production mechanisms are solution gas and a weak aquifer. In the Late 1970s, water injection began to increase the primary recovery factor at that time (13%).
The data used for the tracer test design shown in Table 3 includes the selection of the 2,6 FBA tracer and the calculation of the amount of tracer using the total dilution method (Table 1) for one of the producing reservoirs. The correction factor (F) was assumed equal to four (4), considering that half of the injected water flows out of the pattern, and all producers are influenced by an injector well outside the well pattern of interest.
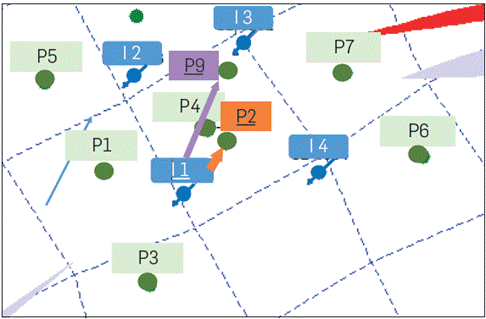
The tracer injection (I1) was performed in December 2017, and the eight producers of the irregular pattern were initially monitored for six months (Figure 9). During this period, the tracer was detected in only two producers. The first important conclusion of this tracer program is that the pressure support of injector I1 is deficient, given the lack of lateral communication in the area of study.
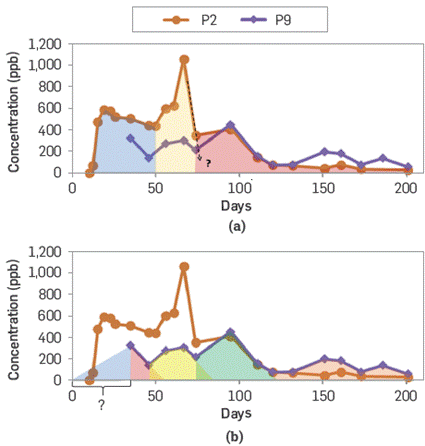
Figure 10 shows the tracer elution curves of the producers (P2 and P9). These curves will be briefly interpreted individually based on the main characteristics observed in each producer. It is worth to mention that producers P2 and P9 are a first and second row offset wells of the injector (II) respectively. From Figure 10, it is clear that the tracer analysis frequency was higher for the closest producer (P2) compared to well P9. This is a common observation in tracer programs were frequently assumes that producer located far from the injector should expect longer tracer breakthrough. Although this is a valid approximation, it is critical to consider a high sampling frequency in all wells in case additional tracer analyses are required.
Preliminary interpretation of the inter-well connectivity between 1 - P2 suggests the presence of three units of different flow capacities or K*h (colored areas in Figure 10a). Tracer breakthrough in producer P2 was observed after 12 days of its injection, suggesting a strong well communication in this first row offset producer. Peak tracer concentration was measured after 67 days, followed by a significant reduction in tracer concentration seven days later (the red region with the lowest K*h). However, no additional tracer analysis was reported until day 95, generating an uncertainty related to the vertical communication within the pay zone. Nonetheless, if there is a flow barrier between the first two colored areas (blue and yellow) and the red region of Figure 10a, that can be validated by incorporating well log information to confirm the presence of a pinch-out or shale barrier. As mentioned earlier, data integration is critical to obtain the most benefit from the tracer programs.
For the case of the tracer elution recorded for producer P9 (Figure 10b), no information about breakthrough times (BT) or maximum tracer concentration can be reported. The first sample analyzed was 35 days after the tracer was injected (light blue area in Figure 10b). Therefore, BT was missed in this well, probably nfluenced by the sampling plan established for the second row of producers. Comparing both tracer curves (P2 and P9), it can be qualitatively inferred that the flow units are similar. However, tracer concentrations suggest that the flow units from II towards P9 are of lower flow capacities compared to those observed between II and P2, except for the last flow unit (orange area after 120 days ir Figure 10b).
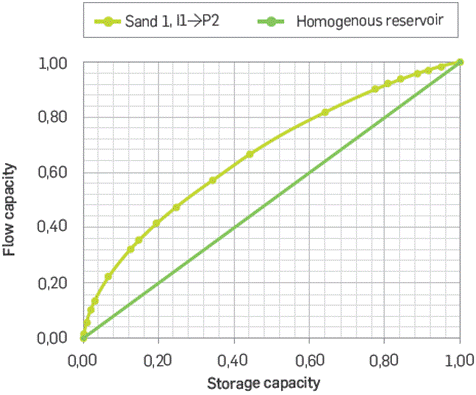
With the method of moments, it was possible to estimate that the oore volume (PV) contacted by the tracer between the injector llanc the P2 producer is 7,300 barrels (Equation 4), finding an accumulatec tracer recovery of 27% (Equation 5). Communication between these two wells is significant in terms of PV and conductive capacity, where 50% of the flow circulating in this sand is conducted in only 27% of its oore volume, as shown in Figure 11. The estimated Dykstra-Parsor coefficient is 0.43, and the Lorentz coefficient is 0.33, endorsing the heterogeneity observed in the flow capacity versus the storage capacity curve of flow unit (Sand 1) (Figure 11). The pore volume contacted by the tracer between the injector Hand the P9 producer s 2,100 barrels, finding an accumulated tracer recovery of 5,7%,
CONCLUSIONS
A robust integrated methodology is described that contributes to executing inter-well tracer tests to understand fluid behavior and rock-fluid properties,
The methodology involves all the necessary steps to implement a cost-effective tracer test, including the design, the execution of the field test, the chemical laboratory analysis of the collected samples and the interpretation of the results integrating them with information from other areas such as geology and petrophysics.
Three techniques for calculating the proper amount of tracer were presented, finding that the total dilution method is more appropriate due to the uncertainty in reservoir parameters,
The method of moments is a useful tool during the interpretation of the tracer test. Incorporating the variations in the flow conditions in the reservoir is possible to estimate the swept pore volume, the conductive capacity of the channel, and the Heterogeneity coefficients of the porous medium.
Inter-well tracer tests represent an essential tool for reservoir characterization, and its application to interpret waterflooding, conformance treatments and EOR processes is always recommended
The most significant economic impact on a tracer project corresponds to the chemical analysis of the samples. NOC's and services companies should promote strategies to reduce costs and support the implementation of tracer technologies.
The combination of analytical and numerical models for designing and evaluating tracer behavior has contributed to improve these evaluations


