English (pdf)
 Article in xml format
 Article references
 Send this article by e-mail
 Cited by SciELO
  Cited by Google
  Similars in
SciELO
Similars in
SciELO  Similars in Google
 Permalink
1. INTRODUCTION
It is well understood that reducing the viscosity of heavy oil wells results in materially better production performance, or in some cases, such as in Alberta's Athabasca oil sands, allows production from wells where the oil is otherwise not mobile at reservoir conditions. Due to the exponential relationship between temperature and oil viscosity, one of the most effective methods of reducing viscosity is to increase the downhole temperature. Steam injection has proven to be effective both in Alberta and globally, commonly, though not exclusively, through the use of Cyclic Steam Stimulation (CSS) and Steam-Assisted Gravity Drainage (SAGD) as well as their variants. Hot fluid circulation (either water [1] or oil [2]) schemes have also been tried with some success in reservoirs with a dead oil viscosity under 15,000 cp.
Downhole electric heating has been both contemplated ([2],[3]) and experimented with ([4],[5],[6],[7]) intermittently for many years but has historically been encumbered by the lack of reliable, long length, relatively high-power electric heaters. Recent technological advances, in the manufacturing of electric heating cables, have overcome these challenges and the early returns from the deployment of this new generation of electric heaters are indeed quite promising. Electric heating offers a simple and elegant complement to steam processes (either at the start or end of production life) or as an alternative to hot fluid circulation in areas where steam processes are not qualified due to the absence of caprock, shallow depth, thinness of pay, lack of lateral extensivity, or other challenging geologic features. This newly reliable, commercially available technology has the potential to benefit a wide range of reservoirs and holds potential applications around the world.
2. STATE OF THE TECHNIQUE
DOWNHOLE ELECTRIC HEATING TECHNOLOGY
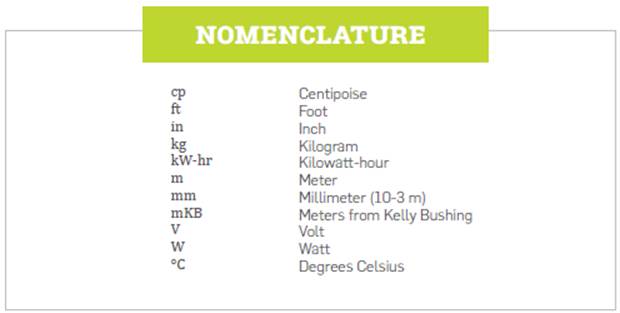
Downhole electric heating encompasses any process that delivers electricity converted to heat and subsequently transferred to the reservoir that improves or allows for better oil mobility. High-wattage electric heating technology relies on relatively large (>20mm), stainless steel sheathed, MgO mineral insulated (MI), electric resistive cables that can withstand a high voltage input (>3000 V). A schematic of such a cable is shown in Figure 1. These cables are then packaged as a complete system that delivers substantial thermal energy to oil-bearing reservoirs. This is accomplished by providing a downhole heater, connected to a surface power and control skid, which takes high line input power (or power produced by genset) and delivers this energy to the downhole heating cables in a controlled and efficient manner. Downhole reservoir monitoring instrumentation, all necessary installation and commissioning services, engineering and technical services may also be included as part of a turnkey package. The downhole heaters may be deployed or installed either by clamping MI cables (heating elements and integrally joined cold leads) to the exterior of downhole production tubing, deploying the heating cables encapsulated in coiled tubing or via a hybrid method that encapsulates some length of the MI cables in coiled tubing before transitioning the MI cables to standard conductors, for instance ESP cable, which is then clamped to the exterior of downhole tubing.
There are essentially four (4) methods of heater deployment that can be used in vertical, high-angle or horizontal wells. They are:
MI cable inside a coil from total depth to surface (Dual Completion)
MI cable strapped outside to pipe outside from total depth to surface
MI cable with the heater section inside a coil (stinger) converting to an ESP cable in the cold and/or overburden section and run to surface
MI cable with the heater section strapped to a tail pipe converting to ESP cable to surface 4
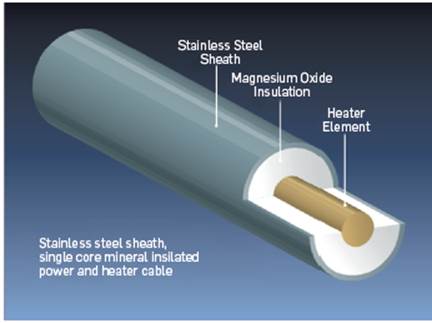
An artist's rendering of an example of a cross section of the heater assembly for the first and the third method of deployment is shown in Figure 2. In this example, the heater assembly consists of two Mineral Insulated (MI) cables of 20.32mm (0.80-in.) outer diameter (other sizes are available) that are deployed inside 60.325 mm (2 ⅜-in.) coiled tubing (other sizes are available), together with an optical fiber, four duplex thermocouple wires (eight sensing locations), and a vibrating wire pressure gauge. The type and number of sensors are all optional but, at a minimum, a temperature measurement at one location along the heated segment of the assembly is required to control the heater.
Depending on the length of the overburden section, the increased incremental cost of coiled tubing throughout the cold section (Method 1) may be offset by the reduction in on-site deployment costs. "Coil-to-surface" deployments are an option on newly-drilled wells, where the opportunity exists to design the well to accommodate downhole electric heating in the most efficient manner possible but may also be an option for existing wells already completed in a suitable manner.
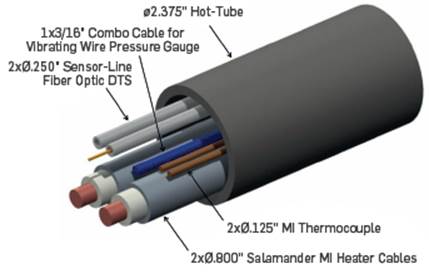
The heater output (heat-injection rate) is controlled by regulating the voltage - and therefore the current - at the surface. A Programmable Logic Controller (PLC) receives input from thermocouples or distributed temperature sensors (optical fiber) and uses it to regulate the output of a Silicon Control Rectifier (SCR) or a Heater Control Transformer (HCT) or a Variable Voltage Transformer (VVT). The surface components can be packaged in a skid, like the one shown in Figure 3.
RESERVOIR AND WELL FLUID SELECTION (OR FIRST SCREENING) CRITERIA
While downhole electric heating has applicability in a broad range of reservoirs and operating scenarios it is useful to define the optimal reservoir and fluid selection criteria as a baseline to compare both prospective and past electric heating projects. Based on extensive well modelling as well as data from historic electric heating projects, the selection criteria of the ideal reservoir are as follows:
1. Sand Thickness: >>5 𝑚𝑒𝑡𝑒𝑟𝑠
2. Viscosity (𝜇𝑜𝑖𝑙): 100 cp < 𝜇𝑜𝑖𝑙<25,000 𝑐𝑝 (Live Oil)
• i.e., the viscosity of dead oil may be as high as 30,000-35,000 cp
3. Horizontal permeability (𝑘ℎ): 𝑘ℎ>1,000 𝑚𝐷
• permeability per se is not critical as long as there is enough pressure drive to meet the production-rate criterion
4. Mobility ratio (𝑘ℎ/𝜇𝑜𝑖𝑙): 𝑘ℎ /𝜇oil≥0.05
• please see comment on permeability and viscosity right above
5. Water Saturation (𝑆𝑤): ≤0.4 → 𝑆𝑜 ≥0.6
6. Water Cut (𝑊𝑐𝑢𝑡): <30%
• high water-cut in a thin heated zone hinders the propagation of high temperature in the bulk of the pay
7. Production Rate: >20 𝑏𝑏𝑙/𝑑𝑎𝑦
• there is no technical minimum, but experience suggests that this threshold is needed so that the oil-rate uplift can pay for the CapEx and OpEx.
8. In general, cased hole or gravel-packed hole with slotted liner and single lateral completions are preferred vs barefoot or multilateral wells, especially for a first deployment. There is no limitation on reservoir depth/pressure.
Greater detail and discussion on each of these parameters have been omitted for brevity and to focus on the field case study.
The optimal timing of heater deployment is not in the list of selection criteria presented above. Field experience, gained from the case discussed here, as well the analysis performed in [8] suggest that the earlier the heater is deployed in the production life of a well the higher the economic benefit would be. This is particularly true for long horizontal wells, because electric heating reduces the viscosity of the oil in the wellbore, so it allows for higher rates of oil production along the complete length of the long horizontal lateral at higher, if desired, bottom hole pressures than in a cold-producing well. This degree of freedom may ultimately allow for an operating policy that suppresses excessive production of dissolved gas, thereby helping to conserve reservoir energy and to increase ultimate recovery.
3. EXPERIMENTAL DEVELOPMENT
GEOLOGY
The downhole heater that is discussed in this paper is deployed in a horizontal production well in eastern Alberta, Canada. The well is completed in the Clearwater formation, interpreted as a large-scale, coarsening up, and shallow marine delta. In the area of interest, it can be subdivided into four sequences (zones), of which the Upper Middle Clearwater (UMC) is the target. The UMC is 11-15 m thick, dipping north and is characterized by a heavily bioturbated interbedded sand at the base, coarsening into very well sorted, clean sand in the upper 10 to 11 m. The top of the UMC is at a depth of ~145 m TVDSS, or about 410 m TVD.
Porosity, as measured by petrophysical logs, is constant throughout the unit and equal to 0.38.Permeability varies with depth, with measured horizontal permeability increasing from ~1,350 mD at the bottom of the UMC to ~2,500 mD at the top of the zone in the cleaner sand. The ratio of vertical: horizontal is constant and equal to 0.7 across the UMC.
Oil viscosity varies with depth, based on measurements of samples extracted from core. At the top of the oil column, dead oil viscosity is close to 50,000 cp (approximately the viscosity of ketchup) and it increases to over 200,000 cp near the bottom. This gradient is consistent with a range of 10-14°API in oil gravity.
Oil saturation varies with depth, with values reaching 0.80 in the upper half of the zone and dipping to less than 0.50 in the lowest quarter, resulting in an average value of close to 0.66. While gas pockets - and gas wells - exist within a few kilometers from the location of the project, no free gas is believed to exist within the targeted reservoir volume.
The properties of the rock matrix and the oil satisfy most of the criteria listed above ('Reservoir and Well Fluid Selection Criteria'), except for oil viscosity. The combination of good permeability and excellent porosity partially compensates for the higher oil viscosity. The higher initial pressure of this (undepleted) area contributes toward satisfying the criterion of >20 bbl/d (initial) oil rate.
WELLS
Past attempts to recover oil from this field by cold production had not been technically successful or the achieved oil rates were not economic. The operator was aware of the potential value of downhole heating from past activities and was also informed of the gains achieved by the deployment of a downhole electric heater in another field in Alberta. Thus, the operator decided to go for a clean, decisive pilot by drilling new horizontal wells in a section of the resource that had not been affected by previous operations. The new wells were completed with thermal cement and thermally rated casing connections. Wire-wrapped screen was also used for sand control since there was debate on whether sand production is enhanced, stimulating Cold Heavy Oil Production with Sand (CHOPS) style production regime, or suppressed by downhole heating. The high level of sand control further contributes to the clean, decisive pilot methodology.
The length of the lateral section of the new wells was decided on the basis of the tradeoff between cost and uncertainty. One of the new wells was to be used for cold production, which would serve as the baseline for the pilot. Horizontal wells, especially cold-producing are normally drilled with long laterals (e.g. >1,000 m), even if minimal oil production may be achieved from the toe segment, because it is still cost-effective to do so. In order for the pilot to deliver clean, decisive answers however, it would have been necessary to drill an equally long well for the downhole heater, the cost of which scales closer with length than the cost of drilling. The operator settled on a lateral of ~750 m, which is long enough to deliver solid data even though it would be economically sub-optimal for commercial-scale operations.
HEATER
The heater was designed to heat the maximum amount of the lateral length at a rate of up to 550 W/m, and a wellbore fluid target temperature of 120-140°C, but transitioning to unheated cable 120 m from the Progressing Cavity Pump, which was rated for 90°C continuous operation. This unheated section would allow the produced fluids to cool sufficiently prior to entering the pump. A well schematic with the downhole heater assembly is shown in Figure 4.
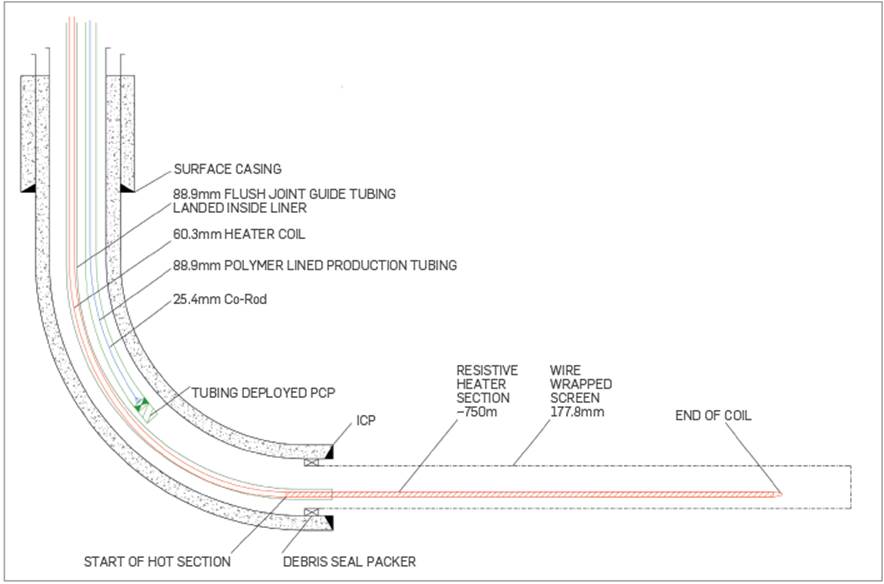
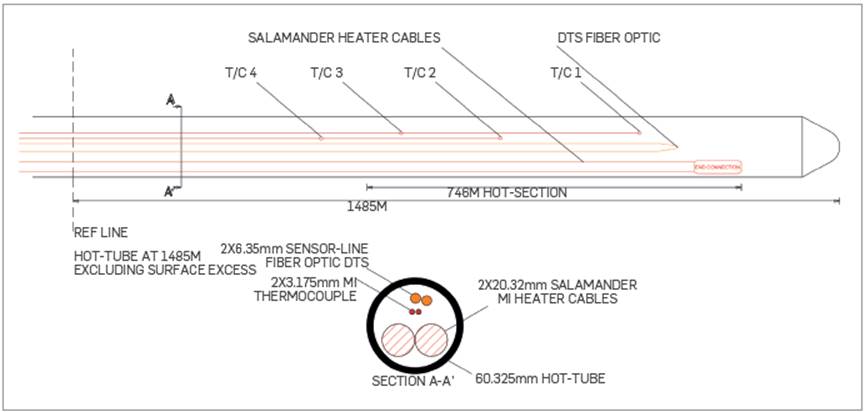
The ~750-m-long heated segment (750-1,500 m MD) consists of two Salamander Solutions Mineral Insulated (MI) cables of 20.32 mm (0.80-in.) outer diameter that are deployed inside 60.325 mm (2 %-in.) coiled tubing, together with an optical fiber and two duplex thermocouple wires (four sensing locations), as shown in Figure 5.
The MI heater cables are connected at the toe of the assembly by an end termination that completes the electric circuit, which is operated in Direct Current (DC) mode. At the other end (start of heat), each MI heater cable forms a hot-to-cold integral transition to an MI cold lead (750 m in length) and the two MI cold leads remain inside the coiled tubing and continue all the way to the wellhead.
The wellhead was designed to allow for the operator to perform well interventions, such as pump changes, without the need to remove the heater string.
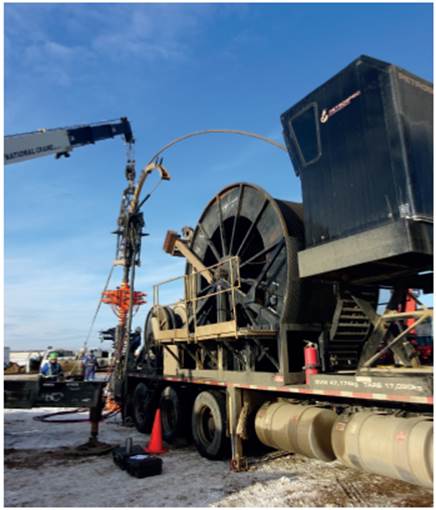
DEPLOYMENT
The heater was deployed inside coiled tubing ("Coil to Surface"). The combination of the dual-completion, coiled tubing to surface and compatible wellhead, allowed the heater to be deployed quickly and efficiently with the use of only a standard body-job Coiled Tubing Unit (CTU). The assembly of two MI cables and their end termination was delivered in a spool from Salamander Solutions' plant located in the UK to Petrospec Engineering's assembly facility in Alberta, Canada. There, it was laid out, pulled into the 60.325 mm (2 %-in.) coiled tubing with the instrumentation and re-spooled for delivery at the well site. The CTU that is shown in Figure 6 was used to install the coiled tubing assembly through a 88.9 mm (3.5 in.) guide string to depth.
4. RESULTS
PRODUCTION
The downhole heater assembly was energized in late December 2018 at a heat-injection rate of 450 W/m but the well remained shut in. The heated and the benchmark cold-producing well were opened to production in early January 2019. Within a day, thanks in part to the preheating, the oil rate of the heated well rose to ~35 m3/day, which was about five or six times the oil rate of the cold-producing well. In the following weeks, the cold-producing well stopped running as its pump was not able to cope with the high-viscosity oil. Pure cold production was terminated as technically unfeasible. The production data and the history-match of oil and water production from the well with the downhole electric heater are shown in Figure 7.
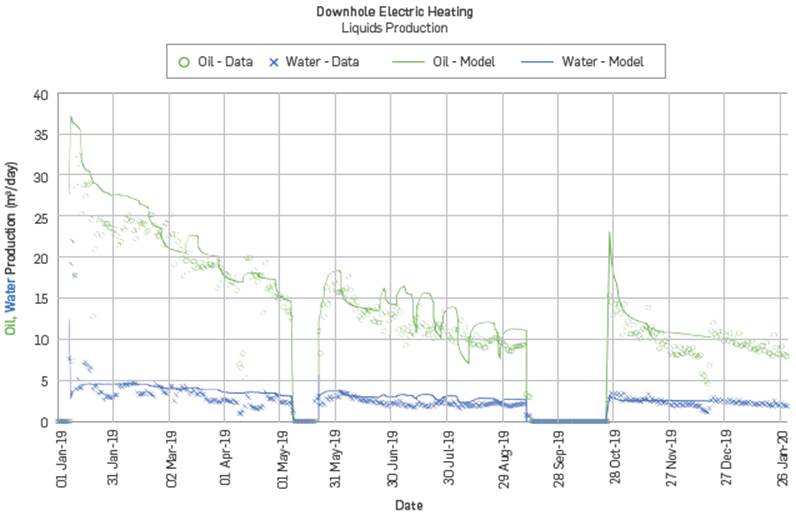
The oil rate was closely correlated with the rate of heat injection. This correlation explains the series of somewhat abrupt changes in oil rate that begun in mid-February 2019 when the heat-injection rate was first reduced. The main reason for the decrease in heat-injection rate was the rising temperature at the location of the pump. The higher than expected temperature was the result of the sensible heat that was convected by the markedly higher than expected rate of oil production. These higher temperatures resulted in failures of the progressing cavity pump (damaged elastomers) in May 2019 and October 2019.
TEMPERATURE AND PRESSURE
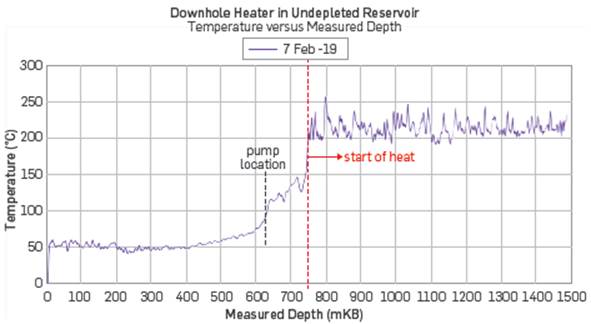
The temperature profile along the heated section (750-1,500 m) is, on the average, quite uniform, as shown in Figure 8. The snapshot shows the temperature that was recorded by the optical fiber after six weeks of heating at a constant heat-injection rate of 450 W/m. The jitter (fluctuations) are believed to be caused in part by the intermittent contact of the fiber with the heater cables but the dip at a measured depth of around 1100 m may have a physical explanation (mineralogy or fluids saturation).
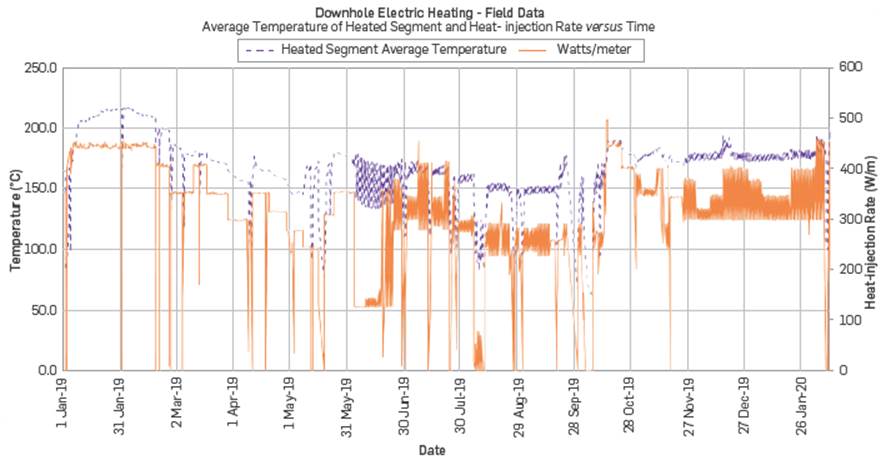
It should be noted that since the data are extracted from the readings of the optical fiber that is located inside the coiled tubing in (intermittent) contact with the heater cables, they show higher temperatures than those prevailing in the heated annulus where the production fluids are flowing. Experience from other field projects and semi-analytical calculations point to a 100-120°C difference at heat-injection rates in the range 400-450 W/m. Thus, in late January - early February 2019, when the average temperature was ~210-215°C, the fluid temperature in the heated segment annulus was probably closer to 90-95°C. The temperatures recorded in the unheated segment of the well (0-750 m) are more representative of the fluid temperature. The temperature difference decreased at the lower rates of heat-injection, prevailing in April - May 2019, when the average temperature also decreased, as shown in Figure 9.
The impact of the changes of the heat-injection rate on average temperature is shown in Figure 9. Each temperature point on the purple curve represents the daily average value of all the recorded data along the heated segment (750- 1,500 m) shown in Figure 8 while each point on the orange curve is the daily average rate of heat injection. From June 2019 onward, the heat-injection rate was programmed to change twice or three times a day to take advantage of the fluctuating cost of electricity.
5. RESULTS ANALYSIS
NUMERICAL MODEL
A reservoir model, based on CMG-STARS [9], was used to history match the production rate and temperature of the heated well. The model has two differentiating features:
1. Flexible-wellbore option to simulate the production well and
2. Non-equilibrium ‘chemical reactions’ to capture the foamy-oil nature of the oil.
The number of fluid components and their partition into phases is tabulated in Table 1.
Table 1 Phase partition (distribution) of fluid components in reservoir model
| Component | ||||||
| Phase | WATER | RES | OIL | CH4 | S_SUB | CH4_GAS |
| Water | √ | |||||
| Oil | √ | √ | √ | √ | ||
| Gas | √ | √ | ||||
The two non-equilibrium ‘chemical reactions’ were as follows:
1st Reaction: Generation of bubbles dispersed and entrained in the oleic phase
CH4→S_BUB
2nd Reaction: Coalescence of dispersed/entrained bubbles into free-flowing gaseous phase
S_BUB → CH4_GAS
The properties of the two main components of the oleic phase, RES and OIL, are selected such that their combination can be used to model the physical properties of any oil - from the lightest to heaviest - that is likely to be encountered and could be just as applicable in models of conventional reservoirs. RES has properties of oil with API gravity lower than 5°API while OIL has properties of oil with API gravity greater than 35°API.
The ‘reaction rate’ in both ‘reactions’ has an Arrhenius-like dependence on temperature but it is the second reaction that drives the collapse of the ‘oil foam’ near the heated wellbore. The temperature-dependent kinetics of this reaction can be measured in a laboratory at higher temperatures [10]; at temperatures close to initial reservoir temperature (i.e. the temperature that would prevail in a cold-producing well) the contribution of the second ‘reaction’ is minimal.
It should be noted that the values of reservoir and fluid properties (porosity, permeability, oil viscosity) that were used in the model were the same as those provided by the operator prior to the pilot, thus no ‘knob’ was tweaked.
The reservoir model that was used to achieve the rather close history-match shown in Figure 7 was then used to answer the hypothetical question of how this well would have performed had the heat-injection rate been maintained at 450 W/m. The expected performance is shown in Figure 10. It is seen that by late August 2019, the higher heat-injection rate would have resulted in -697 m3 (4,390 bbl) of incremental cumulative oil production. This further reinforces the message that increased heat correlates fairly strongly with increased oil production but the economics tradeoff between cost of additional electricity and profitability of incremental oil is beyond the scope of this paper.

The discussion on the tradeoff between injected heat and increased oil production is often linked to the question on the durability of the increase in oil rate, which, in turn, is connected to the depth of propagation of the temperature front ([11], [12]) into the bulk of the targeted reservoir volume. This series of questions is best addressed starting from the end.
In this project there were no observation wells to collect temperature (and pressure) data away from the heated wellbore. Therefore, the extent of temperature propagation would have to be estimated from the reservoir model. Figure 11 shows the temperature contours on a vertical cross section located near the middle of the heated segment. The initial reservoir temperature was 16°C and after about six months of heating it had risen by a few degrees (deltaT≤5°C) at a distance of ~5 meters. Obviously, oil molecules farther out were also affected but an increase of ~5°C is sufficient to start reducing to a measurable extent the viscosity of this heavy oil. Extended calculations show that after four years of heating a similar effect would be felt at a distance of about 10-12 meters. The depth of temperature propagation depends on several factors, such as thermal conductivity of the rock, rate of production, composition of produced fluids and operating temperature of borehole. In general, sands (clastic formations) have higher thermal conductivity than carbonates so the temperature travels farther. Production of liquids at high rates, especially at high water cut, tends to absorb and convect the injected heat back toward the heated borehole, thereby slowing down the rate of temperature propagation. In conclusion, while the correct answer to the question about the extent of temperature propagation is "It depends", it is plausible to state that the downhole heater is expected to affect a radius of 10-15 meters within a production period of five to ten years.
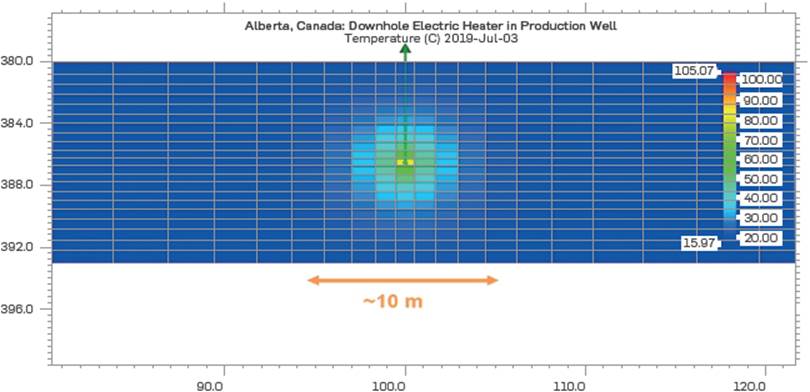
Figure 11 Simulated propagation of temperature from a production well with a downhole electric heater
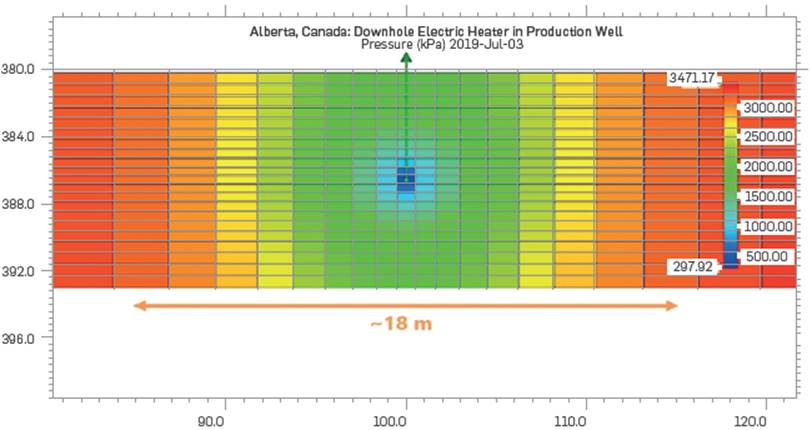
However, the impact of temperature propagation is felt much farther into the reservoir, thanks to its impact on pressure propagation, a snapshot of which is shown in Figure 12, after six months of heating. It is seen that pressure (reduction) has reached as far as 15-20 meters away from the heated wellbore, which is farther than it would have reached in a cold-producing well that produces heavy oil that exhibits foamy-oil behavior. The explanation for this additional reach is simply Darcy's law. The drastically lower viscosity of the heated oil in the vicinity of wellbore reduces the pressure drop in the near-borehole region, which is equivalent to enhancing the effective diameter of the wellbore. Therefore, even if all the other variables in Darcy's equation stay the same (e.g. unchanged oil viscosity at a radial distance where the temperature front has not reached yet) the heated well will produce at a higher oil rate than a comparable cold-producing well and will continue to do so as predicted by Darcy's law for a wellbore with larger diameter. This pressure effect explains the durability of higher rate of oil production from a heated well.
ENERGY USAGE AND GREENHOUSE GAS EMISSIONS
The use of a higher form of energy (electricity) to produce primary energy (hydrocarbons) often raises two related questions:
a) What is the energy balance of a recovery process driven by downhole electric heating?
and,
b) What is the carbon dioxide footprint per incremental barrel of produced oil?
The most common metric of energy efficiency of a thermal recovery method [14] is the Energy Return On Investment (EROI), which is defined (Equation 1) as the ratio of the heating value of the produced hydrocarbons - here predominantly oil - to the amount of heat that is injected into the production borehole minus 1
The heating value of the produced oil is assumed to be 40 GJ/m3 (~6 MMBTU/bbl), which is appropriate for the heavier oils that are normally targeted for downhole electric heating [15]. The produced gas is assumed to be methane with a heating value of 0.038 GJ/m3 (1013 BTU/ft3).
The value of EROI is affected by the rate of fluids production because the produced fluids not only absorb the injected heat (higher denominator) but also convect it back toward the wellbore, thereby reducing its propagation into the heated volume and the mobilization of oil (lower numerator). This double penalty on EROI increases with water cut since water has twice the heat capacity of oil. The impact on energy efficiency can be estimated by calculating the absorbed heat for a heated well that produces one barrel oil per day per meter of perforated interval (Equation 2).
In the field case discussed here, the heated well is producing close to 50 bbl/day of oil out of a 750-m-long lateral operating at ~95-100°C (borehole, not heater, temperature) from a reservoir with (far-field) temperature of 16°C. Thus, the produced oil consumes (Equation 3):
which rises to ~28-30 W/m when the water cut is accounted for. This is close to 10-15% of the 230-280 W/m that the downhole heater is generating, which means that most of the injected heat is propagating into the formation and mobilizing heavy oil. In general, this is the case for most deployments of downhole heaters. The resulting values of EROI are shown in Table 2.
Table 2 Energy Return On Investment for electrically-heated heavy-oil production wells
| Case | Time (years) | EROIsubsurface() |
|---|---|---|
| Brownfield - Data | 0.9 | 5.8 |
| Greenfield - Data | 1.0 | 22.3 |
| Greenfield - Model750 m heated section, 450 W/m | 1.0 | 17.6-23.6α |
| 5.0 | 7.2-10.6α |
In Table 2, the label 'Brownfield' refers to a case where the downhole electric heater was deployed in a well that had been cold-producing for almost ten years. The pressure in the formation surrounding the well had declined to less than 800 kPa (-120 psi) while the water cut had increased to about 30%. The second row in Table 2, refers to the case discussed in this paper. The entries in the last two rows are based on forecasts by the numerical model that was calibrated against the field data discussed above. In particular, the Lower values at t=5.0 years versus t=1.0 years reflect the reduction that is predicted by the model as these projects mature and the reservoir pressure declines. The lower value in either range is based on the assumption that a certain amount of cold production may be feasible in this resource even though cold production failed in the pilot discussed here. This (nominal) volume of cold production - which is subtracted from the cumulative production of the electrically heated well - may, for example, be achieved by drilling the cold-producing well at the top of the pay, where the oil viscosity and water saturation may be lower. Nonetheless, the EROI of the electrically heated well still exceeds 7.0. This relatively high value of EROI directly translates to a rather low C02 footprint, as shown in Figure 13 and tabulated in Table 3.
Table 3 Energy usage and CO2 emissions for oil produced by downhole electric heating and steam-based methods
| Energy Usage (kWhr/ bbl) | EROI () | CO2 footprint (kgCO2/ bbl) | Steam-Oil Ratio () | EROI () | CO2 footprint (kgCO2/bbl) |
| 84 | 20 | 29 | 1.5 | 8.6 | 65 |
| 110 | 15 | 39 | 2.0 | 6.2 | 87 |
| 136 | 12 | 48 | 2.5 | 4.8 | 108 |
| 161 | 10 | 56 | 3.0 | 3.8 | 130 |
| 221 | 7 | 77 | 3.5 | 3.1 | 152 |
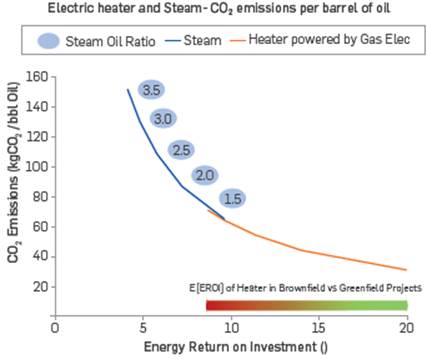
The orange Line in the graph Figure 13 shows CO2 emissions per barrel of incremental produced oil as a function of EROI. The origin and justification of the plotted EROI values were discussed above, in association with Table 2. It is assumed that the electricity is produced by gas-fired turbines in a combined heat and power (CHP) plant, with a CO2 footprint of 0.35 kgCO2/kW-hr [16]. However, the CO2 footprint can be much lower for electric heaters since they can be powered by electricity generated from renewable sources (e.g. solar or wind power).
The blue line in the graph shows CO2 emissions per barrel of oil that is produced by various steam-based recovery methods - such as steamflooding, Cyclic Steam Stimulation (CSS) or Steam-assisted gravity drainage (SAGD) - as a function of EROI. However, since EROI is not a common metric of efficiency in steam-based recovery methods, the Line is annotated by the values of Steam-OiL Ratio (SOR) that correspond to the EROI. It is also assumed that the steam is generated by a CHP plant that is as efficient as the one producing the electricity that powers the downhole electric, which would result in a CO2 footprint of 103 kgCO2/MMBTU. This explains the overlap of the two curves around EROI~10.
At first sight, the graph appears to imply an adversarial relationship between downhole electric heating and steam-based recovery technologies in that the latter are associated with higher levels of CO2 emissions per barrel. This would be misleading and counterproductive, especially since downhole electric heating cannot achieve the high recovery factor (>50%) of a good steam-based project. Downhole electric heaters should be used to complement steam-based projects by enabling the production of heavy oil to reduce initial reservoir pressure in the vicinity of the (future) steam-injection wells, which would both accelerate the production of oil from the resource and facilitate the injection of steam after the pressure has declined and the mobility (injectivity) has increased. Downhole electric heaters may also be used either for in situ steam generation or for increasing steam quality. As the field is developed, downhole electric heaters can then be moved to another (future) steam-injection wells to repeat the process or they can remain in the original wells to help increase steam conformance and steam quality, thereby decreasing the Steam-Oil Ratio. Increasing steam quality and conformance may be particularly important in SAGD projects where field data indicate that as much as a quarter of an 800-m-longwell may not be receiving any steam. The key message that should be garnered from Figure 13 is: Downhole electric heaters complement steam.
CONCLUSIONS
Long and reliably powerful electric heaters offer an opportunity to enhance oil recovery and add reserves in a large fraction of heavy-oil assets around the world. As 7demonstrated by the field case study from Alberta, Canada, the technology is especially suitable for long horizontal wells, as it minimizes the pressure drop in the production borehole, allowing for the full pressure drawdown to be applied uniformly along the complete length of the wellbore.
The technology is based on the propagation of a temperature front into the reservoir by thermal conduction. The impact of the higher temperature, and thus, lower viscosity in the vicinity of the heated wellbore is akin to increasing the wellbore diameter, which results in pressure reduction deeper in the reservoir than the edge of the temperature front. Nonetheless, sufficient oil is left untapped that the resource is not 'sterilized'. In this regard, downhole electric heating can be seen as a precursor technology that can be deployed in a modular fashion (one well at a time) to reduce reservoir pressure before the field is developed by steam-based technologies such as cyclic steam stimulation or steam-assisted gravity drainage.
The heaters can be deployed downhole by coiled tubing or strapped to the outside of production tubing and can be operated over a wide continuum of power densities, tuned to the needs and response of the reservoir.
In the field case discussed here, after twenty (20) months of operations it has been clearly demonstrated that:
The installation of the downhole electric heater has meaningfully increased oil production, on the order of 3X-5X, compared to a benchmark cold-production well (during the brief period that it cold-produced), without a simultaneous increase in water production.
The comparison of these results indicates that the incremental oil should be classified as 'Higher Ultimate Recovery' instead of 'Accelerated Recovery'.
The carbon-dioxide footprint of the incremental oil is less than 40 kgCO2/bbl, so it is lower than the greenhouse gas intensity of the average crude oil consumed in the US.
The cost of electricity is a key driver in the economics of an electric heating project and that can vary significantly between projects even within the same jurisdiction.
Further optimization, in terms of lateral length and economies of scale, has the opportunity to reduce the cost of an electric heating project on an incremental per barrel of oil basis.
Field data have been history-matched by a thermal reservoir model that accounts for the foamy-oil nature of the oil. Both the field data and the model indicate that early deployment of the technology maximizes incremental oil recovery and that the volume of cumulative incremental oil far exceeds the expected ultimate recovery of a competing cold-producing well.
Downhole electric heating in long horizontal wells is now a commercially available technology that can be reliably installed. Understanding the optimum reservoir conditions where the application of downhole electric heating maximizes economic benefits will assist in identifying areas of opportunity in heavy oil reservoirs around the world.