Inglés (pdf)
 Articulo en XML
 Referencias del artículo
 Enviar articulo por email
 Citado por SciELO
  Citado por Google
  Similares en
SciELO
Similares en
SciELO  Similares en Google
 Permalink
1. INTRODUCTION
Factors such as the drop in crude oil prices worldwide have allowed oil companies to develop new technologies to enhance oil recovery to improve their competitiveness. [1], [2]. Therefore, in recent years researchers and the oil industry have focused on increasing the recovery factor through enhanced oil recovery (EOR). The use of polymer injection has been one of the technologies that have allowed the increase in production in different oil fields, increasing the oil sweep efficiency [3]-[5] thanks to the improvement in the mobility relationship between polymer solution and displaced oil [6]. The most widely used polymers in enhanced recovery processes are synthetic polymers, while the best performing synthetic polymers are partially hydrolyzed polyacrylamides (HPAM) and its derivatives. Because of these polymers' low cost, the use of HPAM polymer solutions is favorable in projects for large-scale production [7], [8]. The HPAM, as other polymers, is sensitive to high shear stresses, causing rupture of the macromolecular chains, reducing their size and viscosity, and generating the mechanical degradation of the polymer [9]. These occur during the polymer preparation and injection process, particularly in the flow regulator valves on the bottom of the reservoir [10], [11].
The previous studies have determined most of the physicochemical factors involved in the mechanical degradation of polymer solutions. However, these studies bent on the influence of these factors independently, without considering the interaction between them. For that reason, this paper aims to analyze the interaction of the physical and chemical factors that influence the mechanical degradation processes of polymeric solutions used in enhanced oil recovery. The goal is to determine the mechanical degradation of HPAM polymeric solutions through the experimental assessment in capillary tubes, considering the following factors: molecular weight, salinity, capillary diameter, concentration, and differential of pressure and, finally. Their influence is measured through a fractionated factorial design (2k-p) and a Box-Behnken design to create a response surface.
2. STATE OF TECHNIQUE
The mechanical degradation is particularly high in injection processes with high flow rates, low permeability formations, and high salinities [12]-[14]. Scientific literature results show that the degradation is more severe for high molecular weight polymers and polymer diluted solutions [11]. Furthermore, this mechanical degradation reduces polymer viscosity affecting the oil recovery, which demands greater energy consumption to carry out a homogeneous oil sweep [11]-[15]. To determine the physicochemical factors involved in the mechanical degradation of polymer solutions, different alternatives have been proposed, such as the one authored by Husveg T. et al., [16], who developed a novel valve technology for its use in EOR with polymers. By designing spiral channels adding expansion and reduction zones, greater control of shear forces is evidenced, reducing the percentage of polymer degradation. The authors demonstrated that the degradation percentage is less than 10% with pressure differentials lower than 45 bar, achieving better performance than a standard valve where the degradation percentages are between 60 and 80%. Xin X. et al. [17] evaluated the effect of polymer degradation on resilience through polymer flooding in heterogeneous reservoirs. To carry out this evaluation, they implemented a new mathematical model that allowed the design of a three-dimensional two-phase polymer injection simulator.
The static and dynamic degradation of the polymer is examined. This simulator was validated by comparing the results with a commercial simulator and with experimental results. Thanks to this simulator, it was determined that the viscosity of a polymeric solution with the same shrinkage decreases with increasing shear rate. Shear degradation was observed since the dynamic degradation rate constant was 0.0022 day-1. The static degradation rate constant was 0.0017 day-1, obtaining a 7.7% decrease in oil recovery, demonstrating that polymer degradation has an adverse effect on the process efficiency. Theriot T. et al. [18] evaluated the loss of viscosity in polymer solutions by shear by the interaction of the fluid and the surface facilities of the distribution system. In this study, it was determined that the degradation of polymer solutions occurs in flow control devices. They were able to observe a direct relationship between the pressure differential and the degradation that is generated by the control device. The geometric factors and the speed have little relation with the percentage of degradation, unlike the molecular weight and the polymer structure. The polymer solution also increases its degradation between 15 and 50% when it flows through the control device with a pressure differential greater than 50 psi.
Ronin E. et al. [19] numerically evaluated the interaction of polymer solutions between mechanochemical degradation at a molecular scale and laminar flow at a macroscale, allowing to minimize the technological gap of the degradation phenomenon at a molecular scale. Duretta P & Picchioni F. [20] developed a numerical model that estimates the efficiency of oil recovery in the reservoir by comparatively evaluating recovery using water and polymer solution. It is estimated 30% more recovery using polymers. Al Hashmi A.R. et. al. [9] analyzed the degradation of polymeric solutions, with partially hydrolyzed polyacrylamides (HPAM), through capillaries. They determined that the degradation increased with shear stresses above 15,000 s-1 due to the shear effect occurring on the capillary bulb's shoulder.
3. EXPERIMENTAL DEVELOPMENT
POLYMER USED AND WATER COMPOSITION
Three polymers of the partially hydrolyzed polyacrylamide type (HPAM) were used. These are anionic and are of three different molecular weights. Table 1 describes the polymer molecules used and some of their chemical characteristics. The polymers were prepared in three different synthetic sodium chloride brine corresponding to 500, 2,500, and 4,500 mg / L of NaCl to evaluate the salinity effects.
PREPARATION OF THE POLYMER SOLUTION
The stock solution has been prepared according to API RP63 standard [21], at a concentration of 5,000 ppm, by slowly adding the polymer powder to the vortex formed by the preparation water with adequate mechanical stirring. The polymer is stirred until completely dissolved. The final solution used is obtained from diluting the stock solution with the preparation water at polymer concentrations of 500,1,500, and 2,000 ppm.
MEASUREMENT AND DATA ACQUISITION.
Figure 1 illustrates the assembly of the equipment for the acquisition of experimental data. The procedure applied, which is explained next, was based on the API RP63 standard [21], Following the preparation of the polymeric solution, the initial viscosity (n_o) measurement is carried out at ambient temperature. The diluted solution is introduced through the upper part of the steel cylinder, and then the lid was placed with the respective capillary to evaluate. Later, employing the nitrogen regulating valves, the pressure to assess mechanical degradation is adjusted. The polymer solution is next flowed through the reduced diameter capillary to cause shear stress. The time it takes for a mass greater than 50 g of the polymer solution to pass from the first drop that exits the capillary is measured. The time, as well as the weight reached, are recorded Equation 1 presents the shear rate formula.
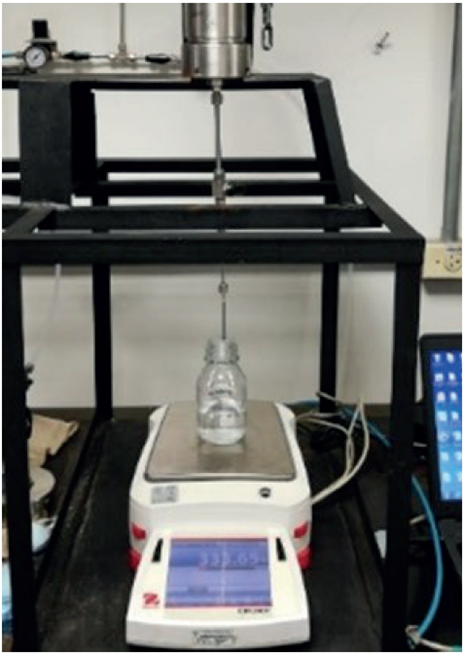
Where γ a is the shear stress, Q the flow rate, R the internal radius of the capillary used [22]. Lastly, the viscosity of the degraded solution is measured n deg .
DETERMINATION OF THE VISCOSITY DEGRADATION RATE.
The Brookfield LVT viscometer with ULA adapter or Din 86 measured the viscosity of the samples. A temperature controller was used to secure homogeneous measurement conditions in a suitable range for the analyzed samples, determining the viscosity at a shear stress of 7.3 s-1 @ 30 °C. The degradation percentage of the samples was determined by measuring the viscosity: initial of the non-degraded solution (n o ), the degraded solution (n deg ), and the solvent or synthetic water for preparation (n s ), as shown in Equation 2 [9].
EXPERIMENTAL CONDITIONS
The fractional factorial design (2kp) implanted identifies significant process parameters, applying a 5-factor degradation screening with two levels (25-1). Then, through a response surface methodology (RSM), a regression model was found that enables the estimation of polymeric solutions degradation according to variables (molecular weight (MDa), salinity in NaCl equivalents (ppm), capillary diameter (in), concentration (ppm), ΔP (psi)). For the RSM, a Box-Behnken (BBD) design is employed with three central points to increase the error-free level.
FRACTIONAL FACTORIAL DESIGN (2KP)
Table 2 shows the experimental fractional factorial design of 5 factors with two levels (25-1). The chemical factors involved in this design, such as molecular weight, salinity, and polymer concentration, are variables that directly affect the viscosity of the polymeric solution. According to the literature, the degradation rate and the physical factors with the most weight correspond to the orifice diameter and the differential pressure. The range of high and Low levels is currently used in pilot processes or expanding polymer njection technologies. In this phase, the polymeric solutions of low and high molecular weights of 6.5 MDa and 18.5 MDa, respectively, charged the injection cylinder. The salinity varied between 500 ppm and 4,500 ppm, and the concentration between 500 ppm and 2,500 ppm. The capillary diameter was minimum 1/16 inches and maximum 1/4 inches, and the differential pressure was 200 psi (min.) and 800 psi (max.), respectively.
BOX-BEHNKEN DESIGN (BBD)
The previous stage's fractional factorial experiment enables determining the most significant factors in the HPAM polymer solution degradation rate. A second experimental stage, which consists of a Box-Behnken experimental design (2k) with three central points, as shown in Table 3, enables the development of a response surface. In this second stage, the polymeric solutions (500 ppm) for each experimental condition were prepared with a salinity of 500 ppm as fixed factors. The molecular weight varied between 6.5 MDa and 18.5 MDa as low and high levels, respectively, with central points of 12.5 MDa as medium level. The differential pressure ranges between 200 psi and 800 psi, with central points of 500 psi as medium level. Finally, the capillary diameter varied between 1/16 and 1/4 inches, with 1/8 inches as central point.
Table 3 Box-Behnken design.
| Factors | Variable | Low level [-1.0] | Medium level [0.0] | High level [1.0] |
|---|---|---|---|---|
| Molecular weight (MDa) | A | 6.5 | 12.5 | 18.5 |
| Capillary diameter (in) | B | 1/16 | 1/8 | 1/4 |
| ΔP (psi) | C | 200 | 500 | 800 |
Subsequently, to determine the optimal conditions of the polymeric solutions degradation percentage, a regression model was built, and a statistical optimization process using R-Studio® was carried out. The regression model obtained was developed following the structure shown in Equation 3:
Where Y is the response of the regression model, x ¡ and x j are the experimental process factors, β 0 is the intersection term, β ¡ is the coefficient of the linear terms, β ¡j set the coefficients of the interaction terms between factors, β ii is the coefficient of the quadratic terms, and ε is the modeling error term. The model fit was determined using the analysis of the lack of fit and the Durbin-Watson tests. Similarly, the residual structure was analyzed, as well as the standard R 2 and the adjusted 𝑅 𝑎𝑑𝑗 2 coefficients to determine the model fitting level.
4. RESULTS
FRACTIONED FACTORIAL DESIGN (2K-P) RESULTS
In the fractioned factorial design (25-1), 16 experiments were carried out. Table 4 shows the experimental results for the degradation rate. The HPAM polymer solution presents a mechanical degradation rate that fluctuates between 7.83% corresponding to experiment 11 and 76.95% in experiment 2.
Table 4 Results of the screening experimentation.
| Run | Molecular weight (MDa) | Salinity (ppm) | Capillary diameter (in) | Concentration (ppm) | Delta P (psi) | Degradation rate (%Dr) |
|---|---|---|---|---|---|---|
| 1 | 6.5 (-1) | 500 (-1) | 1/16 (-1) | 500 (-1) | 200 (-1) | 30.03 |
| 2 | 18.5 (1) | 500 (-1) | 1/16 (-1) | 500 (-1) | 1,400 (1) | 76.95 |
| 3 | 6.5 (-1) | 4,500 (1) | 1/16 (-1) | 500 (-1) | 1,400 (1) | 50.68 |
| 4 | 18.5 (1) | 4,500 (1) | 1/16 (-1) | 500 (-1) | 200 (-1) | 57.41 |
| 5 | 6.5 (-1) | 500 (-1) | 1/4 (1) | 500 (-1) | 1,400 (1) | 53.00 |
| 6 | 18.5 (1) | 500 (-1) | 1/4 (1) | 500 (-1) | 200 (-1) | 39.93 |
| 7 | 6.5 (-1) | 4,500 (1) | 1/4 (1) | 500 (-1) | 200 (-1) | 20.28 |
| 8 | 18.5 (1) | 4,500 (1) | 1/4 (1) | 500 (-1) | 1,400 (1) | 74.64 |
| 9 | 6.5 (-1) | 500 (-1) | 1/16 (-1) | 2,500 (1) | 200 (-1) | 7.83 |
| 10 | 18.5 (1) | 500 (-1) | 1/16 (-1) | 2,500 (1) | 1,400 (1) | 22.77 |
| 11 | 6.5 (-1) | 4,500 (1) | 1/16 (-1) | 2,500 (1) | 1,400 (1) | 56.30 |
| 12 | 18.5 (1) | 4,500 (1) | 1/16 (-1) | 2,500 (1) | 200 (-1) | 8.59 |
| 13 | 6.5 (-1) | 500 (-1) | 1/4 (1) | 2,500 (1) | 1,400 (1) | 36.56 |
| 14 | 18.5 (1) | 500 (-1) | 1/4 (1) | 2,500 (1) | 200 (-1) | 9.36 |
| 15 | 6.5 (-1) | 4,500 (1) | 1/4 (1) | 2,500 (1) | 200 (-1) | 20.93 |
| 16 | 18.5 (1) | 4,500 (1) | 1/4 (1) | 2,500 (1) | 1,400 (1) | 58.97 |
BOX BEHNKEN DESIGN RESULTS
The experimental results showed that the polymeric solutions present mechanical degradation ranging between 22.0% and 81.2%. These mechanical degradation results involve the following three experimental factors: molecular weight, capillary diameter, and delta P (pressure drop). Table 5 shows the values obtained experimentally in each condition of Table 3, along with the predetermined values for the polynomial equation (Equation 4) and its relative errors
Table 5 Results for the Box-Behnken response surface experiment.
| Run | Molecular weight | Capillary diameter | Delta P | Degradation rate | Degradation rate * | Relative error |
|---|---|---|---|---|---|---|
| (MDa) | (in) | (psi) | (%) | (%) | (%) | |
| 1 | 18.5(1) | 1/16 (-1) | 500 (0) | 68.22 | 69.27 | 1.54 |
| 2 | 6.5 (-1) | 1/8 (0) | 800 (1) | 67.67 | 68.46 | 1.17 |
| 3 | 6.5 (-1) | 1/16 (-1) | 500 (0) | 54.08 | 55.85 | 3.27 |
| 4 | 12.5 (0) | 1/8 (0) | 500 (0) | 66.60 | 69.47 | 4.31 |
| 5 | 12.5 (0) | 1/8 (0) | 500 (0) | 70.51 | 69.47 | 1.47 |
| 6 | 12.5 (0) | 1/8 (0) | 500 (0) | 68.55 | 69.47 | 1.34 |
| 7 | 18.5(1) | 1/8 (0) | 200 (-1) | 54.23 | 53.3 | 1.71 |
| 8 | 18.5(1) | 1/8 (0) | 800 (1) | 81.19 | 81.88 | 0.85 |
| 9 | 12.5 (0) | 1/4 (1) | 200 (-1) | 22.07 | 27.46 | 24.42 |
| 10 | 6.5 (-1) | 1/4 (1) | 500 (0) | 45.62 | 43.63 | 4.36 |
| 11 | 6.5 (-1) | 1/8 (0) | 200 (-1) | 43.20 | 39.88 | 7.69 |
| 12 | 12.5 (0) | 1/16 (-1) | 800 (1) | 69.92 | 68.26 | 2.37 |
| 13 | 12.5 (0) | 1/4 (1) | 800 (1) | 55.86 | 56.04 | 0.32 |
| 14 | 18.5(1) | 1/4 (1) | 500 (0) | 60.64 | 57.05 | 5.92 |
| 15 | 12.5 (0) | 1/16 (-1) | 200 (-1) | 40.82 | 39.68 | 2.79 |
| Relative error mean | 4.24 | |||||
STATISTICAL RESULTS
To determine the experimental analysis reliability, all statistical diagnoses were assessed, obtaining favorable results and showing that all the assumptions were achieved with the following results. The lack of fit observed was not significant. Also, the residual behavior was analyzed to verify the validity of the experiment. Figure 2 shows the graphs of independence, the normal probability plot, and the homoscedasticity plot of the residues obtained for the response surface experiment.
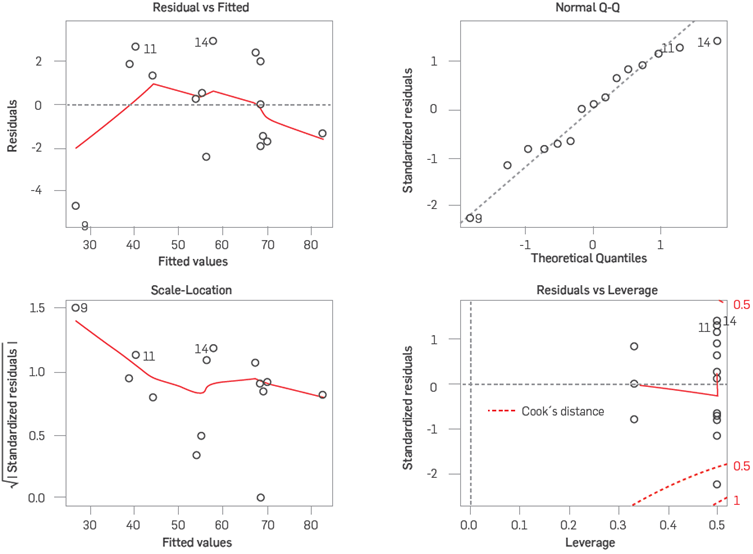
Figure 3 shows no evidence of abnormal behavior of the obtained residues and, thus, the normality assumptions in the response surface experiment are validated. Comparing the residual value's dispersion ranges at the different factor levels, we validated the homoscedasticity criteria. As verification of self-correlation, the Durbin-Watson statistic was calculated, with a value of 1.76682 and a p-value equal to 0.1958. Thus, confirming the absence of correlation between residues.
5. RESULTS ANALYSIS
ANALYSIS OF THE SCREENING EXPERIMENT
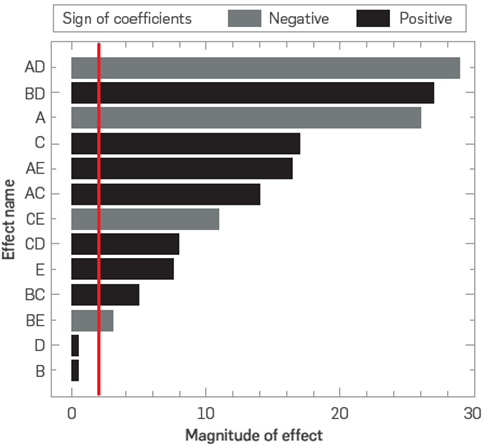
The analysis of variance (ANOVA) with a confidence level of 95% determined the statistical significance of each factor on the mechanical degradation of the HPAM polymer solutions. The p-value reveals the relevance of each element, where values below 0.05 show each factor's significance and their second-order interactions. As shown in Table 6, the analysis of variance (ANOVA) displayed that the effects of the main factors, A, C, and E, are the ones that have the most influence on the mechanical degradation of the HPAM polymer solutions.
Table 6 Results of the analysis of variance (ANOVA) for the screening experiment.
| Source | Sum of squares | Degrees of freedom | Middle Square | F-value | p-value |
|---|---|---|---|---|---|
| A: Molecular weight | 537.723 | 1 | 537.723 | 73.89 | 0.0133 |
| B: Salinity | 518.201 | 1 | 518.201 | 7.12 | 0.1164 |
| C: Capillary diameter | 488.689 | 1 | 488.689 | 67.15 | 0.0146 |
| D: Concentration | 503.938 | 1 | 503.938 | 6.92 | 0.1191 |
| E: Delta P | 248.931 | 1 | 248.931 | 34.21 | 0.0280 |
| AC | 445.895 | 1 | 445.895 | 61.27 | 0.0159 |
| AD | 1,156.24 | 1 | 1156.24 | 158.88 | 0.0062 |
| AE | 453.806 | 1 | 453.806 | 62.36 | 0.0157 |
| BC | 247.305 | 1 | 247.305 | 33.98 | 0.0282 |
| BD | 635.493 | 1 | 635.493 | 87.32 | 0.0113 |
| BE | 158.423 | 1 | 158.423 | 21.77 | 0.0430 |
| CD | 307.576 | 1 | 307.576 | 42.26 | 0.0229 |
| CE | 329.31 | 1 | 329.31 | 45.25 | 0.0214 |
| Total error | 145.548 | 2 | 727.741 | ||
| Total (corr.) | 7,883.0 | 15 |
Due to the alias structure in the fractioned factorial design, the main effects of B and D have a close relationship with factor A. Based on the hierarchical categorization principle, the first-order factors and the second-order interactions have more relevance and more probability of statistical influence on the response variable. It was, therefore, as seen In figure 3, determined that the factors with the highest Impact on the mechanical degradation of the HPAM polymeric solutions were the molecular weight (A), the capillary diameter (C), and the delta P (E).
ANALYSIS OF THE RESPONSE SURFACE EXPERIMENT
Table 7 presents the ANOVA, where the main factors (A, B, and C) and the second-order interactions (BB and CO) are statistically significant, with a 95% reliability level, on the mechanical degradation of the polymeric solutions. Similarly, the other second-order interactions are not substantial, but they were maintained in the analysis to fit the regression model better. Based on the results, the pressure delta (C) was the factor that had the most statistically significant effect on the mechanical degradation of the HPAM polymeric solutions, with a p-value of 0.0001.
Table 7 Initial ANOVA for the response surface experiment.
| Source | Sum of squares | Degrees of freedom | Middle Square | F-value | p-value |
|---|---|---|---|---|---|
| A: Molecular weight | 349.261 | 1 | 349.261 | 30.86 | 0.0026 |
| B: Capillary diameter | 298.313 | 1 | 298.313 | 26.36 | 0.0037 |
| C: Delta P | 1,609.29 | 1 | 1,609.29 | 142.18 | 0.0001 |
| AA | 8.26497 | 1 | 8.26497 | 0.73 | 0.4318 |
| AB | 0.643854 | 1 | 0.643854 | 0.06 | 0.8210 |
| AC | 1.55829 | 1 | 1.55829 | 0.14 | 0.7258 |
| BB | 415.381 | 1 | 415.381 | 36.70 | 0.0018 |
| BC | 10.3045 | 1 | 10.3045 | 0.91 | 0.3838 |
| CC | 265.272 | 1 | 265.272 | 23.44 | 0.0047 |
| Total error | 56.5926 | 5 | 11.3185 | ||
| Total (corr.) | 3,219.51 | 14 |
MOLECULAR WEIGHT
Figure 4 compares various scenarios with the same capillary diameter and pressure but with different molecular weight. The results show that, in all cases, the highest degradation rate is in the HPAM polymer with the highest molecular weight (18.5 MDa) Furthermore, it exposes an increasing trend in the rate of degradation with pressure, regardless of the capillary diameter
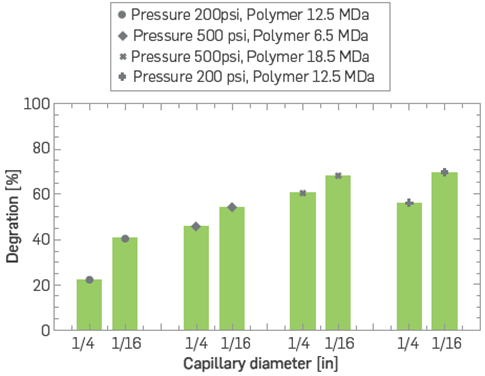
CAPILLARY DIAMETER
Regarding the degradation rate as a function of the capillary diameter (Figure 5), the capillary with the smallest diameter (1/16 inches) is the one that generates the highest rate of degradation. For all the scenarios where the pressure and molecular weight are equal, the 1/16 inches diameter produces higher percentages of degradation than the 1/4 inches diameter.
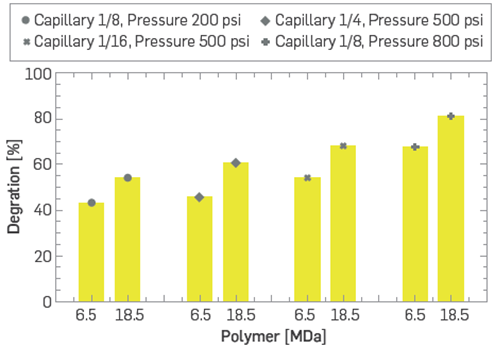
Figure 4 Behavior of the degradation percentage when comparing the molecular weight for the various conditions evaluated.
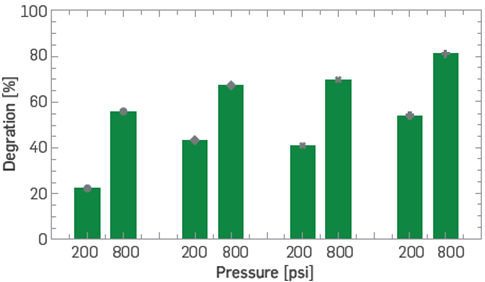
PRESSURE
The experimental data with the same capillary diameter, same polymer, and different pressures allow us to observe that, compared to the previous graphs, the pressure change is the variable with the most significant influence on the degradation rate. For all the cases shown in Figure 5, the differences in degradation rates for pressures of 200 and 800 psi are higher than 20%.
OPTIMIZATION BY RESPONSE SURFACE
With the data obtained in the response surface experiment, a regression model was adjusted; this model is shown in Equation 4, According to the significant interaction between factors, a quadratic structure was used for this model and the R^2 of the resulting model was 0.9785. Table 8 shows the coefficients of the regression model.
Where A is molecular weight, B is capillary diameter, and C is pressure differential.
Table 8 Coefficients of the regression model.
| Coefficient | Estimated |
|---|---|
| β0 | 69.47 |
| Β1 | 6.71 |
| Β2 | -6.11 |
| Β3 | 14.29 |
| Β4 | -13.02 |
| Β5 | -8.59 |
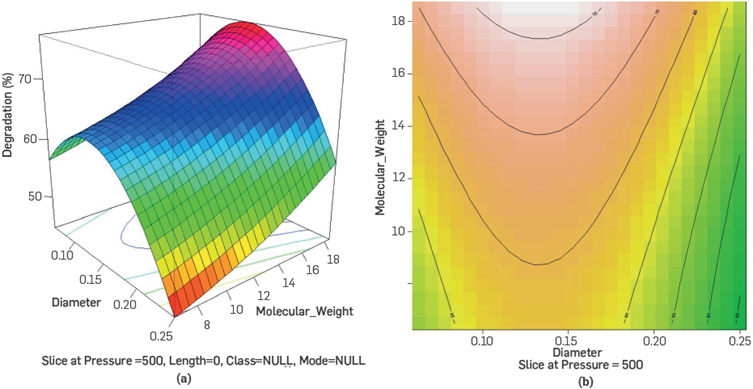
As observed in figure 7, the regression model achieves a proper match with the predicted data in the expression obtained in equation 4. Similarly, with this model, response surfaces identify operating regions with less mechanical degradation of the polymeric solutions n proven experimentation regions.
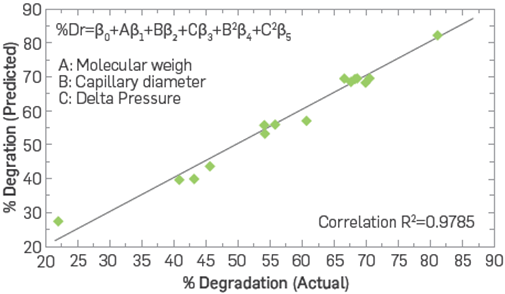
Figure 7 Response surface for degradation as a function of capillary diameter vs. molecular weight, with pressure differential equal to 500 psi.
Figure 8 shows the mechanical degradation rates of HPAM polymer solutions when the pressure differential is 500 psi, but the diameter of the capillary and the molecular weight (MW) changes. The observed behavior shows that the higher the MW, the greater the polymer degradations, confirming what the literature reported [11], having a considerable influence on the polymer's degradation together with the diameter of the capillary.
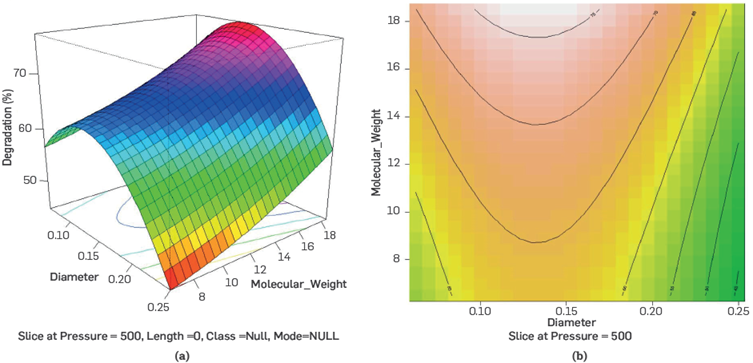
Figure 8 Response surface for degradation as a function of capillary diameter vs. molecular weight, with pressure
As shown in figure 9, the high rates of polymer degradation occur when the cross-section of the flow is lower, thus increasing the shear stresses on the molecular chain and reducing the viscosity substantially. In Figure 9b, the degradation is <45%, with diameters Less than 0.15 inches and a minimum pressure drop of 200 psi Additionally, there are near degradation values between diameters of 0.1 and 0.15 inches, which can be related to the acceptance criterion of 5% of the p-value; the contour lines of the surface demonstrate this behavior.
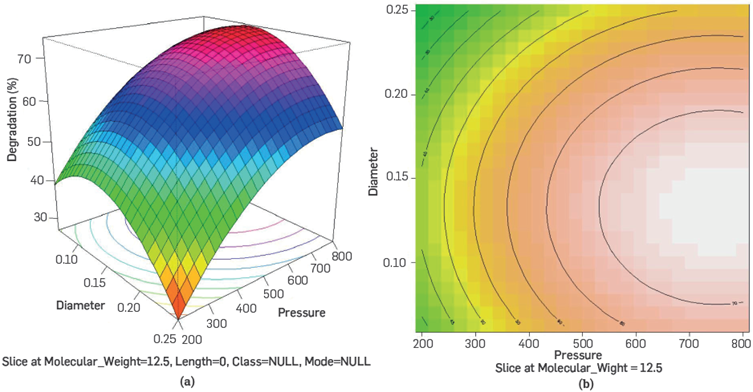
Figure 9 Response surface for degradation as a function of capillary diameter vs. pressure differential, with molecular weight equal to 12.5 MDa.
Figure 10 shows the significant effect of pressure on the degradation rate. At forces higher than 500 psi, degradations rates over 60% are reached regardless of whether it has a low or high molecular weight. Moreover, at pressures below 500 psi, the degradation of the polymer is more significant when the MW exceeds 14 MDa. The previous results were analyzed, keeping the capillary diameter fixed at 1/8 inches.
CONCLUSIONS
This work shows that the factors with the most significant influence on the mechanical degradation of polymeric solutions are the molecular weight, the capillary diameter, and the pressure differential. Where the pressure differential is the most influential with a P-Value of (0.0001). This is mainly because the capillary diameter and the pressure differential are highly related to the shear stresses to which the polymer is subjected, being fundamental factors in the fluids' continuity. It was also observed that the higher the molecular weight of HPAM, the greater the loss of viscosity. In contrast, the diameter of the capillary indicates an inversely proportional behavior, where for smaller diameters, higher degradation percentages were found.
The pressure drops, together with the abrupt reduction in the cross-sectional part of the capillary, give rise to a rupture in the molecules due to the extensional forces acting thereon. This is consistent with the response surfaces for the highest degradation rate values are in the scenarios with the highest pressure differential and molecular weight and the smallest capillary diameters. Additionally, the response surfaces show degradation rates lower than 50% in cases of low molecular weight polymer (6.5 MDa), pressure differentials between 200 and 500 psi, and capillary diameters greater than 0.125 inches. With these results, it can be considered that the regression model developed is a useful tool to estimate the degradation percentages of the HPAM polymeric solution where the molecular weight, the diameter of the capillary, and the flooding pressure differential are known, with a mean statistical error of less than 4%. This regression model allows predicting degradation rate values in short times and with good approximations, beneficial when the loss of viscosity in CEOR processes can be mitigated, from polymer solution preparation facilities to its flow in the reservoir.