


 Inglés (pdf)
 Articulo en XML
 Referencias del artículo
 Enviar articulo por email
 Citado por SciELO
  Citado por Google
  Similares en
SciELO
Similares en
SciELO  Similares en Google
 Permalink
1. INTRODUCTION
In recent decades, greater concern has arisen about the optimization of energy usage and conservation of non-renewable energy resources. The consequences of phenomena such as global warming and oil depletion have given rise to more stringent environmental policies leading to a large number of projects aimed at making industrial processes more efficient and also seeking for new power generation alternatives. The depletion of light oil resources has forced the industry to maximize the exploitation of the remaining resources. Therefore, it has become imperative for the petroleum industry to develop new technologies enabling the exploitation of heavier oil resources, which have been left out due to the cost associated with its exploitation [1]. Now, as the oil demand keeps growing every year, refining processes are being adapted or developed for the conversion of this heavier feedstock into more valuable products. The Fluid Catalytic Cracking (FCC) process is a subsystem with great potential for efficiency improvement [2],[3]. FCC is a continuous process in which a circulating fluidized system mixes gaseous feedstock with a solid catalyst for upgrading via a catalytic reaction. FCC has been used for over 60 years in the processing of petroleum feedstock [4]. More recently, this process has been used to upgrade heavy crude oil into more valuable products [5], such as gasoline and naphtha. Since its introduction, FCC has experienced improvements due to a better understanding of chemical processes involved in catalytic cracking [6] and fluid dynamics interactions between gas and catalyst particles [7]. Traditionally, the FCC process was carried out in a vertical reactor called a riser, where both vaporized hydrocarbon feedstock and solid catalyst flow in the direction against gravity. In recent years, the study and implementation of downer reactors have increased considerably. In this reactor type, gas and solid flow downwards in the direction of gravity, producing more uniform axial and radial flow structures, enhancing gas-solid contact, and eliminating hot spots, which result in more uniform cracking reactions over the cross-section, added to better product selectivity. Additionally, downers have shorter development lengths than risers, which makes them suitable for having short contact time reactions.
Although the study of downer reactors started a few decades ago, a limited number of experimental set-ups for flow dynamics analysis has been developed. Wang et al. [25] studied hydrodynamics aspects in a downer reactor with an inner diameter (i.d.) of 140 mm and a length of 5.8 m, for a cold gas-solids flow. The authors found that particle velocity and concentration are more uniform than those in riser reactors. The bed material was an FCC catalyst with a mean diameter of 59 μm and a density of 1545 kg/m3. The ranges of gas velocity were between 2 to 8 m/s, and 30 to 180 kg/m2s for the solid mass flux.
Regarding flow structure, they showed that solid concentrations are relatively low in the central core region and near the bed wall. There is an annular region of high solid concentration between the core and the wall. It was also found that the radial solid concentration profile is mainly dependent on the average cross-sectional voidage, regardless of actual operating conditions and axial positions.
Later on, Zhu et al. [26] investigated the contact efficiency between gas and solids particles in the entrance region of a 9.3 m tall and 100 mm i.d. co-current Down-Flow Fluidized Bed Downer (CDFBD), using FCC particles with mean diameter of 67 um and a density of 1500 kg/m3. The results indicated that gas and solid mixing is mainly dependent on the distributor design. The highest contact efficiency is found immediately below the distributor and then it decreases. Further down the column and along the axial direction, the contact efficiency first increases slightly to a peak in the region where the radial flow develops quickly and gradually decreases to reach a constant value. In the same downer experimental system, Zhang and Zhu [27] showed that the fully developed section, the flow inside the downer, is almost an ideal plug flow. They also observed that the reactor size affects the shape of the velocity and flux radial profiles and that a peak in the solid holdup radial distribution is located about 7 mm away from the wall despite the diameter of the downer. The peak disappears in the fully developed zone for gas velocities above 3.7 m/s.
Lehner and Wirth [28] studied the influence of a gas-solids distributor on the flow structure in an 8.6 m tall and 150 mm i.d. downer reactor. The investigations showed a change in the flow structure after an entrance length of approximately 4 m; when a height of 6 m is reached, the structured flow presents similar solid concentrations distributions for every velocity ratio (gas velocity/solid velocity). Nova et al. [29] studied the particle clustering phenomena in downer reactors. They found that the particles evolved as particle strings with broad size distribution in a downer column of 3 m with a 2.63 cm diameter. The FCC particles used in the experiments had an average diameter of 76 μm and a density of 1722 kg/m3. Qi et al. [30] used the same experimental set-up in [25] to study friction between gas-solids suspension and downer reactor wall for the developed zone. They found that friction cannot be neglected as it causes a significant deviation of the actual solids concentration from the apparent one. Later on [31], the same authors focused on the solid concentration in the fully developed zone and found that it is not only a function of the corresponding terminal velocity but also of the particle density and diameter. Further, they showed that the downer diameter has little influence on the solids concentration in the fully developed region.
Recently, Wang et al. [32] studied the axial flow behavior in a high flux gas-solids downer. They showed that solid holdup higher than 0.06 m3solid/m3total could be achieved with relatively uniform axial profiles when solids flux is increased up to 700 kg/m2s. From experiments, they found that the solids circulation rate plays a crucial role in distributing solid holdup. The CFB system configuration design is strongly influenced by the available measuring technology and budget. Each CFB system represents a new challenge as there is no general agreement on the hydrodynamic behavior of a two-phase gas-solids co-current down-flow in a reactor. Therefore, different responses are expected for different combinations of reactor diameter and length, and operating parameters such as gas velocity, solids circulating ranges, particle diameters, and density, among others.
With the development of Computational Fluid Dynamics (CFD) simulation software, researchers can study gas-solids flow inside reactors in a much effective way when validated computational tools are available. For CFD studies of gas-solids flow in fluidized beds, two main approaches can be followed: Eulerian-Eulerian or Eulerian-Lagrangian. In the first case, both phases, gas and particles (solid), are treated as an inter-penetrating continuum. Since its introduction to fluidized bed modeling by Sinclair and Jackson [9], the Kinetic Theory of Granular flow (KTGF) has been widely applied to model the motion of solids and to obtain a close form of the solid-phase momentum balance [10,11]. In the Eulerian-Lagrangian approach, the gas phase is treated as a continuous phase, while the motion of each particle is calculated using Newton's second law. CFD simulations with a similar approach can be found in [12]-[14]. The main difference between these two approaches is that Lagrangian formulation, commonly applied in the framework of the Discrete Element Method (DEM), allows for the detailed study of the interaction between phases and particles at a micro-scale. However, the Eulerian-Eulerian approach, which is used in this work, provides essential advantages as compared with the DEM approach, such as less computational effort and not solid concentration restriction for simulations, as CPU time does not depend on the number of particles but on the mesh size.
In an Eulerian model, continuity and momentum conservation equations are solved for each phase separately. Although the gas phase transport coefficients may be reasonably represented by those for a single-phase flow with certain modifications, the transport coefficients of the solid phase must account for gas-particle interactions and particle-particle collisions [15]. To do so, the KTGF model, developed by Lun et al. [16], estimates the solid phase transport coefficients. A drag force represents the interphase momentum transfer between gas and solid; different empirical correlations have been proposed to calculate this drag force, including those by Syamlal and O'Brien [17], Wen, and Yu [18], and Gidaspow [19]. These three approaches are based on similar mathematical models and variations appear only when working with dense multiphase flow. The Gidaspow drag model is a combination of the Wen and Yu model and the Ergun equation. The Syamlal and O'Brien model works well with Geldart group A particles, which grouped catalysis particles used in FCC, as long as restitution and specularity coefficient values are adequately fixed. Several works are reported in the literature, whereby CFD is used to study the two-phase gas-solid flow inside a downer reactor employing an Eulerian-Eulerian approach, coupled with KTGF and turbulence models; for instance, see [10],[15],[20].
In response to the issues mentioned above, a computational study is proposed herein to describe the axial development of volume fraction and velocity radial distributions in terms of operational parameters for a cold-flow laboratory-scale downer reactor. Section 2 shows the governing equations solved by Ansys Fluent software, including the boundary conditions implemented. Then, in part 3, the most relevant subsystems of the laboratory CFB system used for validation purposes are described. After a mesh independency study, the validated scheme is used, in section 4, to obtain and analyze the axial development of solid velocity and volume fraction radial distributions along the downer reactor. Finally, in section 5, the development length obtained from CFD numerical results are analyzed in terms of operational conditions.
2 THEORETICAL FRAMEWORK
This chapter introduces the mathematical model corresponding to the fluid dynamics of the Eulerian-Eulerian two-phase flow, i.e., catalyst particles (solid phase) and air (gas phase) flow. Considerations taken for its implementation in the commercial CFD software Ansys Fluent are described regarding governing equations solved and boundary conditions.
GOVERNING EQUATIONS
A two-phase Eulerian-Eulerian model, based on the KTGF, was used for simulating the isothermal gas-solid flow inside a downer reactor.
A rectangular domain represents the downer two-dimensional geometry, given the fact that both particle and gas flow are considered axisymmetric. The corresponding mathematical model includes local mass, momentum, and kinetic energy balances for gas and dispersed solid phases (catalyst particles) [11],[21]-[22], as is presented below.
The continuity equation gives mass conservation for phase q (g for gas and s for solid-phase) expressed as follows,

where
 is the velocity, , ρq is the density and α
q
is the volume fraction, considering that the summation of all volume fractions is unity i.e.
is the velocity, , ρq is the density and α
q
is the volume fraction, considering that the summation of all volume fractions is unity i.e.

The gas-phase momentum balance can be expressed as,
where p is the pressure shared by all phases,
 the gas viscous stress tensor for each phase,
 the gravity vector and K
sg
the interphase exchange coefficient which is related to the interaction force between phases (drag force). For a binary system K
sg
=K
gs
. The q-phase stress tensor,
the gravity vector and K
sg
the interphase exchange coefficient which is related to the interaction force between phases (drag force). For a binary system K
sg
=K
gs
. The q-phase stress tensor,
 , is defined as follows:

being μ q and λ q the q-phase shear and bulk viscosity, which are calculated, for the solid phase, according to the KTFG model, as it is explained below. On the other side, the solid momentum balance is expressed as follows,

where P s is the solids pressure, given by Equation 6 and derived from the KTGF in terms of the radial distribution function g 0 , calculated by Equation 7, and the coefficient of restitution for particle collisions e [16].

The solid pressure accounts for the change in the total momentum transport due to its particle motion and their interaction. It is composed of two terms, one kinetic that dominates in dilute regions, and the other for the dense regions that account for the collisions between particles. The coefficient of restitution e describes the behavior of the collisions between particles, being 0 for inelastic collisions and 1 for elastic ones. The radial function represents the probability of collisions between particles when the solid phase is dense, and it is defined as,

where α s , max is the packing limit for the solid phase that specifies the maximum volume fraction of the granular phase. Ansys Fluent uses a packing limit of 0.63 for spherical particles. The fluctuating kinetic energy conservation for moving particles is derived from the KTGF and is expressed as follows, in terms of the granular temperature θ, which is proportional to the kinetic energy of the random particle motion,
where ks, y s and φ fs are, respectively, conductivity, collisional dissipation and transfer of solid fluctuating kinetic energy. The conductivity of solid fluctuating kinetic energy is evaluated as follows [19],

where d p is the particle diameter. Collisional dissipation, ys, quantifies the rate of energy dissipation within the solid phase due to inelastic collisions between particles and it is calculated as,

The transfer of the kinetic energy is due to random fluctuations in particle velocity from the solids phase s to the fluid phase f, and can be expressed as

The solid shear viscosity μ s , in Equation 6, is composed of three terms: collisional, kinetic, and frictional [16]. The frictional term is relevant when the solid phase volume fraction is close to the packing limit. Since the solid volume fraction used in this work is far from this limit, the frictional term is not considered. Thus, the shear viscosity is evaluated from,

The solid bulk viscosity λ s accounts for the solid particle resistance to compression and expansion and is given by,

The momentum exchange between the solid and gas phases, K sg , is defined according to the exchange-coefficient model chosen. In this work, the Gidaspow model is used because it is the most common approach in turbulent fluidized bed problems and the one that is reported by literature for similar study cases. This model is a combination of two equations; for dilute local flow, α s ≤0.8, K sg is calculated with the Ergun equation [22],
For dense local flow, α s ≤0.8, K sg is estimated with the Wen and Yu model [19],

where the drag coefficient is expressed as,

and the solid phase Reynolds number, Re s , is calculated as,

Since low solid concentration is expected in the downer reactor, a k-e distributed turbulence model is used. In that case, the k - ε realizable model is applied to the gas phase. In contrast, a Tchen theory-based correlations and Simonin interaction model [23] are used to estimate the solid-phase turbulence quantities such as appropriate particle relaxation time, Lagrangian integral time scale, and solid-phase turbulent kinetic energy. With these quantities, it is possible to include a dispersed phase influence on the gas-phase turbulent model given by k-e equations. Although the default Ansys Fluent dispersed turbulent model does not correct the interphase exchange coefficient K sg , indirect influence of particle turbulent kinetic energy on granular temperature is achieved through interaction terms in gas phase k-e equations and gas velocity in interphase exchange coefficient (14). The kinetic energy transfer between phases, given by Equation 11, depends on gas velocity and turbulent interaction terms and, hence, the distributed turbulence model is coupled to the KTFG equations.
BOUNDARY CONDITIONS
There are two boundary conditions for the riser walls: granular temperature value θ W and no-slip condition for all velocities, except for the tangential velocity v t,W of the solid phase. In this work, the boundary conditions proposed by Johnson and Jackson [24] are used as follows,
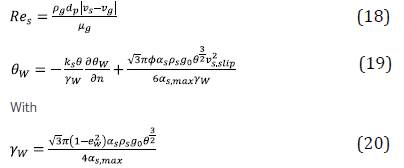
where v s,W is the velocity of the solid phase at the wall, ϕ is the specularity coefficient, n is the normal unit vector, v s,slip is the slip velocity of the solid phase at the wall and e w is the restitution coefficient between solid particle and wall.
3. EXPERIMENTAL DEVELOPMENT
The CFB laboratory-scale system used in this work for validation purposes and schematically presented in Figure 1, is made up of a downer section with a gas-solid distributor at the entrance. A simple and cost-effective flow distributor design for a laboratory-scale setup is based on perforated plates or metal grid meshes [33]. In the present CFB system, the gas-solid distributor for the downer reactor consists of a thick perforated PA plate with the pattern presented in Figure 2. Proper distributor length and porosity were estimated in terms of a pressure drop that allows the correct gas-particle flow rate through the downer reactor, directly connected to the distributor.
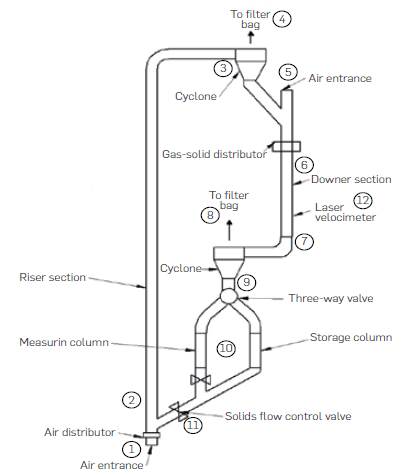
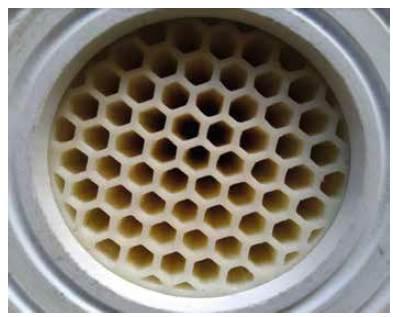
Figure 2 Distributor pattern used at the inlet of the downer section of the laboratory cold-flow CFB.
After the downer reactor exit (7), there is a cyclone (8) that separates solid particles from the air; the gas goes to a filter, and solids move downwards to a three-way valve (9). From there, solid flow can be directed to the storage tank (10) or the solids mass flow measuring column. At the end of these columns, the system rejoins and connects to a vertical pipe or riser section (2), which has a gas distributor (1) at the bottom whereby gas enters and transports solids upwards. At the end of the riser, there is another cyclone (3) that separates the phases again; the gas then moves to a filter (4), and solid particle falls into a wye where they come in contact and premix with gas (5) to enter the downer distributor (6) as a two-phase flow. The fiber-optic probe laser Doppler velocimeter (12) is located 1.8 m below the downer distributor to measure the particle velocity radial profile.
In general, the CFB system height depends on the downer length. For this work, the available space was a limitation. Consequently, the downer section length was chosen to be the minimum possible that allows laboratory-scale hydrodynamics study, according to sizes found in the literature. As mentioned in the previous section, flow development inside the downer not only depends on reactor length but also on its diameter and operational conditions. As the diameter increases, the reactor needs to be longer to achieve developed flow profiles. Therefore, the smallest diameter of the reactor was also desirable.
Regarding these considerations and following the recommendations of Professor Hugo De Lasa and his research team from the University of Western Ontario, the downer section dimension was selected as 2 m length and a 2 in i.d., corresponding to the minimum diameter recommended in order to avoid significant wall effects. In this regard, the available space was distributed according to the peripheral equipment sizes. For instance, the maximum height between the upper cyclone outlet and the gas-solid distributor was restricted to 50 cm. However, downer inlet particle velocity is not only given by this height but by the pressure difference between air entrance and air going out from the upper cyclone, which was controlled by a valve installed on the line connecting high cyclone to the filter bag.
Parameters commonly measured in the downer laboratory system are the solid and gas local velocities and solid holdup (local particle concentration). Based on these data, axial and radial flow structures can be obtained. In this case, gas velocity was measured by using rotameters located at air inlet pipes. The solid mass flow rate was obtained using the height differences (AH) in the measuring column for a specified time (Δt), according to equation (21) where ρ's is the apparent density of solids, and A is the column crossed section.

The local particle velocity was determined by a fiber-optic probe laser Doppler velocimeter, which was introduced at a distance of 1.8 m from the downer section inlet. The monitoring system used was developed by the Photonics and Optoelectronics and Reactive Flows (FRUN) groups of the National University of Colombia-Medellin, as part of the research project to which this work is attached. This measurement system consists of a hybrid fiber-optic probe in the near-infrared. This hybrid probe comprises fibers with different numerical apertures, allowing control over the size or volume of the measurement, even for volumetric fractions of solids less than 0.1 [34], Configuration used is MMF-SMF-MMF, where multimode fibers (MMF) are a 62.5/125 μm graded-index fiber with a numerical aperture of 0.275. In contrast, single-mode fiber (SMF) is a 9/125 μm graded-index fiber with a numerical aperture of 0.15.
4. RESULTS
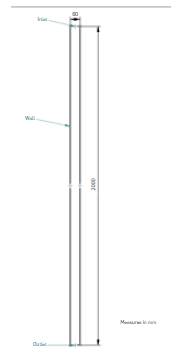
For computational purposes, a 2D rectangle with a 6 cm width and 2 m long (Figure 3) was used to represent the downer section of the CFB laboratory cold-flow model. The top part corresponds to the downer inlet, where both gas and solids enter the reactor with different velocities specified as inlet boundary conditions. The bottom is the outlet boundary where outflow conditions are fixed. The lateral boundaries of the rectangle correspond to the reactor walls, where boundary conditions presented in section 2.2 are applied. Given the fact that the downer flow is mainly axial due to the reactor geometry and the effect of the inlet distributor, computational results are obtained by solving governing equations in an axisymmetric reference frame. Using a 2-D approach, sensibility analysis concerning restitution and specularity coefficients and assessment of the influence of operational conditions on flow development could be performed in a suitable CPU time.
In section 4.1, a mesh Independency study was performed to have a proper mesh size. The resulting spatial discretization Is used for validation purposes in section 4.2. The comparison between numerical results and experimental measurements at similar operational conditions enable us to validate the numerical scheme. Finally, in section 4.3, the validated procedure (including model parameter values) is used to find solid velocity and volume fraction distributions at different operational conditions. Based on those computational results, flow development aspects in the downer reactor are discussed.
MESH INDEPENDENCY STUDY
A mesh Independence study was performed to guarantee a grid-independent solution. Six different meshes, whose sizes are shown in Table 1, were chosen for discretizlng the interior domain representing the laboratory scale downer reactor. Two-dimensional structured meshes were refined in the first acceleration zone, which corresponds to the region close to the inlet boundary. Due to differences between air and solid velocity, high momentum exchange values given by Equations 14 or 15 are obtained in this zone. Therefore, a refined mesh is required to capture solid-gas momentum interaction.
Table 1 Meshes sizes used in the 2D study comparison
| Mesh | ||||||
|---|---|---|---|---|---|---|
| 1 | 2 | 3 | 4 | 5 | 6 | |
| # elements | 15090 | 95152 | 240240 | 490800 | 567816 | 613440 |
Simulations for meshes proposed, with computational parameters shown in Table 2, were performed by defining, as solid phase, spherical particles with a mean diameter of 74 μm and a density of 1520 kg/m3. The gas phase, defined as air, was set with a density of 0.995 kg/m3 and a dynamic viscosity of 0.02 mPa.s, which correspond to average properties at atmospheric pressure and temperature at CFB installation place. The operational parameters were chosen as the average values found in the literature for similar size downer reactors studies: a gas velocity of 4 m/s and solid flux of 50 kg/m2s. Other computational parameters were selected following Ansys Fluent recommendations and the state-of-the-art guidelines for this kind of problem. The turbulence model and KTGF parameters were chosen according to a sensibility analysis in which CFD model results were compared to the experimental measurements reported by Zhang et al. [27]. High specularity coefficient values (around 1x10⁻³) lead to the displacement of the solid volume fraction peak in radial distribution (high solid concentration annulus) towards the reactor axis. Low specularity coefficients (around 1x10⁻⁵) produce unphysical double peak volume-fraction radial distribution. The radial solid velocity profile exhibits a peak close to the wall for high specularity values, which is not reported in experimental measurements. When the particle wall restitution coefficient is increased, the solid volume fraction peak is reduced, and the volume fraction and velocity radial profiles get closer to observed behavior. Finally, the granular inlet temperature, in the range between 1x10⁻³ and 1x10⁻¹, does not have a material effect on radial profiles of solid volume fraction and velocity in downer reactor flow. For further details on the sensibility analysis for the KTGF model, see the authors' results included in [35-36].
Table 2 Ansys Fluent computational model
The solid fraction and dimensionless axial velocity radial profiles, at different downer distances from the inlet, are shown in Figures 4 and 5 for the meshes used. Figure 6 shows the axial pressure coefficient profile in the axis line along the downer length. Dimensionless solid velocity was obtained after dividing the solid velocity by inlet gas velocity (U g □ ), while the pressure coefficient was given by Cp=2p/ (pgU2 g). As the mesh gets denser, solid volume fraction radial profile gets closer to each other. Also, when increasing distance to the downer entrance, the different meshes render the same results, especially for meshes M4, M5, and M6. This is coherent with the development of volume fraction along downer length. As the two-phase flow goes down along the downer, the dense solid ring moves towards the axis.
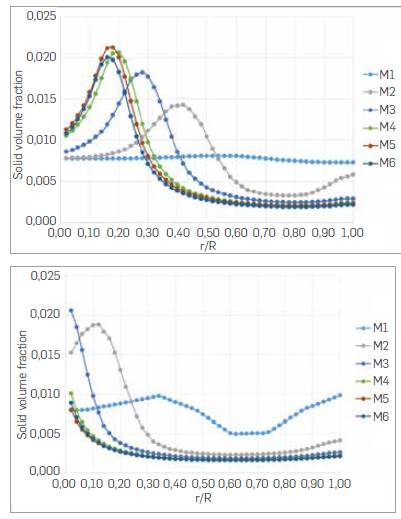
Figure 4 Radial profile for the solid volume fraction at downer distances from the inlet of 0.95 m (left) and 1.8 m (right).
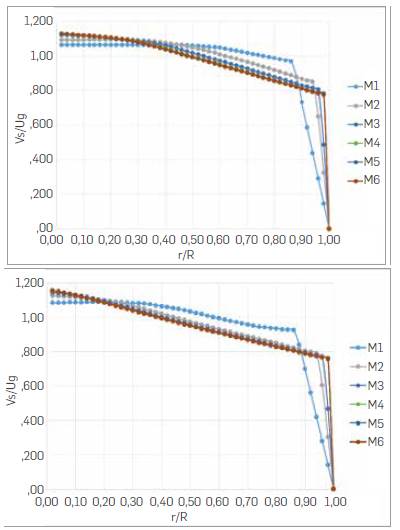
Figure 5 Radial profile for the solid axial velocity at downer distances from the inlet of 0.95 m (left) and 1.8 m (right).
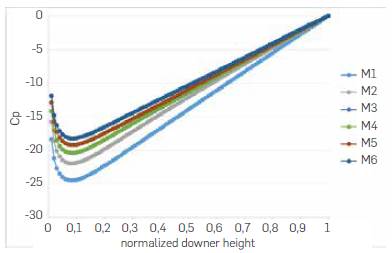
Given that the solid velocity field develops faster than the volume fraction, the similarity among the results from the different meshes is more reliable even in the zone near the downer axis. The radial profile is more uniform than the solid holdup, consistent with measurements reported in [27] and supported with the axial pressure profile in the axis line, as shown in Figure 6. Pressure profiles, for meshes M3 to M6, exhibit the same length for the different zones Inside the downer, I.e., the first and second acceleration zones, and the constant velocity zone, which were introduced by Wang et al. [25]. They proposed a three-section axial flow structured in the downer. The first acceleration zone begins at the top of the downer and goes to the position where particle and gas velocities are equal. Then, the solids are further accelerated by gravity and experience drag exerted by the slower moving gas. After that, particle velocity increases until the slip velocity, between the particles and the gas, reaches a value where the drag force counter-balances the gravitational force, which is called the second acceleration zone. Next, both particle and gas velocities do not change in the rest of the downer length, defining the constant velocity section, where particles travel faster than gas, although at a continuous slip velocity.
Figure 6 shows how the mesh size is determinant to capture wall friction effects and momentum interaction between gas and solid phases in steady gas-particle flow. As the mesh size is increased, a better estimation of momentum exchange and KTGF parameters is possible by improving accuracy in solid and gas velocity gradients. Therefore, higher values for momentum transfer between particles, gas, and walls are obtained. This leads to the total pressure gradient being reduced, as a higher friction head is subtracting from the constant hydrostatic head in gravity direction flow.
According to the foregoing, a grid-independent solution for the two-phase flow proposed in this work could be achieved with the M3 mesh if only the velocity field were to be considered. Since the volume fraction takes longer to develop, an M4 mesh is more appropriate for the 2D simulations. M4 is a structured mesh with 490800 quadrilateral elements corresponding to 200 divisions in the horizontal direction and 2450 vertically.
VALIDATION AND EXPERIMENTAL MEASUREMENTS
A comparison between the experimental measurements shown in Table 3 and simulation results is performed to validate the computational method implemented based on numerical schemes and parameters included in Table 2. The geometry corresponds to the two-dimensional domain shown in Figure 3, and the mesh used is the M4. The boundary conditions for inlet velocity were changed to obtain operational requirements similar to those in the downer section of the laboratory cold-flow CFB. The inlet gas velocity is 2.5 m/s and the inlet solid velocity of 0.78 m/s with a volume fraction of 0.0125, equivalent to a mass flux of 15 kg/m2s. These conditions correspond to the maximum operating point achievable in the CFB system, given the restrictions of mass flow measurement column and separation devices. Also, inlet gas velocity is close to the minimum value required to attain convergence in the CFD simulation with the parameters used. Therefore, only this operational point can be compared for validation purposes.
Table 3 Laser velocimeter experimental measurements for solid velocity and volume fraction at 1.8 m from downer inlet.
| r/R | Vs [m/s] | αs |
|---|---|---|
| 1,000 | 0,7632 | 0,00517 |
| 0,875 | 0,8284 | 0,00477 |
| 0,750 | 0,7520 | 0,00525 |
| 0,625 | 0,7856 | 0,00502 |
| 0,500 | 0,9964 | 0,00396 |
| 0,375 | 1,0752 | 0,00367 |
| 0,250 | 0,9996 | 0,00395 |
| 0,125 | 1,1028 | 0,00358 |
| 0,000 | 1,1580 | 0,00341 |
As shown in Figure 7, proper agreement was obtained for numerical and experimental radial profiles at a downer distance from the inlet of 1.8 m, where the solid velocity measurement apparatus was located. Solid axial velocity and volume fraction present similar values toward the axis line of the reactor. The same trend is preserved for r/R less than 0.75, showing a decrement in velocity towards the wall and an increment in volume fraction, which reveals the presence of a high-concentration annulus close to r/R = 0.75, as Zhang and Zhu [27] have noted. For greater radius, light reflection effects in reactor walls affected experimental measurements.
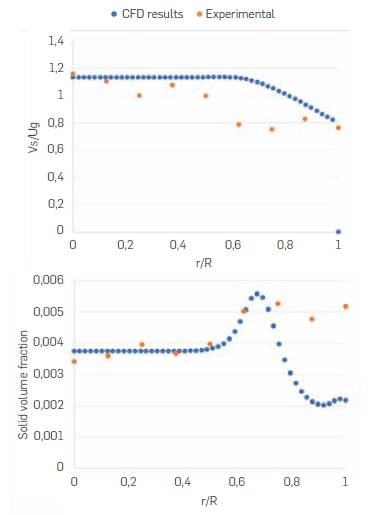
Figure 7 Radial profile for the solid axial velocity (left) and solid volume fraction (right) at a downer distance from the inlet of 1.8 m
Nevertheless, similar deviations have been reported by other authors dealing with computational methods for gas and particle flow simulation in downer reactors. For instance, Zhao et al. [13], after comparing experimental measurements to 3-D computational DEM results, concluded that a good qualitative agreement is obtained and that the deviation observed can be due to differences in particle size, size distribution, and shape. A higher variation in solid volume fraction radial profiles was obtained by Ropelato et al. [10] using a 3-D Eulerian-Eulerian computational model. Although the authors did not achieve qualitative agreement, they suggested that the deviation is caused by the solid feed configuration showing that changes in solid inlet angle provoke drastic differences in volume fraction behavior along the reactor. Better computational results were obtained by Cheng et al. [20] with a 2-D Eulerian-Eulerian model approach, including the KTGF model. Despite the fact that the authors performed a sensitivity analysis for restitution and specularity coefficients and found the characteristic high concentration annulus region in radial profiles, their computational results deviated from experimental measurements in the area close to the reactor wall.
The comparison presented herein allows for validating the numerical methods implemented, despite the uncertainty found in other authors' computational results for the solid volume radial distribution. Therefore, it is appropriate to use the computational tool with the parameters indicated to obtained results for different operational conditions and to study the solid distribution in the pre-acceleration zone of a cold-flow downer reactor at a laboratory scale.
DOWNER REACTOR SOLID DISTRIBUTION DEVELOPMENT
Gas (air) and solid (catalyst particles) velocity combinations were simulated to observe the effect of velocity changes on flow development along the reactor. The inlet solid volume fraction was kept constant at a value of 0.0125 as solid concentrations around 1% are commonly found in the literature for downer systems. A wide range of air inlet velocity and solid inlet flux was considered to find appropriate values for flow development. The computational model mentioned in Section 2.1 was implemented for the laboratory scale downer geometry. The simulation time was set in 30 seconds, which was enough to achieve a stationary and converged solution. Two criteria were monitored to judge convergence: scaled equation residuals defined by Ansys Fluent, and net mass flow rate going out domain computed as the total mass flow rate (line integral) through outlet minus total mass flow rate through inlet. The simulation was stopped once scaled equation residuals get a value less than default tolerances of 1x10⁻³. In cases where the net mass flow rate was below a predefined relative tolerance, steady simulation results were obtained and used for analysis; otherwise, the simulation was repeated using current values as the initial guess.
Regarding the solid volume fraction and velocity obtained from simulations, as they are shown in contours of Figure 8, a more straightforward way of representing flow development inside the downer reactor was implemented using reduced property parameters presented in [27]. In this case, the reduced parameter (velocity or solid volume fraction) is the local property divided by the radial mean property value for a given downer height, as follows:


These reduced parameters allow to analyze quantitatively the flow development. For a completely developed flow, the reduced parameter plotted should show a flat line. Converged solutions were obtained for 18 gas velocity/solid flux combinations. Figure 8 shows the contours for the solid volume fraction (left) and the solid axial velocity (right) for a gas velocity of 4 m/s and a solid flux of 50 kg/m2s at a section located at a distance around 1.8 m from the downer reactor entrance. Both contours show a clear flow pattern: an annular type flow occurs having the highest axial velocity in the center of the downer and the highest solid concentration midway between the wall and reactor axis.
Figure 9 shows the reduced solid velocity plotted against the downer length for 5 different cases. Each line represents a different radial position. For all gas velocities, a general trend is evidenced; the solid velocity field reaches the developed state in smaller length as the solid flux decreases, which is also confirmed by measurements in [27]. Chosen cases in Figure 9 represent the general trend for all the simulation range. As mentioned above, as gas velocity and solid flux decrease, the velocity flow field is closer to development. For the cases, 2.5 m/s - 15 kg/m2s and 3.5 m/s - 30 kg/m2s, the velocity development is similar for all radial positions. It starts in the half of the downer length (1.0 m) for the zone close to the riser wall. In the inner region, velocity development occurs at a higher distance from the entrance. As the gas velocity increases, the reduced particle velocity has significant differences among the positions in the downer radius. While the velocity near the downer center shows the beginning of development flow, the zones near the wall are still in an acceleration state. Also, the point where profiles on-axis line starts to develop moves further down the downer length.
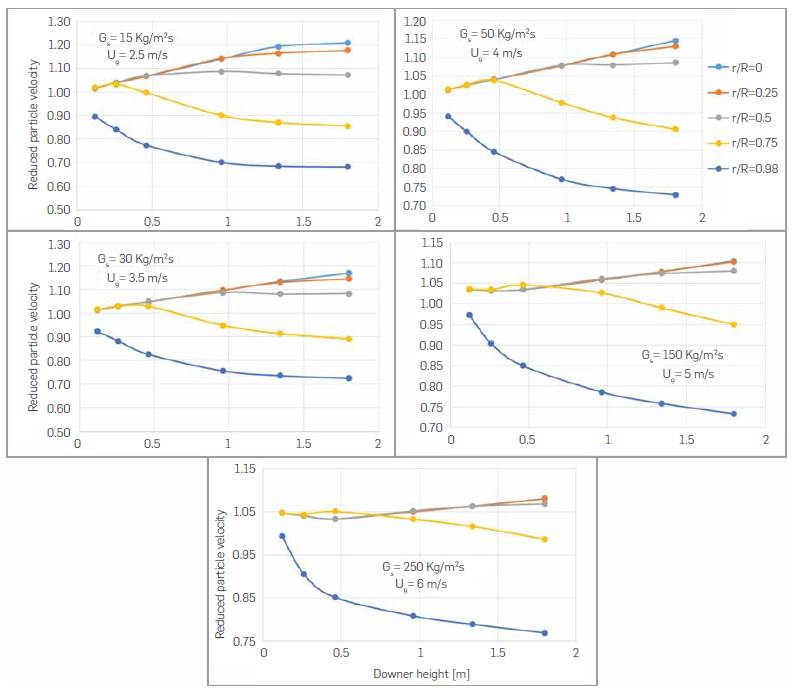
Figure 10 shows the same five cases for the reduced solids volume fraction inside the downer. For the low part of the simulation range, the solid velocity is close to the development, whereas, for the particle concentration, the developed state is still far from being reached. The general trend is: for a fixed solid flux, and as the gas velocity increases, the volume fraction near the wall zone and the central zone of the downer shows a clear tendency to the flow development from the second half of the downer length, while half radius distribution is still in an acceleration state. This is due to the presence of a denser particle ring in this area. For the same solid velocity, there is not a clear tendency for the solid concentration development profile in terms of solid flux. In most cases, the higher the solid flux, the higher development length for the solid volume fraction field.

5. RESULTS ANALYSIS
Additional to the reduced quantities, two other parameters were calculated to assess flow development. These parameters were the theoretical development length, Ldev, and the percentage of development, %dev. The development length is an empirical correlation that predicts the length at which the flow has already developed, and it is expressed as,

This correlation was developed for single-phase flows. Therefore, in this work, the Reynold number was estimated using the inlet mean density and velocity for the two phases. On the other hand, the percentage of flow development is a comparison between the average slip velocity (uslip) and the single-particle terminal velocity (ut),

with a drag coefficient CD reported in [35] for spherical solid particles and given by,
It is worth mentioning that none of the previous parameters considers the possible effects that the interaction between phases has on the flow development such as cluster formations inside the downer. Therefore, these parameters are not strong estimates. They are merely approximations to the real phenomenon that, along with the computational results, provide a good idea of the flow development state.
Table 4 shows the development length Ldev and the percentage of development %dev for the same 5 cases shown in Figure 9. Although there are discrepancies among the two theoretical parameters and the simulation results, some similarities can be found. Both the reduced solid velocity distribution and the theoretical development Length coincide in the fact that for higher solid fluxes, higher development lengths are obtained. Although the tendency is not met, the percentage of development agrees with the simulations results in the cases where a developed flow field is not reached. As observed with the reduced parameter, for lower gas velocity and solid flux, the development state is closer to be reached. However, for the higher part of the range, the %dev is closer to the developed state, while simulations results show zones far from reaching development.
Table 4 Theoretical solid velocity field development in the downer
| Case | % Dev | L dev |
|---|---|---|
| 2.5 m/s - 15 kg/m²s | 77% | 1.77 |
| 3.5 m/s - 30 kg/m²s | 68% | 1.97 |
| 4 m/s - 50 kg/m²s | 64% | 2.14 |
| 5 m/s - 150 kg/m²s | 70% | 2.55 |
| 6 m/s - 250 kg/m²s | 79% | 2.77 |
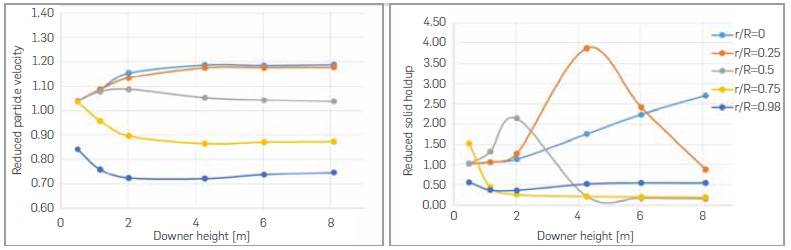
In order to illustrate what a developed field would look like for the downer reactor, another simulation was carried out for the case with 4 m/s - 50 kg/m2s in a downer length of 9 m. The result for the solid velocity in the longer downer is shown in Figure 11 (left) It can be seen that the reduced parameter plot has flattened, which means that no significant changes in velocity take place. This would describe a more uniform flow structure inside the downer reactor.
The solid volume fraction in the longer downer does not show the same behaviour because, for this particular set of parameters, the solid peak changes radially with distance. For the first part of the downer length, the ring is located near the wall; however, as the solid descends into the downer reactor, the ring migrates towards the center. This can be observed in the reduced particle hold up for the 9 m downer in Figure 11 (right). For the two radial positions closer to the reactor wall, the solid holdup develops. In the downer center, the solid holdup starts to increase with an almost constant rate, while values on lines r/R = 0.25 and 0.5 grow to a certain point and then rapidly decrease. This behaviour is observed because the diameter of the downer reactor is not big enough to avoid wall effects. As Zhang et al. concluded about the results obtained by Herbert [37], the peak in the radial solids holdup is closer to the center due to the relatively more significant wall effect in a small (0.05 m) downer [27] that is similar to the downer reactor diameter analysed in this work.
CONCLUSIONS
Two-dimensional cold-flow simulations of a laboratory-scale downer reactor were performed using Ansys Fluent software to describe and analyze the development of catalyst particle distribution along the reactor. A mesh independency study and validation with experimental measurements were performed to set up the computational parameters that allow attaining realistic results despite the uncertainty reported in numerical results and measurements in the region close to the reactor wall. The experimental data of local particle velocity and volume fraction were obtained by fiber-optic probe laser Doppler velocimeter installed in a cold-flow laboratory-scale CFB. Although the computational model used in this work does not consider cluster formations and other complex interactions, it was useful to predict solid volume fraction radial distribution and particle flow development in this type of reactor. According to axial distributions of reduced particle velocity and volume fraction obtained, the flow development cannot be estimated by considering only solid axial velocity changes as reported in the literature. It is necessary to consider the solid volume fraction axial variations since radial profiles can change even when velocity profiles are developed, which was observed in the numerical results for the laboratory scale cold-flow downer. Future work in numerical simulations for other geometry scales will be carried out to study the effect of reactor diameter on the solid volume fraction axial distributions. Also, there is work to do to improve experimental measurements and the direct coupling between solid dispersed turbulence models and the KTFG model to reduce the deviation found in volume fraction in the near-wall region.

