


 Inglés (pdf)
 Articulo en XML
 Referencias del artículo
 Enviar articulo por email
 Citado por SciELO
  Citado por Google
  Similares en
SciELO
Similares en
SciELO  Similares en Google
 Permalink
1 INTRODUCTION
In the face of a paradigm change in the political and social framework As the first large gas field with an annual gas production above 10 billion cubic meters in China, the Kela-2 gas field is a milestone in the natural gas development process in China [1]-[3]. In 1998, Well Kela-2 successfully drilled into the target layer, and obtained high-yield industrial gas flow, which not only marked the successful discovery of the Kela-2 gas field, but also opened the prospect of subsequent exploration and development of a series of gas fields in foreland of the Kuqa Mountain [4]-[5]. In late 2020, the cumulative gas production of the Kela-2 gas field has exceeded 120 billion cubic meters, making it the largest natural gas production single gas field in the Tarim Oilfield. Problems of the Kela-2 gas field were evidenced during its development in the past 20 years, and some gas wells have experienced water flooding, resulting in rapid productivity decrease. It is generally thought that the reduction of formation pressure, and the increased geostress sensitivity are the main factors for the decline of gas well productivity [6]-[7], while the fracture development degree, fracture opening, and fracture orientation of the main seepage are the main controlling factors affecting the productivity of a gas well [8], and the geostress field distribution controls the development of fractures. Therefore, the geostress field distribution, and its relationship with the occurrence of natural fractures are the key factors that affect gas field productivity [9]-[10]. For analyzing factors that affect the productivity of gas wells, the whole section analysis method is commonly used, and the productivity is not assessed by gas pay interval. Gas wells show various production characteristics in the different structural locations. Production logging is used to monitor gas and water production changes every year in the Kela 2 Gas Field. Combined with the main gas pay intervals, change regime, and water production characteristics, the gas wells of the Kela 2 Gas Fields are classified to study the main productivity influencing factors. A specific development scheme is proposed for each well type as the basis for the development plan scheme adjustment, and oil recovery improvement of the Kela-2 gas field.
2. GEOLOGICAL BACKGROUND OF THE KELA-2 GAS FIELD DEVELOPMENT
The Kela-2 gas field is situated on the Kelasu structural belt of the Tarim Basin. Under the thrust of South Tianshan orogenic belt, the foreland basin structure is formed by mountains in the North and basin in the South, and the sedimentary facies are dominated by alluvial fans, fan deltas, and braided river deltas. The reservoirs are the Paleogene dolomite formation (E1-2km3), Kumgeliemu Group dolomite formation (E1-2km4), glutenite formation (E1-2km5), and Cretaceous Bashijiqike thick sandstone Formation (K1bs). The main reservoir is the Cretaceous Bashijiqike formation (K1bs), which contains 5 sections: K1bs2 3, K1bs2 2, K1bs2 1, K1bs1 2, K1bs1 1 from bottom to top. Average porosity is 12.4%, and average permeability is 49.4x10⁻³µm2, belonging to medium -porosity and medium-high permeability to low-porosity and medium-low permeability reservoirs, which have better reservoir physical properties than the Keshen and Dabei gas fields [11]-[15]. The buried depth of the reservoir is 3500m-4100 m, the original formation pressure is 74.35Mpa, the formation pressure coefficient is 2.02, and the original formation temperature is 100°C. It belongs to a normal temperature, abnormally high-pressure block edge-bottom water dry gas reservoir.
The study of the single-well reservoir physical properties in the Kela-2 gas field, determines that the permeability of calcareous cemented sandstone and argillaceous sandstone is generally less than 0.1x10⁻³ym2, while the permeability of medium-fine sandstone, with weak cementation and strong dissolution, can reach more than 1000x10-3µm2, showing strong heterogeneity. The physical properties of the reservoir in the East are better than those in the West in the plane, and the middle of the reservoir (the second member of the Bashijiqike Formation) has the best physical property in vertical direction, which is the main gas pay section. A series of high permeability belts are developed within the reservoir, with a total thickness of 671.7 m, accounting for 13.5% of the effective reservoir thickness. High permeability belts can provide favorable conditions for reservoir connectivity and gas migration, on the one hand, and on the other hand, they provide channels for edge water breakthrough, resulting in rapid invasion of formation water into gas reservoirs along the belts. The southern part of the Kela-2 is blocked by large faults, and the northern water body is relatively small. The water invasion of the gas reservoir comes mostly from the huge water body in the East and West.
There are 27 wells in the Kela-2 gas field, and 23 wells are currently active, with a daily gas production of 1788x104 m3/D, a daily water production of 333 t/D, a gas production rate of 2.6%, and a geological reserve gas recovery of 42.3%. The formation pressure measured in March 2020 was 39 MPa, the pressure decrease was 2.1 MPa/ year, and the gas production per unit pressure decrease was 4 billion m3/MPa. The formation pressure of each well has decreased simultaneously, suggesting a good connectivity a large. Affected by formation water, the formation pressure in the East and West of the gas reservoir is slightly higher than that in the middle section. The formation pressure in the East is higher than that in the West, which means that the water body in the East is larger than that in the West.
3. CLASSIFICATION OF GAS PRODUCTION PROFILE IN THE KELA-2 GAS FIELD
The gas production profile is classified and studied from the variation of multi-layer gas production (water production) of a single well to the variations of a single gas production (water production) layer; the reasons for the variation of gas reservoirs in each type of gas production profiles are analyzed, and the main controlling factors of gas production variations are determined, providing guidance for reasonable production allocation of single wells, development scheme adjustments, and engineering transformation measures. As one of the most used and direct dynamic monitoring techniques in oil fields, gas production profile logging can better monitor dynamic parameters such as downhole stratified gas production, water production, and pressure changes [16]-[19]. It includes mainly gas production, contribution rate of gas production, and gas production intensity [20-21]. By analyzing gas and water production from gas production profile test every year, it is possible to determine the uplift height of the gas-water contact, water invasion characteristics, and change of production performance parameters [22]-[23]. The downhole production logging tool was used in the Kela-2 gas field, which mainly conducted stratification tests in the perforation zone for seven logging series of natural gamma, magnetic positioning, pressure, temperature, water holdup, tuning fork density, and turbine flow. The test data were processed and interpreted, and a single gas -phase or gas-water-phase flow model was established by analyzing fluid density, water holdup, temperature, and pressure curves, to calculate production and production properties of each gas pay [24]-[26],
A total of 86 gas production profile tests have been conducted in 14 wells in the Kela-2 gas field since 2009, obtaining abundant production performance data, which are the grounds for gas "reservoir performance analysis. The single well is divided into four types (Table 1) according to whether water production existed in gas wells, and whether the main gas pay changes. Among these, there are 6 wells with the main gas pay changes caused by water production, accounting for 42.9% of the wells tested.
ANALYSIS OF CAUSES FOR THE CHANGES IN THE MAIN GAS PAY OF TYPE I WATER-PRODUCING WELLS
According to the characteristics of water production, the type I wells (main gas pay changed with water production) can be further divide not two types: a. vertical channeling-lateral invasion type, where the edge water (or bottom water) first invaded vertically along the fault to the upper strata, and then invaded the gas well laterally; b, edge water lateral invasion type, edge water invades the gas well along the high permeability belts.
A. VERTICAL CHANNELING-LATERAL INVASION TYPE
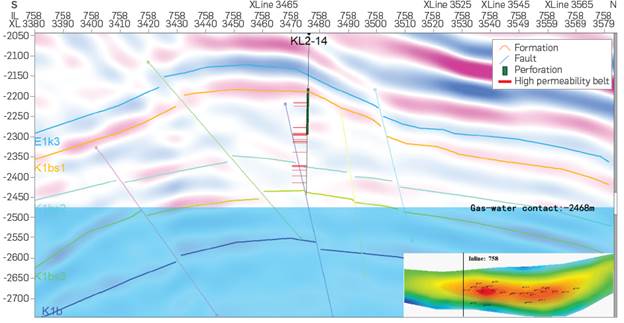
There are 3 vertical channeling-lateral invasion gas wells (KL2-14, KL203, KL2-13), accounting for 50% of type I wells, which are concentrated in the western part of the gas reservoir and close to the edge water of the gas reservoir. The faults developed around the well nave a long longitudinal extension, and the lower part of the fault s located under the gas-water interface, with relatively large fault throw, breaking the barrier layer that can block the bottom water and high permeability belts and fractures are developed locally.
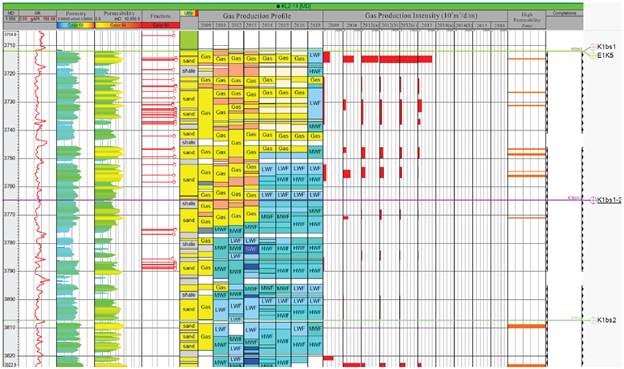
Using well KL2-14 as an example, the well is in the West of the gas "reservoir. A total of 10 gas production profile tests were conducted between 2009 and 2016. In 2012, the main gas pays changed from segment 3820m-3826m of K1bs2 1 to segment 3712m-3716m of Ex„ 2km5. Well KL2-14 has a perforation avoidance height of 172m, and the bottom of the perforation is 726m away from the water in the southwest. The rapid increase in water-gas ratio in 2009 confirmed that the gas well produced water. There are many third-class faults developed around the well, and all extend below the gas-water interface, providing a channel for the rapid coning of bottom water (Figure 1). It can be seen from the single-well logging histogram that high-permeability belts and fractures are developed in the original main gas pay segment of 3820m-3826m (Figure 2). With the decrease of the internal pressure of the gas reservoir, the bottom water first enters the reservoir near the wellbore vertically alone the fault, and then enters the gas well along the high permeability belts and fractures, resulting in the water production of the main gas reservoir and the decrease of gas productivity.
B. EDGE WATER LATERAL INVASION TYPE
There are 3 edge water lateral invasion gas wells (KL2-12, KL2-8, KL2-1), accounting for 50% of type I wells, distributed in the East, North, and West of the gas reservoir, which is farther away from the edge water and closer to the middle of the gas reservoir than the vertical channeling-lateral invasion type. Faults are small or underdeveloped around the well, and high-permeability belts and fractures are developed locally.
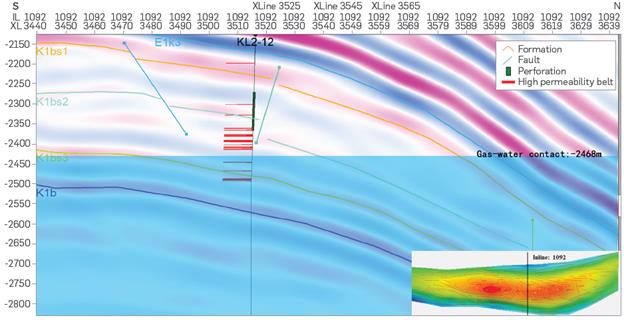
Using Well KL2-12 as an example, this well is in the North of the gas reservoir. A total of 12 gas production profile tests were conducted between 2009 and 2019. In 2012, the main gas pays changed significantly from segment 3824m-3829.5m of K1bs2 1 to segment 3,788.4m-3,796m of K1bs1 2. In 2012, three gas production profile tests were conducted at the wellhead productivity of 450,000 m3/D, 700,000 m3/D, and 1.1 million m3/D (Table 2). Except for the contribution rate of gas production of tested layers 1, 3, and 7, which decreases with the increase of wellhead productivity, the gas production of other layers all increase as wellhead productivity increases. The change of the production contribution rate is mainly controlled by the formation pressure and the physical properties of the reservoir. The gas pay with good reservoir physical properties reflects the characteristics where the production contribution rate greatly varies with the change of wellhead productivity.
The bottom of the perforation in Well KL2-12 is close to the bottom water, with a perforation avoidance height of 102m, and the distance between the perforating bottom and the northern edge water is 355m. Compared to the real formation water chloride content value below 1000mg/L, the rise of 50,000 mg/L confirmed that the gas well produced water in October 2010. A small number of small-scale faults are developed around the well KL2-12 with small scale (Figure 3). High permeability belts and fractures are developed in the original main gas pay of 3824m-3829.5m. The gas productivity is high before water breakthrough, with an average gas production of 354,663 m3/D from 2009 to 2011. As the development progresses, the pressure of the gas well decreases, and the edge water invades into the gas well rapidly along the high permeability belts and fractures, resulting in the rapid decrease of main gas pay productivity and water production in 2012.
CAUSE ANALYSIS FOR THE UNCHANGED MAIN GAS PAY OF TYPE II WATER-PRODUCING WELLS
There is only one type II gas well- KL2-10, which is in the East of the gas reservoir. There are no faults around the well, and fractures and high-permeability belts are well developed. A total of 14 gas production profile tests have been conducted in Well KL2-10. The main gas pay is 3641m-3653m interval of E1-2km5, with a contribution rate of gas production of 55.1%-98.3% over the years (Figure 4). The gas production of the main gas pays since 2012 has decreased year by year.
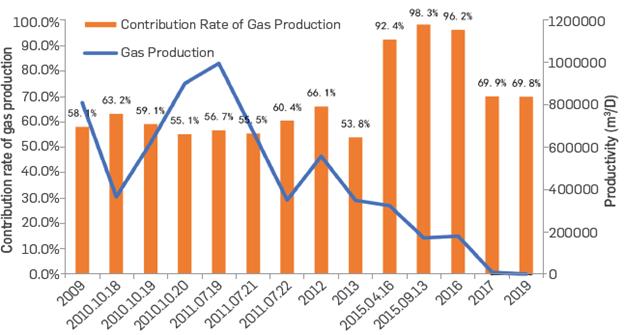
Well KL2-10 is less than 3km away from the eastern water body, with a perforation avoidance height of 170m. Dynamic monitoring in 2015 confirmed that the gas well produced water. The reason for water production in Well KL2-10 is basically the same as that in Well KL2-12, the edge water invades the gas well along the high-permeability belts and fractures. However, unlike well KL2-12, the main gas pay of this well has not changed, which may be due to the higher perforation segment (the perforation bottom is in K1bs1 2), and the physical properties of E1-2km5 are better than that of K1bs1. If the perforating operation is carried out on K1bs2 and the gas production profile test is conducted, it may be inferred that the main gas pay will be in the K1bs2 before water breakthrough, and move up to the current main gas pay after the water production.
CAUSE ANALYSIS FOR THE CHANGED MAIN GAS PAY OF TYPE III NON-WATER-PRODUCING WELLS
There are 4 type III gas wells (KL2-3, KL2-5, KL2-9, KL2-11), in the middle of the gas reservoir with high perforation avoidance height (141m-191m). There are small-scale faults developed or underdeveloped, the fractures are generally developed, and the high-permeability belts are well developed around the well.
Using well KL2-11 as an example, a total of 4 gas production profile tests have been conducted in this well. In 2010, the main gas pays changed from segment 3730m-374Flm of K1bs1 2 to segment 3640m-3644.5m of E1-2kirig. Research on saturation test data shows that the gas-water interface of well KL2-11 is rising at a rate of 10.4 m/year, and is currently 37.4m away from the bottom of the perforation without water production. As the development progresses, wellbore pressure decreases, and the gas seepage velocity along reservoirs with better physical properties is higher than that with poor physical properties. Therefore, pressure changes and physical property differences are the main reasons for the changes in the main gas pay.
(Figure 5). After the water invasion of the gas reservoir, the main and the secondary gas reservoirs are interchanged, and the main gas pay changed from K1bs2 1 to E1-2km5 As the development progresses, the pressure of gas well drops, and the formation water rapidly enters the gas reservoir along faults, high permeability belts and fractures, forming non-uniform water invasion. Therefore, the water invasion of gas reservoir is the main reason for the gas pay change in the Kela-2 gas field, and the water flooding of gas pay will lead to the rapid decrease of gas productivity or even no gas production.
CAUSE ANALYSIS FOR THE UNCHANGED MAIN GAS PAY OF THE TYPE IV NON-WATER-PRODUCING WELLS
There are 3 type IV gas wells (KL2-6, KL2-7, KL2-15), which are mainly distributed in the higher part of the gas reservoir. Since the gas production profile tests were conducted less than twice, the data are not enough for the analysis. It will be studied once new data are added in the future.
4 ANALYSIS OF FACTORS AFFECTING PRODUCTIVITY
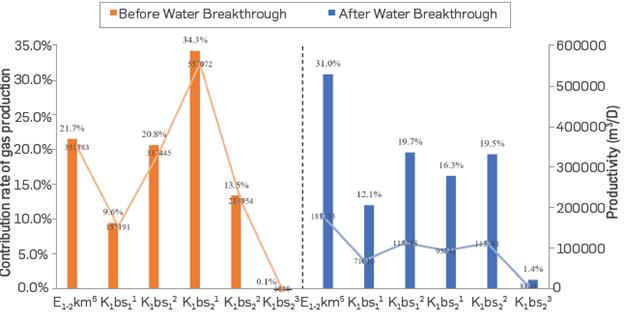
To study the variation of gas pays in the Kela-2 gas reservoir, the data of gas producing profile in each layer are counted and the average gas production of single well is calculated (Table 3). Before the water invasion of the gas reservoir, the main gas pay is Klbs21 with a gas production contribution rate of 34.3%, the secondary gas pay is E1-2km5 with a gas production contribution rate of 21.7% Both high permeability belts, fractures and faults can be water invasion channels in gas reservoirs. The combined action of these three factors leads to rapid invasion of formation water into gas wells, resulting in non-uniform water invasion of the Kela-2 gas reservoir. Based on the classification of gas wells, the water invasion models of the Kela-2 gas field are summarized in the following three types (Figure 6):
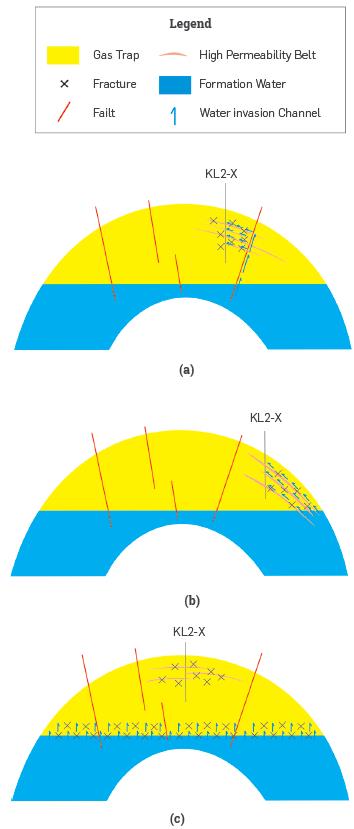
Figure 6 Water invasion patterns of the Kela-2 gas field (a) Edge water vertical channeling-lateral invasion mode (b) Edge water lateral invasion mode (c). Bottom water coning mode)
a. Edge water vertical channeling-lateral invasion mode: Gas wells are mainly distributed in the West of the Kela-2 gas reservoir, with faults and fractures developed around the wells, and the faults extend vertically below the gas-water interface and connect with the gas reservoir's edge water (bottom water). With the development, the well bottom pressure decreases, and the edge water (bottom water) flows to the pressure-decreased area, while faults, fractures and high permeability belts provide a channel for rapid water invasion of formation water. The edge water (bottom water) first invades vertically along the faults to the vicinity of the gas well, and then laterally invade the gas well under the combined action of high permeability belts and fractures, resulting in the water production of the gas well and the decrease of gas productivity.
b. Edge water Lateral invasion mode: Gas wells are mainly distributed in the East and North of the Kela-2 gas reservoir. Compared with the gas wells of vertical channeling-lateral invasion mode, this type of gas wells is closer to the edge of the gas reservoir, and the perforation avoidance height is lower (less than 200m). Fractures and high-permeability belts around the well are well developed and they work together to form a favorable channel for water nvasion. Among them, the high-permeability belts are developed on a larger scale, connecting the wellbore and the bottom water As the development progresses, the pressure inside the gas well drops, and the water flows along the high permeability belts and fractures to the pressure-decreased area, resulting in the decrease of water production and gas productivity.
c. Bottom water coning mode: The gas wells are mainly distributed in the middle of the Kela-2 gas reservoir, with higher structural positions and high perforation avoidance height. The faults, fractures, and high-permeability belts around the well are relatively small or underdeveloped, and there is no favorable channel for water invasion. With the decrease of gas reservoir pressure and the overall uplift of bottom water, there is no water breakthrough in any gas wells of this type.
CONCLUSIONS
For a gas reservoir with serious inhomogeneous water invasion complex gas and water production change, complex pressure change, and irregular productivity analysis, production logging can be used to analyze the productivity by subdividing the gas pay intervals to determine the gas well classification standard, to finally study the influencing factors of gas well productivity.
By analyzing productivity influencing factors for each subdivided gas pay interval, gas wells are divided into four types and three water nvasion patterns in Kela 2 Gas Field.
Pressure change, water breakthrough and different reservoir properties are the three main influencing factors that cause the gas pay interval change. Pressure drops in the gas well could cause the water to quickly invade the reservoir along faults, high permeability zones and fractures, leading to non-homogeneous water invasion Water flooding of gas pay intervals could result in a rapid gas production decrease or even no gas production.
The combination of high-permeability belts, fractures, and faults can provide a favorable channel for water invasion. Gas wells of vertical channeling-lateral water invasion and edge water lateral nvasion types occur with relatively earlier water breakthroughs, and production declines quickly after water breakthroughs. Gas wells of the bottom water coning type have relatively longer stable production.

