English (pdf)
 Article in xml format
 Article references
 Send this article by e-mail
 Cited by SciELO
  Cited by Google
  Similars in
SciELO
Similars in
SciELO  Similars in Google
 Permalink
1. INTRODUCTION
Renewable energies are characterised as clean and inexhaustible sources of energy. Unlike fossil fuels, these energies do not produce polluting emissions during their operation, thus reducing the negative impact on the environment [1]. The United Nations Framework Convention on Climate Change (UNFCCC) determined that climate change is attributed to all human activities that alter the atmosphere's composition, affecting meteorological variables such as temperature, rainfall, cloud cover, air currents, etc. [2]. The activities derived from energy produced by fossil fuels are recognised as one of the main global warming causes that endanger the population [3]. The increase in temperature all over the world has ranged between 4°C to 6°C in the past years [4]. The climate change in Colombia in 2011-2100 could suggest that the average temperature might increase 3.4°C in 2070 , and 3.9°C in 2100. The study also determined that rainfall might decrease up to 36 % as compared to the 1971-2000 reference period, which would be evidenced in the most affected regions between 2011 and 2040 [5].
The aformentioned climate changes may decrease the surface runoff levels in the north and Andean regions of Colombia, which may cause water distribution problems and a deficit in dams, resulting in reduced hydroelectric power generation [6]. Thus, the Colombian energy mix is susceptible to climate changes [7], affecting energy sustainability [8]. Moreover, up to 2014, the energy generation in Colombia has been supported by approximately 67 % hydroelectric generation [9]. Renewable energies are proposed as an option to reduce pollution and keep global temperature below 2°C [10]. Therefore, it must include the diversification of the energy mix with hydroelectric generation. Furthermore, due to its vulnerability to climate change, it should be supported by other generation sources such as wind energy.
In 2017, wind energy stood out as the most diffused energy source worldwide, with an installed capacity of 539 GW [11]. In Colombia, the wind resource is available in some localised regions such as the Caribbean, Santander, and other specific areas of Risaralda, Tolima, Valle del Cauca, Huila, Boyacá, and La Guajira. The latter is considered one of the best wind resource areas in South America, with a latent installed capacity of 18 GW [9]. The region of Puerto Bolivar is a particular case in Colombia, as a coastal area in La Guajira in the north of the country. This region is considered one of the places with the best wind resource in the country and the world [9], having potential for implementing wind energy projects. In this sense, if the wind energy resource of the country is exploited for electricity generation, the country's energy sustainability goals could be achieved [12].
Specifically, the Small Wind Turbines (SWTs) potential market could be cost-efficient indicators in their operation [13]. In 2015, 990000 SWTs were installed worldwide, that is, a growth of 5 % compared to 2014; this means an installed capacity of 984 GW, 14 % higher than in the previous year [14]. One of the main applications of SWTs refers to non-interconnected systems, also called off-grid applications, which includes electricity generation for rural areas [14]. In Colombia, until 2017, 52% of the territory was characterised as a non-interconnected zone, with associated high power-generating costs, high levels of electrical service loss, and unsatisfied basic needs [15]. Despite the wind energy generation potential in La Guajira, the electrical coverage supply up to 2016 was less than 77 % of the population [16]. Historically, non-interconnected areas have satisfied their energy needs through diesel generators, with supply energy costs of approximately 0.28 USD/kWh [17]. A slightly higher value than the costs achieved with small wind turbine systems of 0.23 USD/ kWh [18], which suggests that for non-interconnected areas, SWT projects are competitive energy systems among conventional power generation using fossil fuels. Therefore, the SWT implementation can improve the energy equity of the country, allowing these non-interconnected areas to relieve energy demand [12].
SWT STATE OF THE ART
The rise in energy accessibility in a territory stems from improving energy sustainability standards [12], permitting progress on indices reported by the World Energy Council (WEC), such as energy equity and security [8],[19]. In this sense, SWTs are considered one of the leading energy options for Colombia. In this regard, Valencia-Ochoa et al. [20] analysed the wind resource potential of Puerto Bolivar, La Guajira, Colombia. For the purposes of this study, the wind speed and direction obtained in a period of 20 years (1993-2013) were considered. The authors studied four histogram frequency models: Gaussian, Gamma, Weibull, and Rayleigh distribution. Once the Statistical Software WindAnalysisUA v1.0 was designed, the clustered data were treated using this tool to prepare a wind rose, and the probability distributions of wind speeds. Colombia needs to diversify its energy mix, considering environmental pollution levels, and supplying energy to non-interconnected areas that represent approximately half of the territory. However, despite the growth reported in equipment and installed capacity, SWTs have shown low applicability in recent years. Moreover, renewable energy projects have barriers such as low rates of return, and higher investment risk compared to fossil fuel generation projects [21]. In particular, high operating and maintenance costs vis-á-vis other renewable generation alternatives such as photovoltaic panels have become barriers for development and extensive application of SWTs technologies [22]-[23].
Further, some authors have conducted multi-criteria studies to determine the techno-economic viability of SWTs [24]. For example, a study evaluated the economic feasibility of integrating SWTs for domestic energy consumption in Egypt. The study included eight wind turbine models in 17 locations, calculating each zone's annual energy production AEP. An economic analysis [25] showed that the cash flows and the net present value nPv were extracted as a profitability indicator. The authors concluded that the electricity sale price is not enough to confirm the project's profitability.
Furthermore, Bukala et al. [26] conducted a study in Poland regarding SWTs economic and design considerations. The authors found that 75 % of the SWT manufactured are Horizontal Axis Wind Turbines (HAWT) with three blades. Furthermore, within the economic concerns, it was defined that the most critical profitability factors are selecting the mounting location and its wind resource. Finally, the authors state that generating energy with SWTs can be a technically viable option, but often the acquisition costs in the market are high, which is an economic barrier.
In the United Kingdom, the Cost-Benefit and (Annual Energy Production) AEP of four generic wind turbines and three SWTs is analysed for its operation in urban areas, including the power-wind speed curves of the models. Additionally, a Weibull distribution was used to include wind resource availability. Finally, the economic analysis included capital costs, feed rate, funding, and operation and maintenance costs. As a result, it could be determined that projects involving SWTs should consider extended investment return periods [27]. Elnaggar et al. [28] developed in Gaza City a study regarding the area's wind potential, and the techno-economic viability associated with an SWT model WTT5000s. The criteria for model selection were nominal power, acquisition cost, minimum operating speed, efficiency, weight, and size. The wind turbine was located in different urban areas, where the electricity generation was analysed, varying the installation height and the impact on the costs and viability of the project. Rodriguez-Hernandez et al. [29] evaluated 28 SWTs in 18 different locations in Mexico, where the NPV and the technical considerations for generation projects in urban areas were determined. The NPV results were negative for the 28 models involved, considering that lower nominal power did not have high loss margins.
PAPER SCOPE
The scope of this study is to analyze the technical and economic aspects of small wind turbines; however, there are currently works that evaluate the adaptation of renewable energy systems to the social and cultural environments, as in the case of Edsand-Hans-Erik [30]. The author determined functions and landscape factors that influence the impolementation of wind energy in Colombia. The study evaluated, with Colombian wind energy experts , the degree of influence of the following functions and environmental factors on wind energy: financial activities, knowledge development, adaptation capacity, dissemination of knowledge, research orientation, market formation, national and international mobilization resources, creation of formal and informal legitimacy, economic growth, environmental warnings, climate change, armed conflict, corruption, and education inequity.
In particular, the region of La Guajira was also mentioned by [30], stating that despite its wind potential, it lacks outstanding electrical interconnection systems. In addition, La Guajira has presence of indigenous communities, where if knowledge about the benefits of wind energy is not shared, the new technology is negatively influenced by the informal pressure factor. Furthermore, there is presence of illegal armed groups, which increases the risk for executing the project and, therefore, the risk of project investment.
From all the above studies, it is inferred that the implementation of SWTs is an opportunity to generate electricity through non-polluting renewable sources. This paper proposes a techno-economic analysis of SWTs and their operation in Colombia, specifically in Puerto Bolivar, given its great wind resources and potential to increase energy coverage. A group of small wind turbines with rated power up to 10 kW and their operation performance under a specific wind resource were analysed by estimating the wind speed profiles, using the Weibull distribution and the AEP. Moreover, an economic model was implemented, given its net present value NPV, which addresses the cash flow strategy. The income and expenses, namely investment, operation, maintenance costs, saving values, and strategy payments of the system were considered. Finally, the above economic strategy is treated by a sensitivity analysis financed with the funding of the project's initial cost, showing the effect on the internal rate of return, IRR.
The structure of this work, shows in Section 2 the technical and economic formulation considered in the study. Then, in section 3, the methodology is used to find the variables involved in the technical and financial evaluation. Next, Sections 4 and 5 discuss the results from economically viable models, and Section 6 concludes the study.
2. THEORETICAL FRAMEWORK
To conduct this work, two structure phases are proposed. The first one is the technical phase, where the mathematical model of electricity produced by a wind turbine is considered. The second one is the economic phase that supports the concepts necessary for interpreting the technology. Finally, the framework of this interpretation is related to the measurement of the return on investment of the technology, based on the project's profitability level.
TECHNICAL FORMULATION
The technical formulation seeks to characterize each small wind turbine, comparing wind turbines and giving the technical parameters for an economic analysis. Among the considerations in the first phase, the rated power coefficient Cp ,rated must be calculated as [31]:
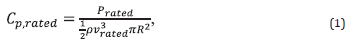
where P rated is the rated power at the rated wind speed v rated , p is the air density, and R is the wind turbine's rotor radius. Another variable to be calculated is the tip speed ratio TSRrated, which is defined as the ratio between the tangential speed at the tip of the blade V t and the rated wind speed; therefore, the rated value is given by [13], [31]:
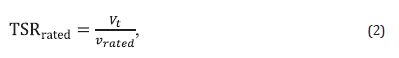
being Vt=ΩR, where Ω is the nominal rotational speed. The wind resource of a particular site is approached by the Weibull distribution W(u ∞ ), given by [32]:
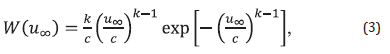
where u ∞ is the wind speed.
For this Pr∞bability Distribution Functions (PDF), it is necessary to know the scaling factor c, expressed in m-s-1 and related to the mean wind speed u mean by [26],[33]:
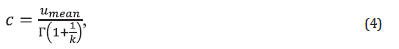
being Γ the statistical gamma function.
In Equations (3) and (4), k refers to the shape parameter given as [34]:
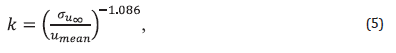
where σu∞ refers to the standard deviation of the wind speed measurements. Some typical values of k depending on terrain type are shown in Table 1.
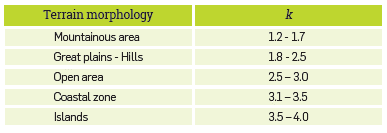
The statistical approach allows to calculate the Annual Energy Productivity AEP as [32]:
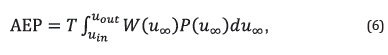
where T is the evaluation period, u in is the cut-in wind speed, i.e. the wind speed where the wind turbine begins with the electricity generation; u out is the cut-out wind speed, or the speed where the wind turbine cut off the electricity generation. P(u ∞ ) is the wind power produced by the wind turbine at the wind speed u ∞ obtained from the power curve and W(u ∞ ) is the Weibull distribution from equation (3).
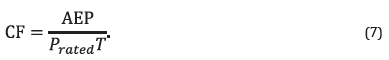
Subsequently, the capacity factor CF is defined as follows [24],[28]:
ECONOMIC FORMULATION
The technical evaluation involves the costs for the cash flow regarding the expenses and incomes during the useful project life. The typical cash flow for financial analysis is given by Rodriguez-Hernandez et al. [29], including funds payment, as shown in Figure 1
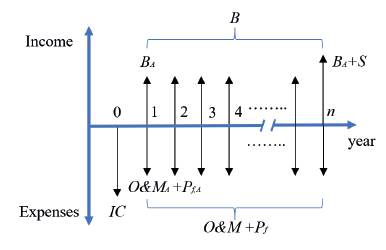
Initially, the economic study considers the initial cost IC, which includes the SWT’s installation price, the electrical infrastructure, conditioning and civil works, i.e. all necessary equipment and service cost or capital expenditures (CAPEX) to start the wind turbine operation. This variable is determined considering the relation between the initial investment cost coefficient and the installed capacity of the SWT in (USD/kW) [28]. This work considers that the initial cost IC is defined by the total initial cost and the funding quantity, as follows:
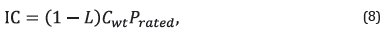
where C wt is the installed kW-h cost, and L is the funding percentage, employed later in the funding payment mathematical approach. In addition, it can be assumed that the product between C wt and the rated capacity P rated represents the total initial cost. Further, the operational and maintenance costs O&MA or operating expenditures (OPEX) are an annual investment, which is based on the total initial cost, given as:
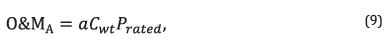
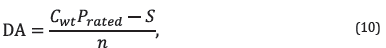
being α a proportionality constant based on market research works [24],[28]; the variable a is used to derive the operational cost, considering the total initial cost. The total capital cost value also provides the information to calculate the salvage value S, which is estimated according to the annual depreciation of a wind turbine DA, given as:
where n is the total project lifetime in years. The following parameter nto the cash flow is the annual benefit B A . According to energy policies, it represents the saving costs in the electricity bill; it can include the income value if it allows for selling energy into the nterconnecting grid. Therefore, the benefits consider the annual energy production AEP as follows [28]:
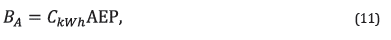
where C kWh is the price of the kW-h in the region of study and represents the saving value on the electric bill; this price also can involve the selling income value. According to the funding of the initial investment, it is necessary to recognize the annual payment of the financial entity as a sensitivity analysis of the SWTs is required. Thus, , the fixed yearly funding payment is introduced [28],[36] as:
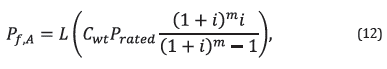
where m refers to the funding period, and i is the discount rate.
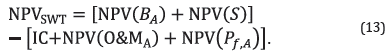
The net present value of an SWT renewable energy project, NPVSWT Is the economic parameter that indicates the profitability level and the final viability of the project. Therefore, the NPVSWT includes the funding payment, and is given by [24],[28],[31]:
For annualized costs, as is the case of annual benefits or operation and maintenance costs, the net present value takes the form given as [24], [36]:
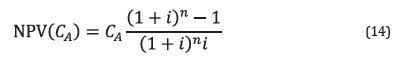
Where C A takes the value of B A or O&MA , if the aim is to calculate NPV(B A ) or NPV(O&MA ), respectively. The net present value for the annual funding payment NPV(PfA ) can also be calculated by equation (14), where C A takes the value of P fA and n takes the value of m.
However, if the calculation of NPV involves only a single payment in the future, as in the case of the salvage value S, the net present value changes to [28],[36]:
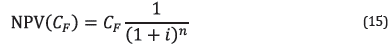
where C F takes the value of S. Finally, based on Equation (13) to evaluate the NPVSWT , it is possible to obtain the internal rate of return, IRR, as the value of the expected discount rate that makes the NPVSWT equal to 0 [37].
3. METHODOLOGY
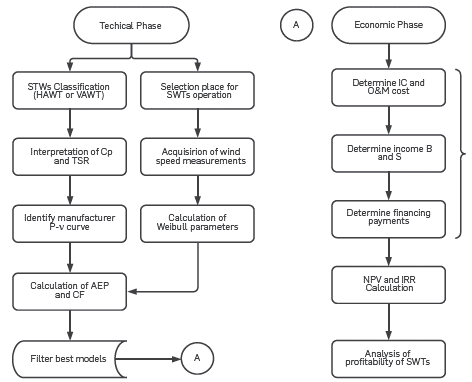
The methodology flow chart is shown in Figure 2. This work starts from two technical formulation processes. First, the SWTs classification and selection of a potential installation site, intending to calculate AEP and CF values to discriminate the best models. Then, the method continues with the economic phase, determining the expenses and income values used for cash flow design and the NPV calculation, analyzing the profitability of SWTs projects under the specific conditions of the selected region.
TECHNICAL PHASE
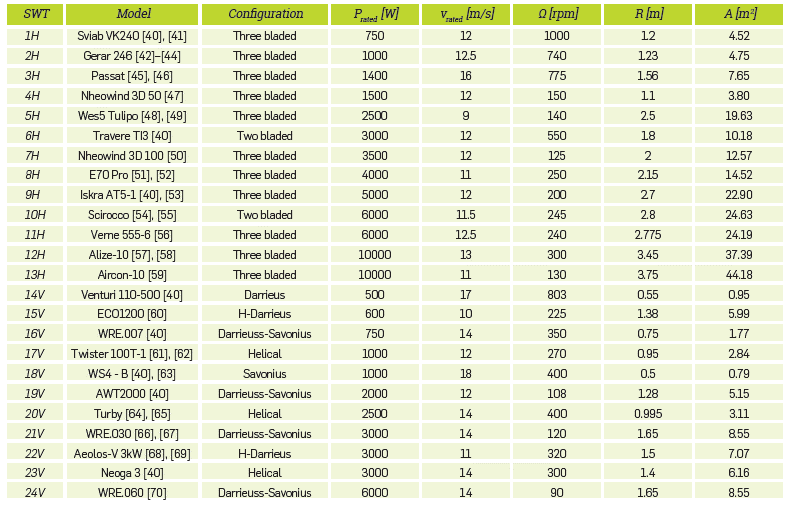
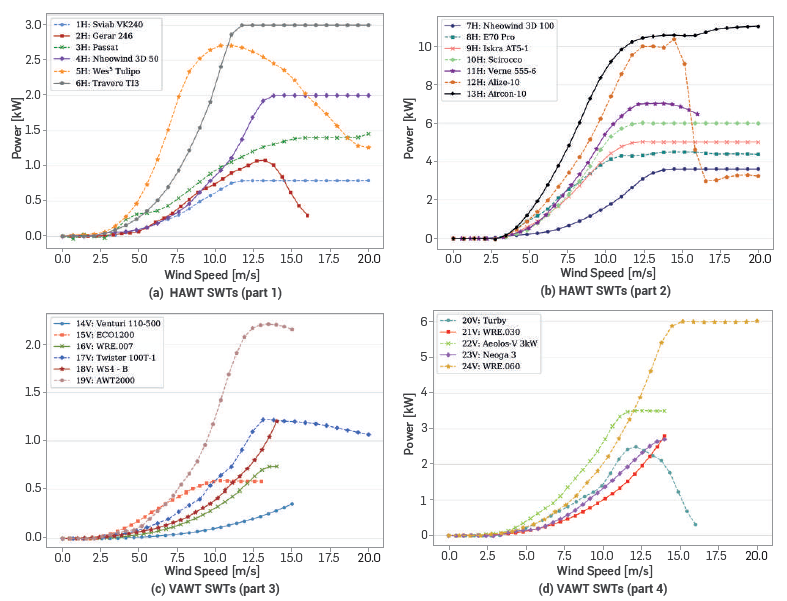
The first stage of the technical phase corresponds to the classification and selection of 24 SWTs with nominal power up to 10 kW. Furthermore, the configuration of the rotor shaft is included in this classification process. The first group corresponds to Horizontal Axis Wind Turbines HAWT and the second group by Vertical Axis Wind Turbines VAWT. Table 2 shows each SWT model considered. Additionally, Figure 3 presents the manufacturer power-wind speed curve for each small wind turbine.
Table 2 Small wind turbines considered, P rated is defined as the rated power capacity of the SWT, v rated is the rated wind speed, Ω is the nominal rotation speed, R is the rotor's radius, and A the swept area. In the SWT column, letters H or V next to the the number means that the wind turbine has HAWT or VAWT configuration, respectively
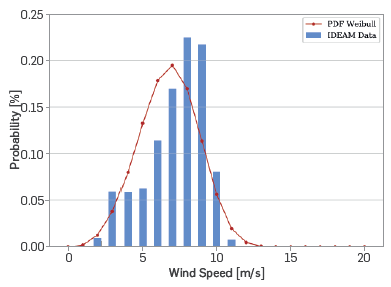
The next step refers to the selection of the installation site of interest. In this sense, meteorological records provided by the "Instituto de Hidrología, Meteorología y Estudios Ambientales - IDEAM" [38] were considered for the techno-economic formulation under specific Colombian conditions. The selected location was Puerto Bolivar, a maritime port in the municipality of Uribia in the Guajira department of Colombia, with latitude 12.22430556°, longitude -71.98288889°, and altitude 10. The average hourly wind speed between October 2019 and June 2020 were treated to obtain the histogram graph, along with the values for the scale c and the shape factor k given in equations 4 and 5, respectively. Figure 4 presents the Weibull distribution of the wind profile in Puerto Bolivar.
The frequency histogram was obtained from data acquired by the meteorological station, while the Weibull distribution was obtained considering Equation (3) to Equation(5). In this sense, there was evidence of variation between the frequency histogram and the calculated Weibull distribution (the percentage of variation between the curves in Figure 4 is 40.2%), but the frequency histogram was more shifted to the right, meaning a probability of occurrence of 61% for wind speeds ranging between 7 m/s and 9 m/s, greater than that represented by the Weibull distribution, which for the same speed values is approximately 48%.
Therefore, the analysis based on the Weibull distribution was more conservative and in real operation greater generation of electrical energy could be obtained by small wind turbines. Hence, the values of annual electricity generation AEP were conservative, meaning also conservative values for energy savings or annual benefits B A , i.e., the annual benefits may be greater than those established hereunder; this means that in real operation, the technical and economic factors could translate into greater energy generation and better profitability, respectively.
If the data acquired by the meteorological station is used to obtain analysis variables such as AEP, it is necessary to expand the data acquisition range to then consider the variability of the resource over time. However, by having a Weibull distribution derived from the weather station data, we obtain a conservative analysis of the annual power generation as explained above. The Weibull statistical analysis of the wind approach is integrated with the manufacturer power curves of SWTs, as observed in Figure 3, to calculate the AEP with Equation (6), considering one year or T equal to 8760 h. Finally, as shown in Equation (7), the Capacity Factor CF is used to select the most profitable SWTs. The CF value below 25 % is defined as low, representing economic losses for the project [39].
ECONOMIC PHASE
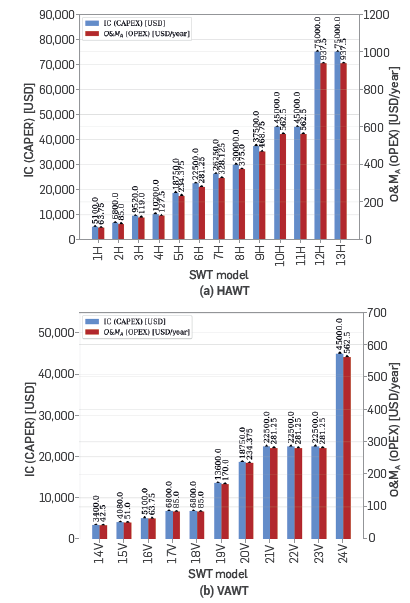
The techno-economic study is supported by the profitability indicator of an SWT project. The initial costs for each installed kW, C wt , and the proportionality constant for operation a, and operating and maintenance costs O&M are determined under market studies, which considered the SWT installed capacity P rated . Therefore, this work considered the C wt reported by Rodriguez-Hernandez et al. [29] for SWTs of less than 2.5 kW, approximately 6800 USD/kW-h in 2015. On the other hand, for SWTs between 2.5 kW and 10 kW, the installing cost was around 7500 USD/kW-h. Moreover, the average value between the studies of Abdelhady et al. [25] and Rodriguez-Hernandez et al. [29], given a value of 1.25 %, is used to estimate parameter α.Figure 5a and 5b show the IC and O&M estimated values for small wind turbines.
The project lifetime n is fixed in 20 years for all SWTs models. Moreover, since the manufacturers of SWTs usually offer a five-year warranty period and 20-year lifetime operation, the salvage value S at the final of the project for this analysis is null. Regarding the annual benefits B A , this study only examines the salvage value based on the hypothesis of those systems that cannot be connected to the grid nor commercialize energy for its being in a non-interconnected geographical location. In addition, in 2019, the energy price at Electricaribe [70] for domestic use in the department of La Guajira was 0.11 USD/kW-h.
A sensitivity analysis is performed on the annual funding payment P fA , affecting the initial cost IC . For the economic study, five different scenarios are proposed. The first one implies the absence of any funding source, i.e. a value of 0 for L. The next three scenarios consider funding under 25 %, 50% and 75% for the project's initial investment, i.e. with L equal to 0.25, 0.5 and 0.75, respectively. The last scenario presumes funding of 100 % for the project's initial investment, i.e. with L equal 1. In addition, this analysis considered a discount rate i of 12 % for a loan involving environmental licenses, as defined by the National Planning Department (Departamento Nacional de Planeación DNP) in Colombia [71]. The sensitive analysis considered that the credit received for the project execution is expected to be paid in five annualized installments, i.e. m=5. Further, the NPV values given in Equations (14) and (15) are calculated. The previous calculation is supported by the cash flow made up of expenses and revenues shown in Figure 1. Lastly, the economic phase along the sensitive funding analysis provides the best SWT model f with the best profitability margin in terms of internal rate of return IRR.
4. RESULTS
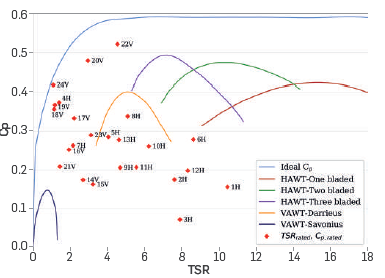
Results are defined within the framework of the considerations mentioned in Section 2.1 and Section 2.2. The values of C p,rated and TSRrated obtained for all considered SWT, are located into the C p -TSR theoretical curve [31], [35], which is shown in Figure 6. This Figure compares the C p,rated and TSRrated values for the SWTs considered under the theoretical models according to the SWT classification.
As shown in Figure 6, the Neowind 3D-50 (4H) had a C p,rated value of 0.37, which is the highest result for the HAWT group. However, the TSRrated value of 1.44 is far from the theoretical curve of the Three-bladed SWT. On the other hand, the E70 Pro (8H) had a C p,rated value of 0.34 and a TSRrated of 5.12, showing the best fit to the theoretical curve concerning the three-blade HAWT model. From another perspective, Turby (20V) and Aeolos-V 3kW (22V) turbines are the VAWT models with the highest C p,rated values, reaching 0.48 and 0.52, respectively. However, the mentioned models have TSRrated values equal to 2.98 and 4.57, respectively, which took them away from the theoretical curve. Otherwise, the Neoga 3 (23V) model has the best approach to the theoretical VAWT curve, with a C of 0.29 and a TSRrated of 1.48.
As the theoretical values of C p - TSR were compared only with the nominal values of the SWT, Figure 6 describes the technical analysis, but the filter that determines the SWT models that continue with the economic analysis is based on the values of AEP and CF, as shown by the methodology in Figure 2.
Results of AEP and CF are plotted in Figure 7a, and Figure 7b for the HAWT and VAWT assessed to conduct a more detailed technical analysis. Regarding the AEP values for the horizontal-axis designs, the E70 Pro (8H), Verne 555-6 (11H), Alize-10 (12H), and Aircon-10 (13H) stand out; the last two, in particular, reached an annual energy production of 25184.69 kWh and 34539.3 kW-h, respectively.
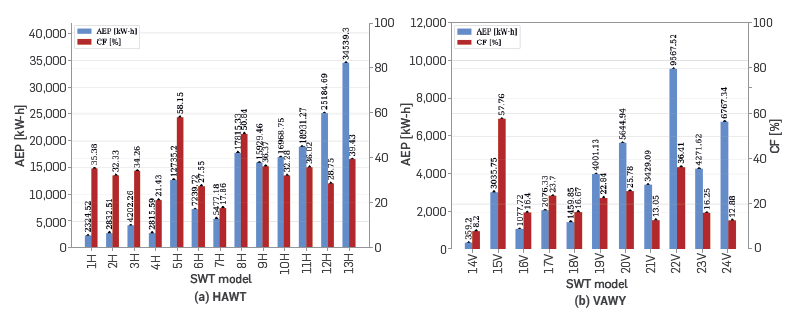
The SWT selection was based on the capacity factor given by 14 machines that exceeded a CF value of 25 %. The HAWT models considered include the Sviab Vk240 (1H), Gerar 246 (2H), Passat (3H), Wes5 Tulipo (5H), Travere TI3 (6H), E70 Pro (8H), Iskra AT5-1 (9H), Scirocco (10H), Verne 555-6 (11H), Alize-10 (12H) and the Aircon-10 (13H); for a total of 11 horizontal-axis wind turbines.
Further, the VAWT models are the ECO1200 (15V), Turby (20V) and the Aeolos-V 3kW (22V), for a total of three vertical-axis wind turbines. Consequently, two turbines with the same nominal power, with different rotor configurations prevail. The Wes5 Tulipo (5H) reached an AEP value of 12735.2 kW-h, while the Turby (20V) model only obtained an AEP value of 5644.94 kW-h. Further, the one with a horizontal-axis configuration got the highest annual energy production. However, suppose the analysis considers other models with the same rated power like the Travere TI3 (6H), WRE.030 (21V), Aeolos-V 3kW (22V), and Neoga 3 (23V). In this case, the vertical-axis model 22V exceeds the models 21V and 22V, even the 6H model, obtaining an "AEP" value of 9567.52 kW-h.
For the six models mentioned above, the highest capacity factor CF corresponds to the turbine with the highest annual energy production AEP , which corroborates the proportion between AEP and the product of operating hours and rated power, as shown in Figure 7. The profitability index is considered one of the most critical factors for the development of projects involving SWTs. Among the considerations to measure this factor, this work took the NPV for the 14 SWTs obtained as a baseline. Figure 8 shows the NPVSWT evolution for the SWTs considered during the economic analysis.
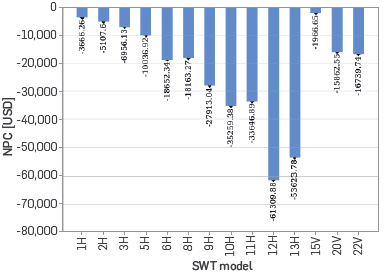
The behaviour highlighted in Figure 8 shows that when the installed capacity is low, the NPVSWT associated value is also low. In this context, the turbines with "NPV" s close to 0 were those with the most insufficient nominal capacity, as in the case of the Sviab VK240 (1H) and the ECO1200 (15V), taking NPVSWT of -3666.26 USD and -1966.65 USD, respectively. On the contrary, the models with higher NPVSWT are for the Alize-10 (12H) and Aircon-10 (13H), obtaining values of -61309.88 USD and -53623.78 USD, both having a HAWT horizontal-axis configuration and the highest rated power.
The IRR value is calculated for the 14 models analysed, considering the funding sensitivity analysis. Figure 9 shows the results obtained for the internal rate of return. The five funding scenarios are calculated for all SWTs models; the case of L equal 100% had the highest loss tendency. Further, on a second plane, there are three scenarios of founding 75 %, 50 % and 25 %, i.e. L equal to 0.75, 0.5 and 0.25, respectively. Finally, the case without any funding payment showed the best profitability results; even a positive IRR value is reached for three wind turbine models.
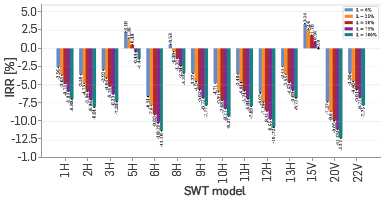
In sum, models with better margins of profitability as per the IRR criterion were Wes5 Tulipo (5H), E70 Pro (8H) and ECO1200 (15V) with IRR values of 2.18 %, 0.53 %, and 3.34 %, respectively, without any funding. It should be noted that the turbine with the lowest nominal power (15V) is characterized by having the highest value of the internal rate of return.
DISCUSSION
In general, the theoretical curves in Figure 6 showed that the SWTs models reviewed herein are far from an ideal behaviour. Further, the calculation of C p,rated and TSRrated are based on the specifications proposed by the manufacturers. In addition, these parameters rely on the turbine's characterisation, which can be conducted directly at the site of operation, or in tests with controlled parameters such as in a wind tunnel [72]. However, it should be noted that models 5H, 8H and 15V result in the best profitability index based on IRR with a TSRrated value close to the theoretical curve, differing only in the value of C p . In addition, the C p,rated at nominal operating speed is generally less than the maximum C p of the wind turbine, as is the case with the E70 Pro (8H) [52].
Furthermore, the annual energy production AEP is primarily influenced by the installed capacity of the small wind turbine. However, this parameter is also sensitive to the wind resource, and its interaction with the power-wind speed curve behaviour. This is evident in the 8H and 9H models, where the former achieves a higher AEP value, despite having a lower nominal power value than the 9H; nevertheless, it has better generation between 3 m/s and 9 m/s, as observed in Figure 3b. The above justification is supported by the fact that the wind resource of Puerto Bolivar has a probability of occurrence within the aforementioned range of 90 %, as shown in Figure 4. In the case of vertical-axis wind turbines, a clear example is evidenced between the models 15V and 17V, as seen in Figure 3c, where the latter has higher nominal power, but lower performance, according to the proposed wind speed profile. In addition, the installed capacity, which depends on the wind resource from the region of interest, will influence the NPV value, as shown in Figure 8.
Moreover, wind resource affects annual energy production and saving values. Consequently, the NPV factor may not be the best comparison parameter to determine the profitability among turbines with different rated power capacities. Additionally, if the study includes a sensitivity analysis based on funding payments, the net present value does not change due to its mathematical formulation. In such context, considering a sensitivity analysis of funding payments allows obtaining the internal rate of return.
It can be noticed the filtered models that with significant funding participation, an SWT project may lose profitability as it received a lower IRR value. The 5H and 15V turbines have a positive IRR value in the case of no funding and when there is a funding of 25% and 50% of the initial cost. The SWT ECO1200 (15V) also has a positive value of IRR when the funding is equal to 75% (IRR = 0.91). In contrast, as to funding for all the initial capital (L = 100 %), the mentioned models present negative IRR values. The 8H turbine model only gives a positive IRR value at 0 % funding. The three turbine models showing a positive profitability value coincide with the highest capacity factor in Figure 7. Hence, the filter based on the capacity factor to start the economic phase of the analysis is justified, which for this work took a value of 25 %. Of the above, the capacity factor is defined as the technical factor that has a significant influence on the profitability of a project based on SWTs. A project is considered profitable and attractive for the executor and the investor if the value of the internal rate of return IRR is higher than the discount rate i initially proposed in the cash flow design [37],[73]]. Therefore, even though the 5H, 8H, and 15V models obtained positive IRR values, they are not considered economically appealing for the executor or shareholders, as the IRR values were less than 12 %.
CONCLUSIONS
This paper proposes a methodology divided into technical and economic phases to evaluate 24 models of small wind turbines based on a techno-economic study for in Colombia, specifically for the Puerto Bolivar region. Technical characterization of the 24 wind turbines was conducted, determining relevant aspects of the operation, such as the power coefficient C p,rated , the tip speed ratio TSRrated , the rotor radius R, the rated power Pated , rated wind speed vrated , rated rotation speed Q and the characteristic power-wind speed curve. Also, the value of the annual energy production AEP and the capacity factor CF for each model were included, according to the study region. Twenty-Four models were screened, based on the capacity factor to continue the economic analysis with the wind SWTs which capacity factor was greater than 25 %. With the 14 resulting models, the net present value NPV and the internal rate of return IRR were calculated to determine the profitability index of each turbine, considering the funding payment formulation. The results conclude that the net present value is sensitive to the installed capacity. Thus, to compare the wind turbines, the study used the IRR value. Additionally, a sensitivity analysis was performed on the funding of the initial capital, concluding that the greater the funding, the less profitability for electricity generation by SWT. In the three funding scenarios, the best small wind turbines with higher IRR values had the best capacity factor CF values in the technical phase. Therefore, the capacity factor can be a preliminary value to determine the profitability of an SWT project.
The best model in the case of Puerto Bolivar, according to the wind resource characterized by the Weibull distribution, was the ECO1200 (15V) with the lowest install capacity of 600 W, obtaining an IRR value of 3.34 % without funding. However, due to its value of IRR lower than the expected 12 %, it is concluded that none of the SWTs is economically appealing for operation in Puerto Bolivar, despite being one of the regions with the best wind resource in Colombia and the world. In this vein, this work suggests the possibility of conducting future work to improve small wind turbines' technical or economic conditions. As regards technical aspects, it is necessary to seek new designs leveraging on moderate wind resources with average speeds between 7 m/s and 8 m/s as wind turbines are generally designed for nominal speeds between 11 and 12 m/s. Additionally, a techno-economic aspect is to seek cost-efficient materials or manufacturing processes to reduce the cost of each installed kW, which reduces operating expenses and considers maintainning or improving energy production. Finally, a net economic aspect is to provide regulatory and funding support for small-scale generation, specifically for small wind turbines, to reduce the discount rate for executing a renewable project.
Furthermore, this resutls can be useful in future works, where socio-cultural aspects are involved, whereby the economic indicators treated in this study could be updated with the influence of socio-cultural factors, highlighting the negative effects and the benefits relative to other conventional forms of energy.