


 English (pdf)
 Article in xml format
 Article references
 Send this article by e-mail
 Cited by SciELO
  Cited by Google
  Similars in
SciELO
Similars in
SciELO  Similars in Google
 Permalink
1. INTRODUCTION
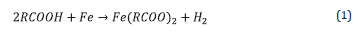
The significant reduction of conventional oil resources has led the oil and gas industry to increase considerably the percentage of non-conventional oil in blends entering the crude oil distillation units. [1] High acid-containing crudes are commonly found in the so-called non-conventional or opportunity crude oils. Due to their low quality, characterized typically by a significant content of contaminants including corrosive naphthenic acids and sulfur-bearing compounds, opportunity crude oils are considerably less expensive and more readily available in the oil market as compared to conventional crude. However, processing opportunity crude oils forces the refineries to establish special strategies for mitigating their corrosive effects on the distillation units.. Corrosion due to naphthenic acids and sulfur present in opportunity crude oils occurs in the temperature range of 220 to 400 °C, primarily in the transfer lines of distillation units. [2,3] The general reaction that describes naphthenic acid corrosion is shown in Equation 1. [3,4,5]
The total acid number (TAN) of a crude oil is associated mainly with its content of naphthenic acids, which are formed by biodegradation processes. [6] The TAN is defined as the milligrams of KOH required to neutralize one gram of crude oil. [7-9] It is typically used in refineries to define blends that enter the distillation units r to establish the appropriate corrosion control strategy. However, practical experience has demonstrated that crude oils having the same total concentration of naphthenic acids and sulfur compounds can have different corrosivity. [10-11] In addition, experimental results have demonstrated that the corrosivity of crude oil relates not only to the total concentration of naphthenic acids, but also to the chemical nature of these compounds. [2,3,10-12,] Therefore, the heterogeneity of these species does not allow to establish a prediction strategy purely based on TAN to meet industry requirements. The aim of this research work was to study the variation in the reactivity of single fractions of naphthenic acids for better understanding the corrosivity of a mixture of them on carbon steel AISI SAE 1005, based on the proportion of these fractions in one commercial blend.
MATERIALS
Rectangular carbon steel AISI SAE 1005 coupons which dimensions are 30.65 mm , by 17.85 mm width, and 2.93 mm in thickness were used for exposure tests according to ASTM G-31. [13] The chemical composition of the carbon steel studies, which is commonly used in refinery equipment, was established by optical emission spectroscopy (OES). The investigated material contains 0.055 wt.% C, 0.172 wt.% Mn, 0.0087 wt.% P, 0.047 wt.% Al, and 0.025 wt% Cr. In addition, a commercial naphthenic acid blend of crude oil was used.
FRACTIONING OF NAPHTHENIC ACIDS
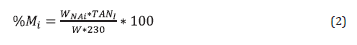
A sample of 15 g from the blend was dissolved in 200 ml of dichloromethane (DCM) and washed three times with 100 ml of a 1M NaOH solution prepared with a 1:1 EtOH/H2O mixture as solvent. The insoluble fraction in the aqueous solution (Fraction 1) was separated by decanting and subsequent evaporation of the DCM. The alkali aqueous phase was gradually acidified by the addition of a concentrated HCl solution, obtaining two additional fractions: Fraction 2 corresponds to the insoluble naphthenic acids at pH 7, and Fraction 3 corresponds to the fraction of insoluble naphthenic acids at pH 1. Fraction 4 corresponds to the total extractable fraction (Fractions 2 and 3). This procedure was performed often to obtain a sufficient amount of each fraction of naphthenic acids for the required tests. The mole percent of each fraction in the commercial blend was determined using Equation 2, where, % M ¡ is the mole percent of each fraction extracted, W NAj (g) is the weight of each fraction., TAN I (mgKOH/g) is the total acid number of each fraction and W(g) is the initial weight of the commercial blend, 230 is the TAN of the commercial mixture of naphthenic acids. The TAN was determined according to ASTM D664.[14]
CHARACTERIZATION OF NAPHTHENIC ACIDS FRACTIONS
The fractions were characterized by elemental analysis, Fourier-transform infrared spectroscopy (FTIR), Gel Permeation Chromatography (GPC), Nuclear Magnetic Resonance (NMR), and Mass Spectroscopy (MS).
ACQUISITION OF FTIR-SPECTRA
FTIR experiments were performed using a SHIMADZU 8400S FTIR instrument. All spectra were obtained in the absorbance mode with a scan range of 4000-450 cm-1 and a resolution of 4 cm-1 for 10 scans. The samples were prepared by dissolving 6-8 mg of the fraction in 4 mL of DCM. A drop of the sample was placed on the sample holder and the DCM was allowed to evaporate.
ELEMENTAL CHARACTERIZATION
Analytical determination of C, H, N, S was performed by a Thermo ScientificTM analyzer.
1H NMR AND 13C NMR MEASUREMENTS
The 1H NMR and 13C NMR spectra of the fraction were obtained using a Bruker Avance III 400 MHz spectrometer in 5 wt.% solutions of CDCl3 containing tetramethylsilane (TMS) as internal reference. Pulses of 30° (Bruker zg30 pulse sequence) with pre-scan delay of 10.0 us were used, and the delay time between the scans was 10 s. The sweep width was 6000 Hz, and the acquisition time was 5.45 s. In total, 32 scans were averaged for each spectrum and used for the statistical analysis. The phase and baseline of the resulting spectra were manually adjusted and corrected after using a very large expansion of the y-axis. The integration was performed within each of these spectral segments, minimizing the small shifts observed from sample to sample. This was achieved by carefully setting the TMS signal to 0 ppm and normalizing the resulting integrals of the different segments of the spectrum.
GEL PERMEATION CHROMATOGRAPHY (GPC)
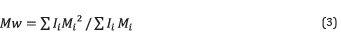
The molecular distribution was determined by GPC using a Waters 2414 refractive index detector at a column temperature of 40°C: using mobile phase and Tetrahydrofuran (THF). The average molecular weight (MW) was calculated using Equation 3, where M j: and l i correspond to the molecular weight and intensity of each acid in the blend, respectively.
MASS SPECTROMETRY
MS and MS/MS experiments were performed using a Thermo Finnigan Mass Spectrometer controlled by Tuneplus software (Excalibur), with the Electrospray Ionization (ESI) source in negative ion mode. The concentration of the sample consisted in 1-2 mg of the fraction dissolved in 2 ml of solvent; which was toluene. The sample flow rate was 4-6 μL/min and the mass scan range was between 180-2000 m/z. The mass spectra were based on 3 micro-scans with a 50 ms ion injection time, and automatic gain control was enabled The sheath gas was maintained at 60 psi, the temperature of the API stack at 220 °C, the capillary voltage was set at 7 V, and the spray voltage at 3.15 kV. Again, Equation 3 was used to calculate the average molecular weight.
CORROSION KINETIC STUDY
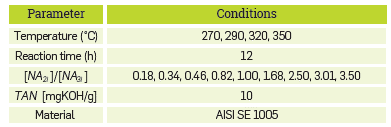
The experimental conditions for the corrosion tests are included in Table 1. The kinetic study was performed in a reactor manufactured using Hastelloy® C-276 (UNS N10276), with capacity for 50 Ml.

Each fraction of naphthenic acids was dissolved in white mineral oil. Before testing, all the surfaces of the coupon were prepared by mechanically grinding up to 1500 grit using SiC-paper. The dimension of the coupon was measured with a caliper and the coupon was then cleaned with deionized water, degreased in acetone, and dried in air. Finally, the coupon was weighted using an analytical scale (0.0001 g). All experimental conditions were tested in duplicate. After each test, the coupon was cleaned ultrasonically in acetone and weighted using the same analytical scale.
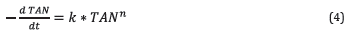
From the weight loss of the coupon, the number of moles of naphthenic acids consumed in the reaction was calculated. This has been called reactivity, and it is expressed in mg of iron (Fe) per kmol of naphthenic acids (TAN). Assuming a molar excess of iron in the reaction, the kinetic of reducing the acidity of crude due to the corrosion reaction can be represented by Equation 4, where TAN represents the total acid number in the white mineral oil, t represents the reaction time, k represents the reaction rate constant, and n represents the reaction order, which can be determined by experimental data.
Equation 4 considers that the change of acidity in the solution only relates to the reaction of naphthenic acids with the carbon steel. Assuming a first-order reaction:
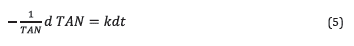
Equation 6 results from solving the integral of equation 5, where TAN i corresponds to the initial TAN.
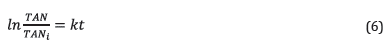
In addition, the conversion reaction can be expressed as follows:
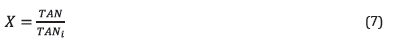
Substituting equation 7 In Equation 6.

Where k, for the first-order reaction, can be calculated from the slope of the linear plot of In X vs. time.
Assuming a second-order reaction:
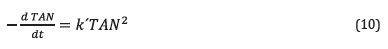
Similar to Equation 7:

Substituting equation 11 in Equation 10:

Solving the integral of Equation 12:
Thus, the reaction rate constant for the second-order reaction can be calculated from the slope of the linear plot of 1/X vs. time.
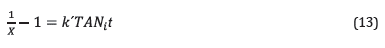
Statistical parameters such as percentages of Mean Square Error (%RMSE) and model efficiency (EF) were determined using Equations 14 to 16, [15,16] where y' is the value predicted by the model, yi is the measured value, m is the number of measurements, and Yi' is the mean of the measured values.
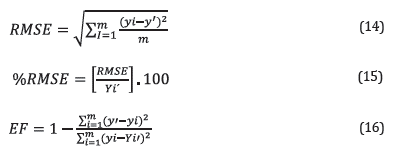
In general, the accuracy of a model is considered excellent when %RMSE < 10%, good if 10 ≤ %RMSE < 20, acceptable when 20 < %RMSE ≤ 30, and not so exact when the %RMSE exceeds 30%. Similarly, a model is considered efficient if EF ≥ 0.6.
FRACTIONATION OF NAPHTHENIC ACIDS
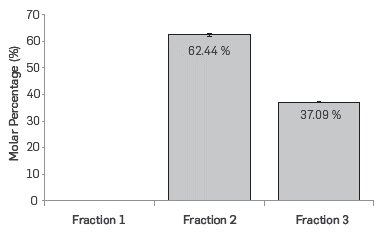
The molar percent of each of the fractions of naphthenic acids is shown in Figure 1. Fraction 1 has TAN = 0; therefore, the total number of moles of carboxylic groups is distributed in fractions 2 and 3, indicating that fraction 1 does not contribute to the acidity of the commercial mixture of naphthenic acids. The weight percentage of fraction 1 in the commercial blend of naphthenic acids was 22.94%. Other researchers have reported that this fraction corresponds to a mixture of esters, hydrocarbons, and benzenes among others. [17]
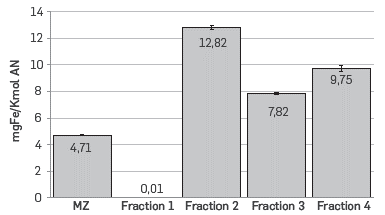
As previously stated, the corrosion tests were conducted using a commercial blend of naphthenic acids (MZ), as well as each of the fractions. As shown in Figure 2, the results confirm that fraction 1 is inert and did not cause any corrosion to the AISI SAE 1005 coupons. However, it was also observed that MZ has the lowest reactivity compared to fractions 2, 3 and 4, which suggests an inhibition effect by fraction 1 in the blend. Moreover, naphthenic acids included in fraction 2 were more reactive than those in fraction 3, which suggests that the fractionating method produces acids with different structural characteristics.
CHARACTERIZATION OF FRACTIONS OF NAPHTHENIC ACIDS.
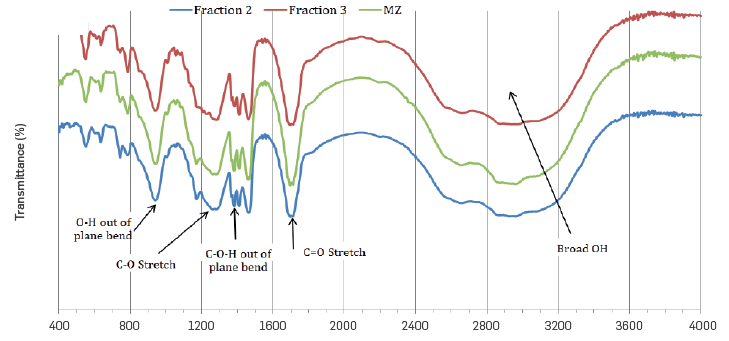
The FTIR-spectra of fractions 2 and 3 are shown in Figure 3. An intense band is observed at 1705 cm-1, which corresponds to the stretching of the C=O group in the carboxylic acids. In addition, a band between 2500 and 3500 cm-1was also observed, corresponding to tension vibration of the O-H group associated to the acidic function. The absorption due to off-plane bending of the OH bond results in the band observed at 930 cm-1. The asymmetric and symmetric stretching of the CH2 methylene groups was shown at 2924 and 2866 cm-1, respectively. The signal at 1377 cm-1 corresponds to off-plane bending of the C-O-H group, a characteristic of carboxylic acids. The signal corresponding to C-0 bond stretching was observed at 1265 cm-1, while the vibrations of the methylene group appeared at 1378 and 1472 cm-1. The band corresponding to vibration balancing of the CH2 group at 720 cm-1 indicates the presence of this group in carbon chains of more than four carbons. The C=C absorption stretching in aromatic bonds was not observed between 1595 - 1620 cm-1. The spectra of the commercial blend and the respective fractions did not show significant differences with this method.
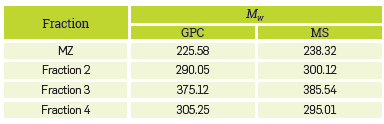
The average molecular weight of the fractions calculated by GPC and MS is included in Table 2. It shows that fraction 3 contains naphthenic acids of higher molecular weight compared to fraction 2. In general, a good match is observed in both analytical methods.
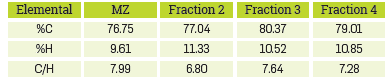
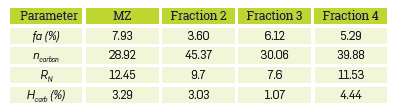
The elemental composition of the fractions of naphthenic acids and the commercial blend is reported in Table 3. The results in Table 3 confirm that the C-to-H-ratio for fraction 3 is greater than for fraction 2, suggesting a lower degree of saturation in fraction 3. This is apparently associated with a greater amount of aliphatic chains or aromatic rings in fraction 2. Supposin that the remaining elemental composition can be attributed to oxygen, then MZ, fraction 2, fraction 3, and fraction 4 contain 13.64%, 11.63%, 9.11% and 7.38% of oxygen, respectively. Since each molecule contains one carboxyl group and no other forms of oxygen, a molecular formula can be calculated from the elemental analysis data. [15] Prototype naphthenic acids have the following formulas and molecular masses: MZ: C 15.6 H 23.2 O 2 (M W =241.93), fraction 2: C 17.7 H 31.2 O 2 (M W = 275.14), fraction 3: C 23.5 H 36.9 O 2 (M W = 351.15), and fraction 4: C 20.8 H 34.2 O 2 (M W = 315.58). In fact, the calculated average molecular weights are close to those obtained experimentally by GPC and MS (Table 2).
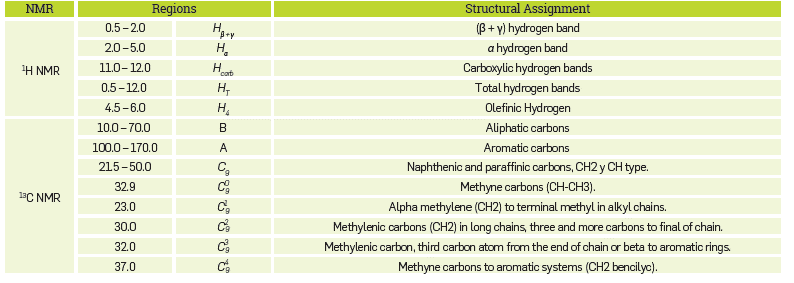
The complete assignment of the 1H NMR and 13C NMR spectrum in terms of various hydrocarbon groups, is included in Table 4.
Structural parameters were determined from the 1H NMR spectra The aromaticity of each test sample was calculated using Equation 17, where, A and B correspond to the integrals for the aromatic carbon band (from 100 to 170 ppm region), and the aliphatic carbon band (from 10 to 70 ppm region), respectively. A large number of equations for calculating the naphthenic ring number (R N ) have been reported. [18-20] However, in this case, the expression proposed by Molina et al. [21] included in Equation 18 was used. This expression has been used more frequently for the characterization of crude oil and derivatives.
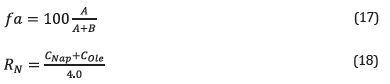
C Nap and C ole are the naphthenic and olefinic carbon contents, respectively, determined with Equations 19 and 20:
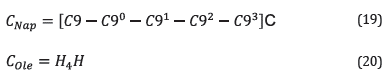
Equations 19 and 20 C and H contain the percentages of carbon and hydrogen for each sample (Table 4). Each alkyl side chain (n carbon ) was defined as: (22)

Table 4 Assignment and Division of the \U NMR and 13C NMR Spectrum of naphthenic acid fractions for Measuring the Integral Intensity.
Where Hα, Hβ and Hγ are equal to the integrals over α, β and γ hydrogen bands, respectively (Table 4). The percentage of hydrogen in carboxylic groups was determined from the following expression:

Where H carb and HT can be determined by the integrals of the regions included in Table 4. Table 5 includes the structural parameters determined for the commercial mixture and the fractions.
KINETIC STUDY
The kinetics of the corrosion reaction in the commercial blend and their respective fractions was adjusted to a second-order kinetics. The linear relationship between the inverse of the conversion (X) and the reaction time in the range of evaluated temperatures are shown in Figures 4 to 7 for the commercial blend, as well as for the different fractions
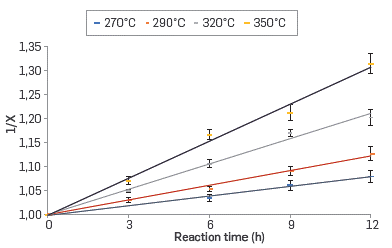
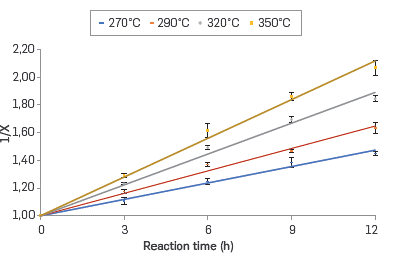
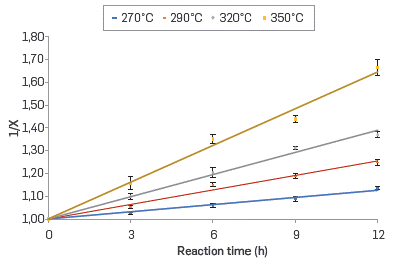
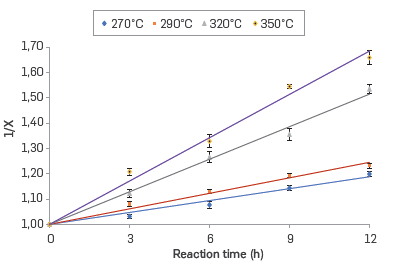
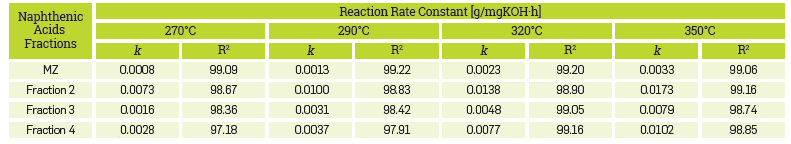
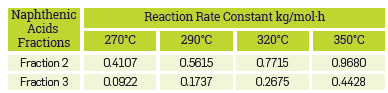
In addition, the kinetic constants for the corrosion reaction of the AISI SAE 1005 steel when exposed to the commercial blend as well as to the different fractions are presented in Table 6. The results confirm that the naphthenic acid corrosion reaction is an endothermic reaction in the temperature range evaluated in this study.
ARRHENIUS PLOT AND ACTIVATION ENERGY
The activation energy of the corrosion reaction driven by the naphthenic acids can be calculated from the linearization of the Arrhenius equation (Equation 23).
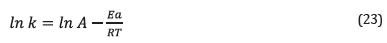
Where k is constant reaction kinetics for each temperature, with units of g/mgKOH・h, A is the frecuency factor (g/mgKOHh), E α is the activation energy (kJ/mol・K), R is the ideal gas constant (kJ/mol・K) and T corresponds to the absolute temperature (K). A and E α can be calculated from the Arrhenius plot (Figure 8).
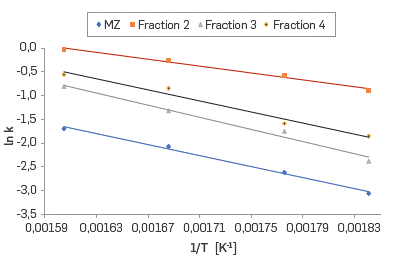
Figure 8 Arrhenius plots for the reaction between AISI SAE 1005 carbon steel and the commercial blend and the fractions.
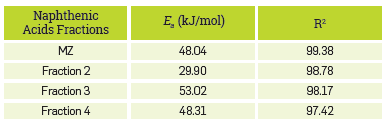
Significant differences between the activation energy of Fraction 2 and Fraction 3 are observed in Figure 8, which are confirmed by the values included in Table 7. Apparently this difference relates to the structural characteristic of the naphthenic acids present in these fractions.
Considering corrosion reactions of each fraction as parallel and independent.
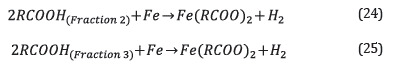
The kinetic expression for each reaction is shown in equations 26 and 27.
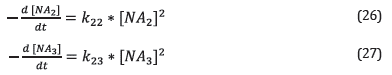
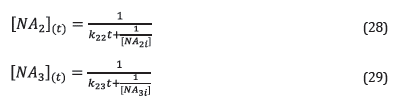
Where [NA 2 ] and [NA 3 ] are the concentration of naphthenic acids of Fraction 2 and Fraction 3. k 22 , k 23 are the kinetic constants of the corrosion reaction of fraction 2 and fraction 3, respectively (Table 6). Integrating equations 26 and 27, the equations 28 and 29 were obtained. Equations 28 and 29 correspond to the naphthenic acid concentration in fraction 2 and fraction 3 at time t, respectively.
Then, the total moles reacting at time t corresponds to:

Where [NA]i is the initial concentration of naphthenic acids, while [NA2](t) and [NA2](t) correspond to the concentrations of naphthenic acids of Fraction 2 and Fraction 3 at time t. Given that in the corrosion reaction by naphthenic acids, two moles of naphthenic acids react with a mole of iron to produce iron naphthenate, then the concentration of iron dissolved in the solution at a time t, can be calculated from Equation 31:
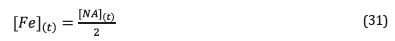
Substituting equation 30 in equation 31:
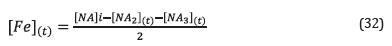
Substituting equations 28 and 29 in Equation 32:
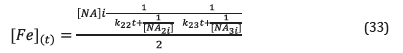
The molar concentration of naphthenic acids can be determined using Equation 34:

Where [NA] is the concentration of naphthenic acids in mol/kg, TAN has been previously defined, and W corresponds to the mass (g) of the solution used in the reactor. The used units for the kinetic constants (Table 6) were changed to calculate the concentration of ron in solution using Equation 33. The obtained values are included in Table 8.
The effect of the ratio of the molar fraction of naphthenic acids in fractions 2 and 3 on predicting the concentration of iron dissolved in mineral oil was also determined by using the values of the weight Loss on AISI SAE 1005 carbon steel. The experimental conditions used for the validation tests are presented in Table 9.
The correlation between the experimental and predicted values for the reactivity of the different molar ratios of fractions 2 and 3 as Included in Table 9, is shown in Figure 9. In addition, the obtained %RMSE and EF values for the proposed kinetic equation to calculate the dissolution rate of iron due to naphthenic acid corrosion were 10.33% and 0.90, respectively. According to the statistical parameters, the kinetic model of parallel and independent reactions predicts appropriately the iron dissolution rate. The effect of the molar ratio of fractions 2 and 3 in the error percentage of the prediction model is shown In Figure 10. A significant increase in the prediction error is observed at the mid points of the molar ratio between fraction 2 and fraction 3, which can be explained by an interaction in the corrosion reactions related to each of these fractions,
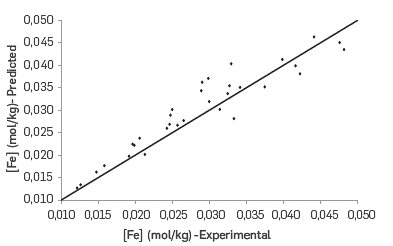
Figure 9 Validation of the proposed kinetic model for calculating the reactivity base on several molar ratios of fractions 2 and 3.
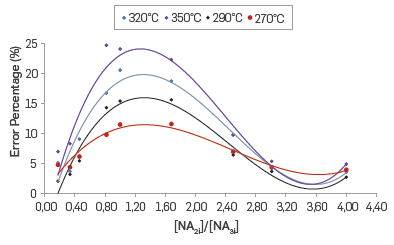
Figure 10 Effect of molar ratio [NA2i] / [NA3i] on the error percentage of the proposed kinetic model for a reaction time of 12 hours.
A model that incorporates surface chemical reactions, solid state diffusion through growing corrosion product scales, and flow dynamics has been proposed by other researchers [23], Such model has been validated using model molecules of naphthenic acids with good results in the prediction of the reaction kinetics. The Incorporation of structural parameters of naphthenic acid mixtures, obtained in this Investigation, will provide models with a better match to crude oil actual composition, complementing other proposed models.
CONCLUSIONS
This study successfully proposes and applies a methodology for conducting fractionlng of a commercial blend into two fractions of naphthenic acids with different structural characteristics and chemical compositions.
Using the fractloning methodology Introduced hereunder, two fractions with dissimilar reactivity, expressed as the amount of dissolved iron, were obtained from a commercial blend of naphthenic acids, and characterized by several analytical methods including FTIR, GPC, NMR and MS.
The particular elemental composition and structural parameters, added to the higher molecular weight determined for fraction 3, which has shown lower reactivity compared to fraction 2, suggest that it Is formed with naphthenic acids with complex structures. Furthermore, it Is considered that fraction 2 contains a larger amount of aliphatic chains or aromatic rings. In fact, the variation in the molar ratio of these two fractions seems to be the reason for the differences in the corrosivity of crude oils having the same tan.
A kinetic model using parallel and independent reactions is proposed for predicting the corrosivity of two fractions of naphthenic acids on AISI SAE 1005 carbon steel. The model reliably predicts the dissolution of iron in acidity ratios 2.4 < TAN fracri0n2 / TAN FRACTI0N3 <0.4. Outside this interval, the prediction error increases as a result of synergistic effects between the different fractions leading to the inhibition of the corrosion reaction.

