English (pdf)
 Article in xml format
 Article references
 Send this article by e-mail
 Cited by SciELO
  Cited by Google
  Similars in
SciELO
Similars in
SciELO  Similars in Google
 Permalink
1. INTRODUCTION
In-situ combustion (ISC) is a thermal oil recovery technique where an oxidizing gas (air or air enriched with oxygen) is injected into oil reservoirs to generate heat by burning a fraction of the crude oil, forming a combustion front [1-3]. ISC seems particularly suitable for heavy oils, as oil viscosity significantly decreases as temperature increases. Furthermore, during ISC, oil production is driven by flue gases and increased pressure caused by chemical reactions [4]. An advantage of ISC over other thermal recovery methods is that most of the energy required to displace the oil is generated in the reservoir from the heat released by combustion reactions [5], thus heat losses are quite small along the wellbore. This is particularly important in very deep reservoirs, as mentioned by Rodriguez [6] and Sarathi [7].
Combustion of crude oil in porous media is a complex process not fully understood. This complexity is, to some extent, derived from difficulties associated to transferring the understanding of phenomena such as chemical reaction models, mass transfer, heterogeneity of rock formation, geomechanical issues, phase equilibrium, and heat losses from the laboratory to the field [8-11]. Understanding the behavior of chemical reactions is most relevant given that the combustion of crude oil determines the released heat, the extent of coke formation, and the composition and amount of produced gas.
Combustion tubes and kinetic cells are the experimental setups most widely used to characterize ISC. The purpose of the combustion tube is to emulate, at laboratory scale, the combustion front by considering the coupled phenomena of fluid dynamics and chemical reactions. The kinetic cell is mostly used to solely study the reactions that take place in the ISC process [12]. Kinetic cells are typically modeled as a perfectly mixed semi-batch reactor where the stationary mixture of oil and rock reacts with air that flows through the reactor [13-16]. However, previous studies report heterogeneities that cause variation in the reaction velocities throughout the cell volume [17-20]. Decoupling chemical reactions and mass transfer in kinetic cells may be important to improve the predictability obtained with ISC models. Combustion tubes are usually modeled as a one-dimensional reactor [4,21]. While the chemistry and transport processes taking place in kinetic cells and combustion tubes are the same, typically their models have not been integrated; this delays the formulation of general models while favoring experimental-specific approaches. The use of comprehensive modeling simulation tools that apply the same chemical and transport sub-models to the solution of different experimental setups seems, therefore, of interest to the ISC community.
A simulation tool is a compilation of mathematical models, thermodynamic and transport databases, and solution algorithms that predict the behavior of a particular process. An archetype example of a simulation tool is CHEMKIN [22], originally developed for the generation of kinetic expressions from experimental data. CHEMKIN's novel idea was to implement modules for different reactor setups that could operate with the same kinetic expressions. This allowed researchers to improve kinetic mechanisms as they could be easily tested in multiple experiments. A similar simulation tool for the analysis of experimental data is CANTERA [23], which solves problems where chemical kinetics, thermodynamics, and transport processes are important. However, in these two simulation tools, there are no modules particularly designed for the analysis of the combustion of crude oil in porous media.
In petroleum engineering, the application of physical modelling tools for the analysis of experimental setups normally involve traditional reservoir software such as STARS [24], ECLIPSE [25], MRST [26], and others. These computer packages are comprehensive tools that enable the simulation of thermal effects, phase equilibrium, flow in porous media, chemical reactions, and geomechanical effects [27,28]. In fact, they can model ISC. However, the traditional reservoir physical modeling tools were developed to correctly predict oil extraction, and not for kinetic analysis. Their application to the small-scale experiments used in the laboratory to characterize ISC is difficult, as the complexity of reservoir simulation can obscure the kinetic analysis sought in the experiments [29]. Furthermore, in some cases it is desirable to use detailed mass transfer modelling, such as gas-phase molecular diffusion.
Computational Fluid Dynamics (CFD) packages, such as ANSYS [30] and OPEN-FOAM [31], can be also considered comprehensive simulation tools, but their application to combustion and oil flow in porous media is complex as they lack the features demanded by reservoir modeling and imply a high computation cost. The referred literature did not present evidence of simulation tools developed in particular for experimental ISC that can handle complex kinetic schemes and detailed molecular diffusion such as the one described in this study. This paper describes and validates such a simulation tool.
2. MODEL FORMULATION
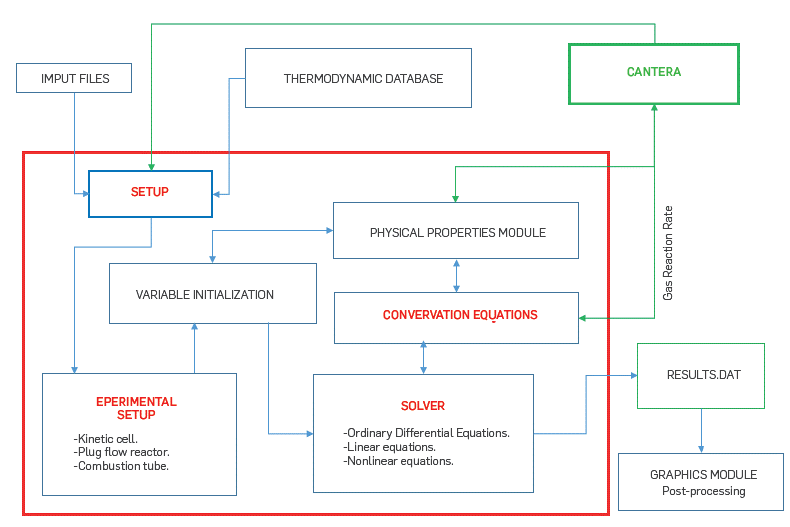
The simulation tool was designed with subroutines coded in modular blocks that use common calculations among the different reactor models. Figure A.1 presents the flowchart of the simulation tool. Blocks include input data such as reactor conditions and species transport, and thermodynamic properties. Output subroutines present the user with results such as species concentration, temperature, pressure, and performance of the numerical solver. Post-processing of the results provides additional information that is particularly interesting for ISC analysis such as saturation (defined as the volume of fluid per unit of porous volume) and species reaction rates.
Cantera [23], an object-oriented, free-source software, was coupled with the simulation tool through Matlab, using Windows architecture. Cantera was used to interpret complex homogeneous reaction mechanisms, and thermodynamic and transport databases into code language that could be used in the mole and energy balances described below. Cantera provides estimates for all the thermodynamic and transport data used in the simulation toolbox. The gas properties and gas-phase kinetic parameters were taken from GRI-Mech 3.0 which contains 325 reactions and 53 species designed to model natural gas combustion [32]. The Simulation toolbox can easily include other more sophisticated reaction mechanisms that are available in the literature (e.g. [33]), and that can account for the gas-phase oxidation of more complex substances such as diesel and gasoline.
Three modules were developed seeking to represent experimental setups to study the ISC process. The kinetic cell module involves a model which main purpose is the study of oil reactivity. The one-dimensional reactor is used to represent the axial dispersion of gas in a kinetic cell. In this module, only the gas phase flows through the cell, a reasonable assumption in an ramped temperature oxidation (RTO) experiment where all the oil is consumed in the cell. Finally, the combustion tube module shows a more realistic representation of the pressure and temperature profiles in an ISC characterization experiment. This module allows for oil, gas, and water flow. The three modules are explained in further detail in the sections below.
KINETIC CELL
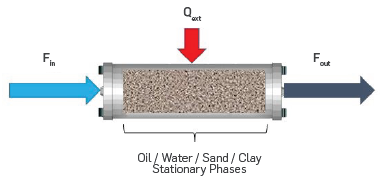
Figure 1 shows the typical experimental setup of a kinetic cell, i.e. a reactor packed with a mixture of crude oil, sand, clay, and water, which is heated externally to follow a programmed heating rate. Air is injected at a constant flow rate (Fin) to react with the oil sample. The products are combustion gases (Fout) and residual solid.
The kinetic cell was modeled as a spatially homogeneous, semi-batch reactor, adapted to account for porous media where only gas flows through the reactor, and the oil and solid phases are stationary. This is an approximation that does not consider the effect of gravity on the liquid or gas flow. As this model was used to understand the effect of gas-phase chemistry, this approach will have a minor effect on the model predictions. Oil and water are considered immiscible. Diffusion transport was neglected because of the typically high Peclet numbers of reservoir flows as mentioned by Kristensen [13]. Equation 1 shows the mole balance of species i in the kinetic cell.
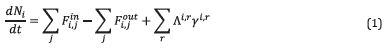
where N i represents the number of moles of species i in the porous medium, F in i,j and F out i,j are, respectively, the inlet and outlet molar flow rates of species i in phase j, Λ i,r and γ i,r are, respectively, the stoichiometric coefficient and reaction rate for species i in reaction r.
ONE-DIMENSIONAL REACTOR
In the model for the One-dimensional reactor considered convective transport in porous media, diffusion is neglected. In Figure 2, a sum of perfectly mixed reactors in series represents the flow in a 1D reactor. The mole balance from Equation 1 is solved for each reactor. The inlet for reactor K corresponds to the outlet from reactor k-1; the outlet from reactor k is the inlet for reactor k+1.
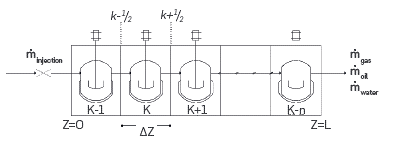
Figure 2 Schematic diagram for the discretization used for the One-dimensional reactor and the Combustion tube. ṁ oil and ṁ water apply only for the Combustion tube
Considering oil and solid phases stationary, and that only gas flows through the reactor, the One-dimensional reactor module in the simulation tool is suitable for modeling ramped temperature oxidation (RTO) experiments.
COMBUSTION TUBE
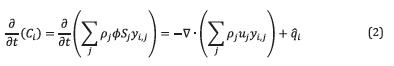
The Combustion tube module considers oil, gas, and water flow as shown in Figure 2. Equation 2 presents the mole balance of species i in phase j.
where C
i
is the concentration of species i, ρ
j
is the molar density for phase j, ϕ is the porosity, S
j
is the saturation of phase j, y
i,j
is the molar fraction of species i in phase j, u
j
is the velocity of phase j, and
 is the generation rate of the species i. Equation 2 is solved for each species for all phases using a fine finite volume method.
The velocity of the fluid phases was represented by Darcy's equation (Equation 3).
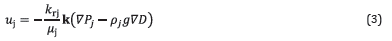
where P j is the pressure for phase j, k is the permeability tensor, k rj is the relative permeability of phase j, μ j is the dynamic viscosity of phase j, and D is the bed depth in the direction of the gravity vector. The pressure gradient was approximated using a central difference scheme.
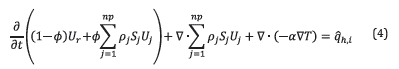
Equation 4 presents the energy balance where U
r
is the internal energy of the porous media, U
j
is the internal energy of phase j, α is the thermal conductivity of the porous media, and
 is the heat generated by chemical reactions. The reactor was considered in adiabatic operation.
Closure of the system of equations for multiphase flow is given by Equation 5 that involves an equation of state that bounds the evolution of mass and energy.

where ĉ R is the rock compressibility, ĉ f is the average fluid compressibility, and ĉ T is the thermal expansion coefficient. Phase equilibrium was represented through a five-parameter correlation for the K-value as further explained in [34]
REACTION SCHEME
As stated above, all gas phase reactions were represented by the GRI-Mech 3.0 chemical mechanisms [32]. While multiple studies [1,12,15,35-38] have been conducted to understand oil reactivity during ISC, few present the detailed information (exact reactor dimensions, kinetic parameters, transport, and thermophysical properties) required for the evaluation of simulation tools. One exception is the thesis of Bazargan [15], which provides all the details necessary for attempting validation of a simulation tool. Therefore, the reaction scheme from Rl to R3, proposed in [15] was used in all the simulations below. Through this paper, the term "reaction scheme" is preferred vs. "reaction mechanism", as the Latter seems more suitable for cases where actual chemical species participate in the reactions. The use of pseudo-species, such as "Oil", "Cokel", and "Coke2", motivated by the large number of molecules present in the system, makes the term "reaction scheme" more appropriate.
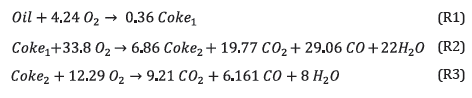
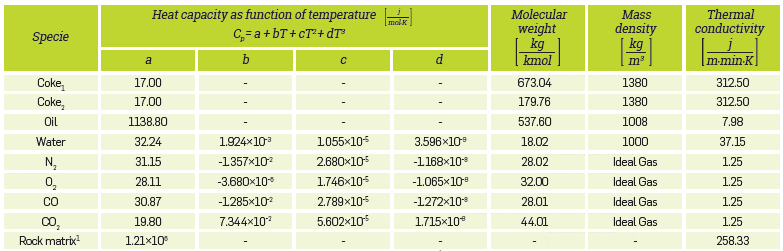
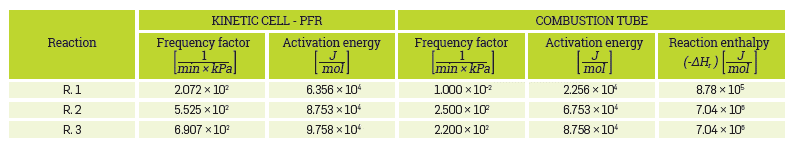
Reactions R1 to R3 represent, respectively, the cracking, low-temperature oxidation (LTO), and high-temperature oxidation (HTO) stages. Although this short-reaction scheme was selected to reduce computational time, the simulation tool accepts more complex reaction schemes. No attempt was made to improve the kinetic scheme as it was selected only to illustrate the abilities of the Simulation toolbox. Table 1 presents the kinetic parameters, taken from reference [15].
3. RESULTS AND DISCUSSION
The following sections illustrate the use of the different components of the simulation tool with real applications to ISC experiments. The first example evaluates the existence of gas phase reactions during SC. A second example demonstrates the presence of concentration gradients in kinetic cells. The third and fourth examples involve, respectively, the evaluation of pressure changes and ignition in combustion tubes.
KINETIC CELL - ANALYSIS OF REACTIONS IN THE GASEOUS PHASE
For the validation of the kinetic cell module, Table 2 presents the conditions that were used to simulate the RTO experiment. The oil used was that described by Dechelette et al. [37], and the relevant properties were exactly those reported in [15]. Figure 3 compares the results of the simulation with those in the referred literature. Both for LTO (T < 400°C) and HTO reactions (T > 400°C), the match is quite good.
Table 2 Simulation input for the experiment in reference [15].
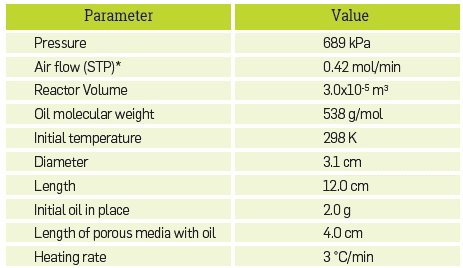
*STP: standard pressure (101325 Pa) and temperature (298 K)
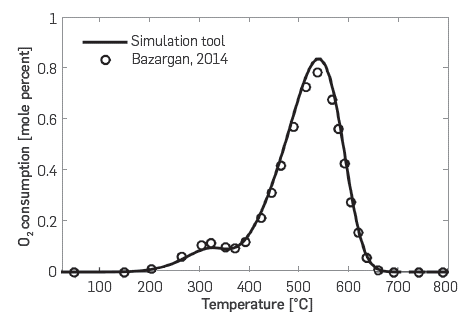
Figure 3 Oxygen consumption profile. Comparison between simulation tool (solid line) and Bazargan [15] (circles).
Once the validation was completed, and to illustrate the capabilities of the Kinetic cell module, the importance of the gas-phase CO oxidation reaction during ISC was addressed. While the effect of other gas phase reactions, such as those that involve water and other hydrocarbons in the vapor phase, would be of interest for the application of ISC, the scope of the present research is to demonstrate the toolbox ability to deal with complex kinetic schemes; therefore, this study only deals with CO oxidation. With few exceptions [39-41] in the referred literature, ISC has been described as an exclusively heterogeneous process. However, the existence of gas-phase oxidation reactions may be a matter of concern given the relatively high temperatures, particularly of HTO, the high concentration of gas-phase hydrocarbons, and the presence of oxygen in some regions of the process. An option for modeling gas phase reactions is, therefore, a desirable feature of any simulation tool for ISC.
In the illustrative simulations of the Kinetic cell module, the thermophysical properties and simulation parameters were those used in the validation, but the diameter of the reactor was 1.27 cm, the oxidizer flow rate was 300 mL (STP)/min with a composition (molar fraction) of O 2 : 0.21, H 2 O: 0.001, and N2: 0.789. The presence of water in the oxidizer stream is to be noted, given the well-known importance of the hydroxyl radical (OH*) on carbon monoxide oxidation mentioned by Winter [42-44]. While the evaluation of the effect of water vapor on the system was beyond the scope of the paper, the Simulation toolbox can easily account for different water vapor concentrations. The heating rate was 30°C/min until 800°C. At this temperature, isothermal operation started. The initial gas saturation was fixed at 0.9, while oil saturation was 0.1.
Figure 4 compares the predictions for the molar fractions of major combustion species (O 2 , CO 2 , and CO) when only heterogeneous reactions are considered with those when gas phase reactions are also simulated. At temperatures higher than 700°C, CO oxidation in the gas phase becomes important, as the CO concentration is lower than that observed when only heterogeneous reactions take place. Furthermore, carbon dioxide increases as it is the final product of CO oxidation. Although not so evident, oxygen concentration also decreases due to the activation of the homogeneous phase when the temperature is higher than 700°C.
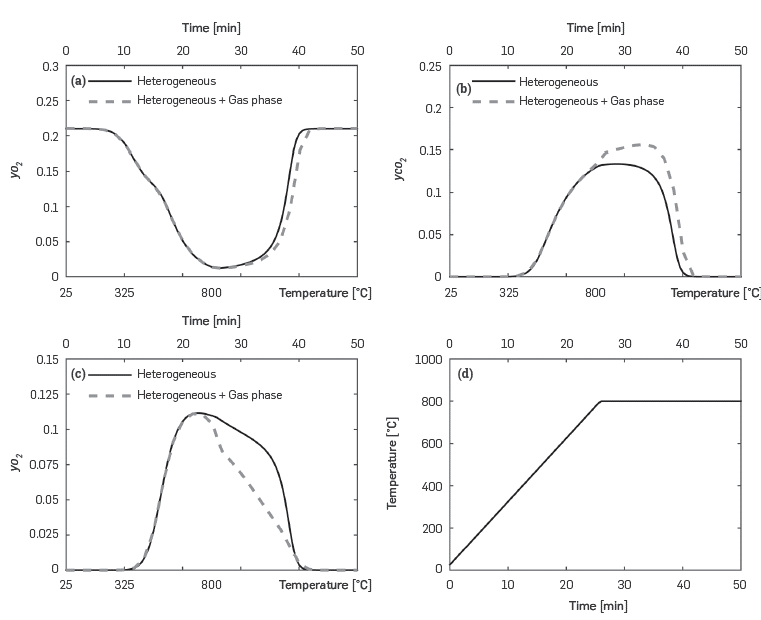
Figure 4 Predicted variation of major combustion species during a RTO-isothermal experiment. Results obtained with the kinetic cell module considering heterogeneous and heterogeneous + gas phase reaction.
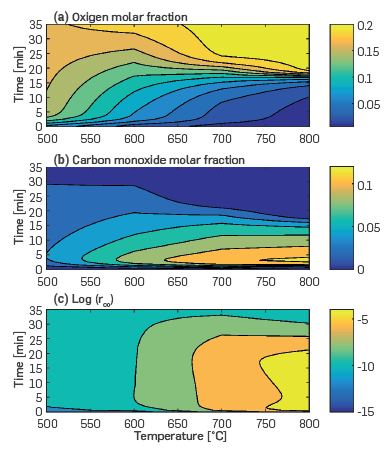
The second set of illustrative simulations for the Kinetic cell module evaluated more in depth the effect of temperature on the homogeneous oxidation of CO when the volumetric injection rate of air was 700 mL (STP)/min and the oil and gas compositions were the same as those used in the simulations shown in Figure 4. The saturation of gas, water, and oil were set as 0.79, 0.05, and 0.16, respectively. Figure 5 presents the isocontours of oxygen (Figure 5a) and carbon monoxide (Figure 5b) mole fractions, and the log of the reaction rate of CO consumption (Figure 5c) as a function of the time and temperature of the experiment. This plot is the result of multiple isothermal simulations, each one at a different temperature. In Figure 5b, a vertical line at 700°C represents an isothermal simulation that predicts that the highest CO concentration is 0.1 (mole fraction) when the time varies between 2 and 7 minutes and the combustion ends after 24 min when the oxygen and CO molar fractions regain the input values of 0.21 and 0.0, respectively, and the log of the rate of CO consumption is below 10-7 kmol/m 3 s.Figure 5 shows that, at conditions relevant to the ISC experiments in Table 2 that are for heavy oil, CO oxidation can take place in the gaseous phase. The extent of the oxidation depends on the temperature and oxygen concentration in the system. In Figure 5, CO oxidation is significant at temperatures above 700°C. It is worth noting that the analysis above was at 689 kPa as the experimental data in [15] was at those conditions. While the effect that pressure changes would have on homogeneous reactions is out of the scope of this research, we consider that the ability of the simulation toolbox proposed that the use of complex chemical schemes would be very useful as one could anticipate that heterogeneous chemistry, i.e. gas/liquid and gas/solid reactions, as well as gas-phase reactions, will be more active given the larger number of molecular collisions derived from a higher pressure.
ONE-DIMENSIONAL REACTOR - KINETIC CELL WITH AXIAL GRADIENTS
While kinetic cells have been traditionally modeled as homogeneous systems, recent studies have cast doubt on the validity of that approach [19]. The One-dimensional reactor module, described above, is particularly suitable for the analysis of ISC experiments where axial concentration or temperature gradients may be present, but where oil flow can be neglected. In the simulations, the oxidizer (21% v/v O2, N 2 balance) had a volumetric flow of 100 mL (STP)/ min. The heating rate was 5 °C/min until 800°C, where isothermal operation was maintained. The initial gas and oil saturations were 0.75 and 0.25, respectively. The pressure was constant (1.01MPa).
Figure 6 shows the oxygen molar fraction as a function of distance in the cell and time. When the temperature is 300°C, the oxidation reactions become significant, and oxygen decreases almost to zero at the exit of the Kinetic cell. After that, all the oxygen injected is consumed by the remaining oil in the kinetic cell. Towards the end of the simulation, when the temperature is stable at 800°C, the oxygen concentration is not fully depleted in the cell.
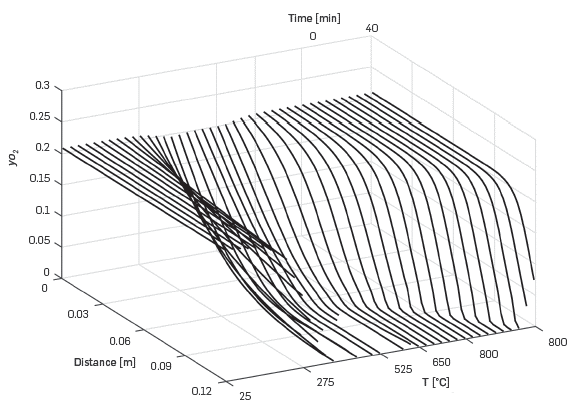
Figure 6 Predicted variation of oxygen mole fraction for a 5°C/min RTO experiment using the One-dimensional module.
Figure 7 presents the data in Figure 6 but in such way that each line corresponds to a constant temperature in Figure 6. At temperatures below 425°C (Figure 7a), the reaction rates are moderate and the oxygen in the system is above zero along the reactor. When the temperature reaches 625°C or higher, Figure 7b, a sigmoidal curve forms as oxygen is completely depleted close to the end of the reactor.
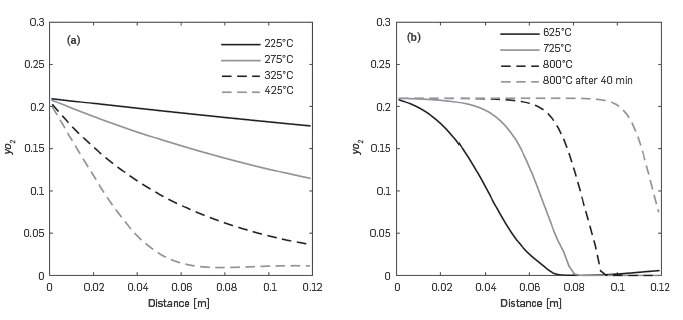
Figure 7 Predicted variation of the oxygen molar fraction along the reactor at different temperatures for the RTO experiment. a) T < 425°C. b) T > 625°C
The profiles of oil saturation in Figure 8, show that at low temperatures, oil is present throughout the cell. On the contrary, at temperatures above 425°C, oil is consumed at the entrance of the Kinetic cell and the reaction occurs in a combustion front.
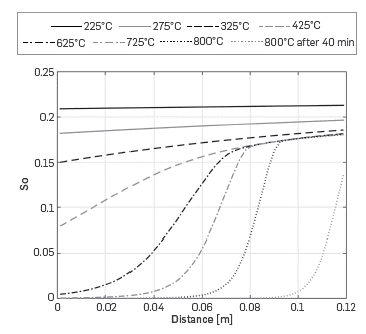
Figure 8 Predicted oil saturation profile along the reactor for different temperatures with the One-dimensional module
Clearly, under these conditions, the simulation shows that the combustion in the kinetic cell is not homogeneous. Different strategies such as higher oxidizer flow or lower oil saturation can control gradients inside the cell, as described by Lopez [19]. As demonstrated with this example, the One-dimensional module can help in designing experiments that guarantee a homogeneous concentration in the cell and facilitate the extraction of kinetic parameters from the experimental data as one can add an optimization routine that uses the Simulation toolbox to determine the kinetic parameters.
COMBUSTION TUBE - PRESSURE ANALYSIS
The use of the Combustion tube module is illustrated through validation against simulations with the physical STARS modeling tools as a means to verify the model response. The simulations considered a volumetric flow of air of 10 L (STP)/min entering the system at 500°C to secure ignition; the medium had a permeability of 10 Darcy and an oil saturation of 0.05. The crude had an API of 8.9 and the variation of viscosity with temperature was that described in [15]. A more detailed description of all the relevant oil properties, as well as all the inputs to STARS is given in [34]. Figure 9 shows the comparison of the results obtained with the simulation tool and those of STARS for two different simulation times. The match is almost perfect for temperature, pressure, and oxygen mole fraction. It should be noted, however, that the conditions of the simulation of the combustion tube are far from those observed in the field, and the pressure is lower, the permeability is high, and the oil saturation is Lower than that typically observed in the reservoirs. These values, nonetheless, are common in ISC combustion experiments, such as those that the Simulation toolbox here proposed to simulate.
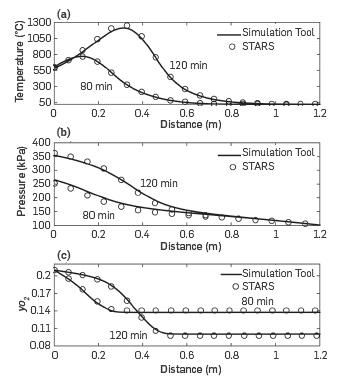
Figure 9 Combustion tube module validation with STARS [24]. a) Temperature profile, b) pressure profile, c) Oxygen mole fraction.
The advantage of the Combustion tube module in the simulation tool described in this paper, when compared with traditional reservoir physical modeling tools, is that it can be easily coupled with different reaction mechanisms, including gas-phase chemistry, as was described in the kinetic cell section. Thus, emphasis can be made in the evaluation of the kinetic parameters.
COMBUSTION TUBE - IGNITION
A second illustrative example of the Combustion tube module simuLated a reguLar combustion tube experiment with eLectricaL heating for ignition. The experimentaL conditions were the same as those in the previous section. The initial oil saturation was 0.2. The initial pressure and temperature were 101.13 kPa and 25°C, respectiveLy. The heating rate was set as 20°C/min for 30 minutes in the first 0.10 m of the tube, to obtain ignition, after adiabatic conditions were defined, so that a self-sustained process was maintained.
The temperature profiles in Figure 10a show how the combustion front, the place where the temperature is the highest at a specific time, advances through the porous media. A steam plateau, a region downstream of the combustion front where temperature reaches a value of around 120°C, is also evident. The propagation of the combustion front is stable through the duration of the simulation.
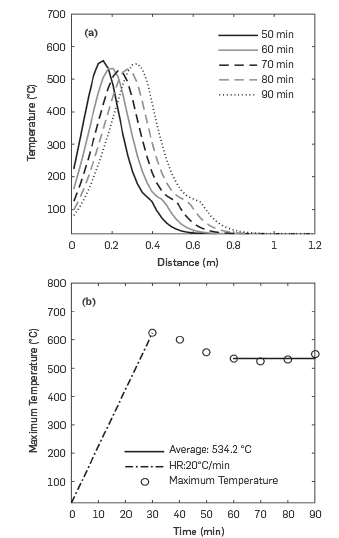
Figure 10b shows the variation of maximum temperature with time. The dashed line, which shows a linear increase of temperature over time, corresponds to the ignition process when the heating rate is set to 20°C/min in the first 0.1 m of the reactor. Thirty minutes after ignition, the temperature reaches a pseudo-steady state at an average value of 534°C. This value is of the order of those reported in ISC experiments [27,29,45,46].
CONCLUSIONS
This study described a simulation tool that can be used to study the experimental results obtained in laboratory-scale ISC experiments. Through three stand-alone modules: Kinetic cell, One-dimensional reactor, and Combustion tube, which share common thermodynamic and transport databases and chemical schemes, the kinetic can be easily tested under different experimental conditions. This ability can be used to obtain more comprehensive simulation parameters, which can be applied to reservoir physical modeling tools.
The simulation tool is unique in its ability to integrate homogeneous phase reactions in the analysis of ISC experiments. It also clearly states the equations used in the simulation. This last characteristic is particularly suitable to understand the effect of the model on the evaluation of experimental data.
Four examples selected to illustrate the simulation tool indicate that, while all modules reproduced as expected, typically-documented ISC behavior, the inclusion of homogeneous chemistry suggests that the production of carbon monoxide is very sensitive to operating conditions, particularly to O 2 and CO partial pressures and temperature. The simulations show that changes in the CO concentration due to the gas-phase oxidation occur even at 700°C and 689 kPa. This result must be confirmed with experiments in future studies to determine the impact that the gas-phase reaction and concentration gradients would have on the evaluation of kinetic parameters for ISC.
The one-dimensional reactor module can be used to evaluate strategies to prevent significant concentration gradients in a kinetic cell and, thus, simplify the evaluation of chemical parameters from experimental data. The Combustion tube module captures ISC combustion characteristics such as oil ignition with external heaters and the advance of the reaction front.