English (pdf)
 Article in xml format
 Article references
 Send this article by e-mail
 Cited by SciELO
  Cited by Google
  Similars in
SciELO
Similars in
SciELO  Similars in Google
 Permalink
1. INTRODUCTION
As humanity has become aware of the effects of climate change and environmental pollution, a process of energy transition is emerging that requires economic activities to be conducted more sustainably (Watts. Et al 2019). This transition will require the use of fuels that, while being economically competitive with current fuels, use the resources necessary for their production in a much more efficient manner, with significantly less pollution, and a lower overall carbon footprint. Natural gas is proposed as an alternative to reduce carbon emissions in power generation and global transport (IGU, I. 2018) and to leverage energy transition alternatives such as blue hydrogen and renewable energy cycles. Hence, public policies and the formulation of sustainability strategies must consider natural gas in the energy transition portfolio, bearing in mind the characteristics of each country or region (Zarei & Amin-Naseri, 2020). This is particularly true for countries like Colombia, which proven reserves of natural gas have decreased between 2012 and 2021 from 5727 to 3164 GCF (ANH, 2023; ANH, 2013).
Oil and gas companies need a holistic view of their natural gas business to understand what their best options are to value this resource and to formulate better tactical-strategic options considering the opportunities and constraints implied in the energy transition. Thus, the development of tools such as EWO (Enterprise-Wide Optimization Models) (Grossmann I. E., 2012; Grossmann I. E., 2005) is useful to support decision-making; this allows for optimizing its economic benefits, securing demand satisfaction, reducing shortages, and reducing the carbon footprint.
This paper presents an EWO-type mathematical model for planning the operations of an oil and gas company that produces, sells, buys, and uses, but does not transport natural gas in Colombia. The objective of the model is to optimize the profit for the commercialization of natural gas to guarantee the supply of gas to commercial clients and the production, transportation, and refining operations of the modeled company.
BIBLIOGRAPHIC REVIEW
There are several studies available in the literature on the development of mathematical models of natural gas marketing and supply by pipeline systems, where most of the work focuses on integrated modeling of the entire natural gas value chain. (Hamedi et al., 2009) and (Dara et al., 2020) present models for planning natural gas supply chain operations by optimizing economic objective functions, and considering demand constraints, volumetric balance, transportation capacity, and customer requirements. (Zarei & Mohammad Reza, 2019) and (Zarei & Amin-Naseri, 2020) model the entire natural gas value chain using mixed-integer optimization models focused on the supply system design. The model presented by (Contesse et al., 2005) is focused on a single segment of the value chain: the optimization of the day-to-day operation of a local natural gas distribution company in Chile.
Other works in the literature are focused on the optimization of natural gas transportation. Specifically, this type of research focuses on the application of mathematical optimization for natural gas transportation and storage, and the modeling of pipelines and gas quality in transportation systems. (Ríos-Mercado & Borraz-Sánchez, 2015). For example, the work of (Mikolajková et al., 2017) and (Üster & Dilaveroglu, 2014) present mixed-integer non-linear programming (MINLP) of multi-period planning models to determine distribution network sizing and pipeline operating conditions by minimizing total costs.
Other research refers to modeling the natural gas market, without directly modeling the supply chain. For example, (Devine et al., 2014) propose a linear programming (LP) model that optimizes the demand attention considering the stochastic nature of daily gas demand in the UK to determine the demand supply and daily gas prices. (Egging, et al., 2010) propose a multi-period numerical equilibrium MCP (Mixed Complementarity Problem) model that represents the global natural gas market by including 80 countries corresponding to 98% of world production and demand.
There is research that uses strategies other than the formulation of optimization models for studying the natural gas value chain. For example, (Olaya & Dyner, 2005) integrate the system dynamics methodology with an optimization model to analyze the sustainability of the natural gas industry, and to calculate the volumes transported at minimum production and transportation costs. (Becerra-Fernandez, et al., 2020) also use system dynamics to evaluate natural gas value chain supply policies, incorporating natural gas demand, transportation, production, and reserves variables. (Villada & Olaya, 2013) propose a simulation model to represent and analyze the day-to-day operation of natural gas trading that considers the structure of the gas network, plus transport limitations, demand fluctuations, and market rules, and study the policies that affect the transport system to increase security in the supply of natural gas.
The model proposed in this paper considers prioritization for the supply of natural gas demand according to government guidelines and, therefore, works modeling prioritization of natural gas supply was investigated. For example, in the NLP model presented by (O'Neill, et al.,1979) gas end-users are divided into 9 categories according to gas usage, and gas rationing is prioritized using an algorithm that sequentially solves the model for each of the levels in order of priority (i.e., starting with level 1 and ending with level 9): at each iteration, the shortfall in meeting the respective demand for each priority is minimized, and the objective functions are set to their respective values. Prioritization studied by (Selot, et al., 2008) is based on hierarchically ordering different objective functions for a MINLP model that optimizes the decisions of operators controlling the system, and production allocations in the natural gas supply chain in Malaysia. These authors solve the problem by sequentially optimizing the objective functions in the following order of priority: first, maximize dry gas delivery; second, maximize condensate production; and finally, maximize production from certain fields. (Liu, et al.,2009) propose a mixed-integer linear programming (MILP) model that integrates natural gas-fired power plants with their transmission system. They consider the allocation of gas to meet two types of demand: residential and industrial, where the highest priority is the residential market; the proposed model is solved using the Benders decomposition model to model the prioritization of contracts.
The main objective of this paper is to present a support tool for decision-making for an oil and gas company engaged in marketing natural gas in Colombia. The model aims to be used in the planning of the following operations: gas production in fields in which the company participates and the supply of gas for meeting both internal consumptions of the company and commercial customer's requests, i.e., planning the purchase, sale, and transportation of natural gas. The optimization model must also allow a flexible structuring of various priority levels to meet the natural gas demand. The optimization problem is solved using a sequential resolution strategy where the solution is refined through the hierarchies defined by the prioritization established by the Colombian Government and the company's requirements.
The rest of this document is organized as follows: Section 2 describes the problem under study. Section 3 presents the mathematical formulation of the model. Sections 4 and 5 describe the structure of the optimization problem and its solution strategy. The case studies and the analysis of their outcome are presented in sections 6 and 7, respectively. Lastly, in section 8, the conclusions and future work are mentioned.
2. PROBLEM STATEMENT
The model presented herein seeks to represent the operations of a company in the oil and gas industry that, in terms of natural gas, has the following functions: (i) gas producer (with a holding in different production fields and selling natural gas to its customers through supply contracts), and (ii) gas consumer (needs natural gas for several processes in its assets such as refineries, thermal power plants, and oil fields). Therefore, the company needs to acquire supply contracts with fields owned by it or by third parties that can meet its demand and must also subscribe to transportation contracts for transporting the gas to its place of consumption. The regulatory and technical issues that were considered to build the mathematical model are discussed below.
CONTRACTS FOR THE SUPPLY AND TRANSPORTATION OF NATURAL GAS IN COLOMBIA
To purchase natural gas, it is necessary to execute supply contracts with the producing companies in the production fields that can be categorized as follows (CREG, 2017): (1) contracts that guarantee firmness levels (guarantee the supply of a maximum amount of natural gas without interruption) and (2) interruptible contracts (do not assume commitment for continuity in the delivery of natural gas supply, as the gas supply can be interrupted by any of the parties at any time). The natural gas allocations for supply contracts are based on the daily nomination by the customers. Note that, for contracts that guarantee firmness, the consumer may demand an amount of gas less than or equal to that stipulated in the contract but may never request a greater amount. Those interested in transporting gas from the production fields to the consumption site must execute transport agreements with the operating agents of the National Transportation System (NTS) and meet the quality characteristics and conditions set by state agencies (CREG, 2007).
TRANSPORT AND MANAGEMENT OF NATURAL GAS DEMAND
The modeled company is not a carrier agent of the NTS and, therefore, does not control the direction of gas flows in the system. The amount of gas produced and transported by other companies is used as input in the model and is obtained from public data extrapolated to the planning period intended for the study. This allows the model: (1) to evaluate the transport capacity in the gas pipelines network, and (2) to have information on how the national demand is met with gas supplied by the company and by third-party producers. To determine the natural gas allocations in the fields, it is necessary to cross-reference the demand information at the consumption nodes with the supply contracts by modeling the transportation system, as the supply contracts do not specify the exact consumption node where the allocated gas will be used.
PRIORITIZATION OF GAS ALLOCATIONS IN THE PRODUCTION FIELDS
Priority levels for meeting gas demand are relevant for the mathematical model proposed, as the natural gas traders are affected in their allocations to supply contracts and internal consumption due to the priorities defined by government guidelines. Such priorities can be changed when shortage scenarios occur, and those changes are made taking into account the effects on the population and the consumption needs in the affected regions (Ley 401 de 1997). Usually, the supply shortage scenarios may occur because of: (a) dramatic increases in gas demand due to seasonal phenomena, (b) unforeseen constraints in the transportation system, (c) unforeseen gas production constraints, or (d) scheduled maintenance on the fields or the transportation network.
3. MODEL MATHEMATICAL FORMULATION
This article develops a mathematical NLP model that serves as a decision support tool for an oil & gas company in Colombia which produces, sells, buys, and use natural gas for its operations, but it is not the owner of the gas pipeline network neither have storage capacities. The optimization model seeks to maximize the profit margin for the commercialization of natural gas subject to constraints of gas availability in the fields, operational constraints of the company, transportation capacity in the gas pipeline network, natural gas national demand, and prioritization to meet the demand. As the modeled company does not have options to store natural the gas, the model is formulated in a steady state as a single-period planning model with a monthly planning horizon. The parameters and variables have units of daily averages over monthly periods.
GENERAL DEFINITIONS
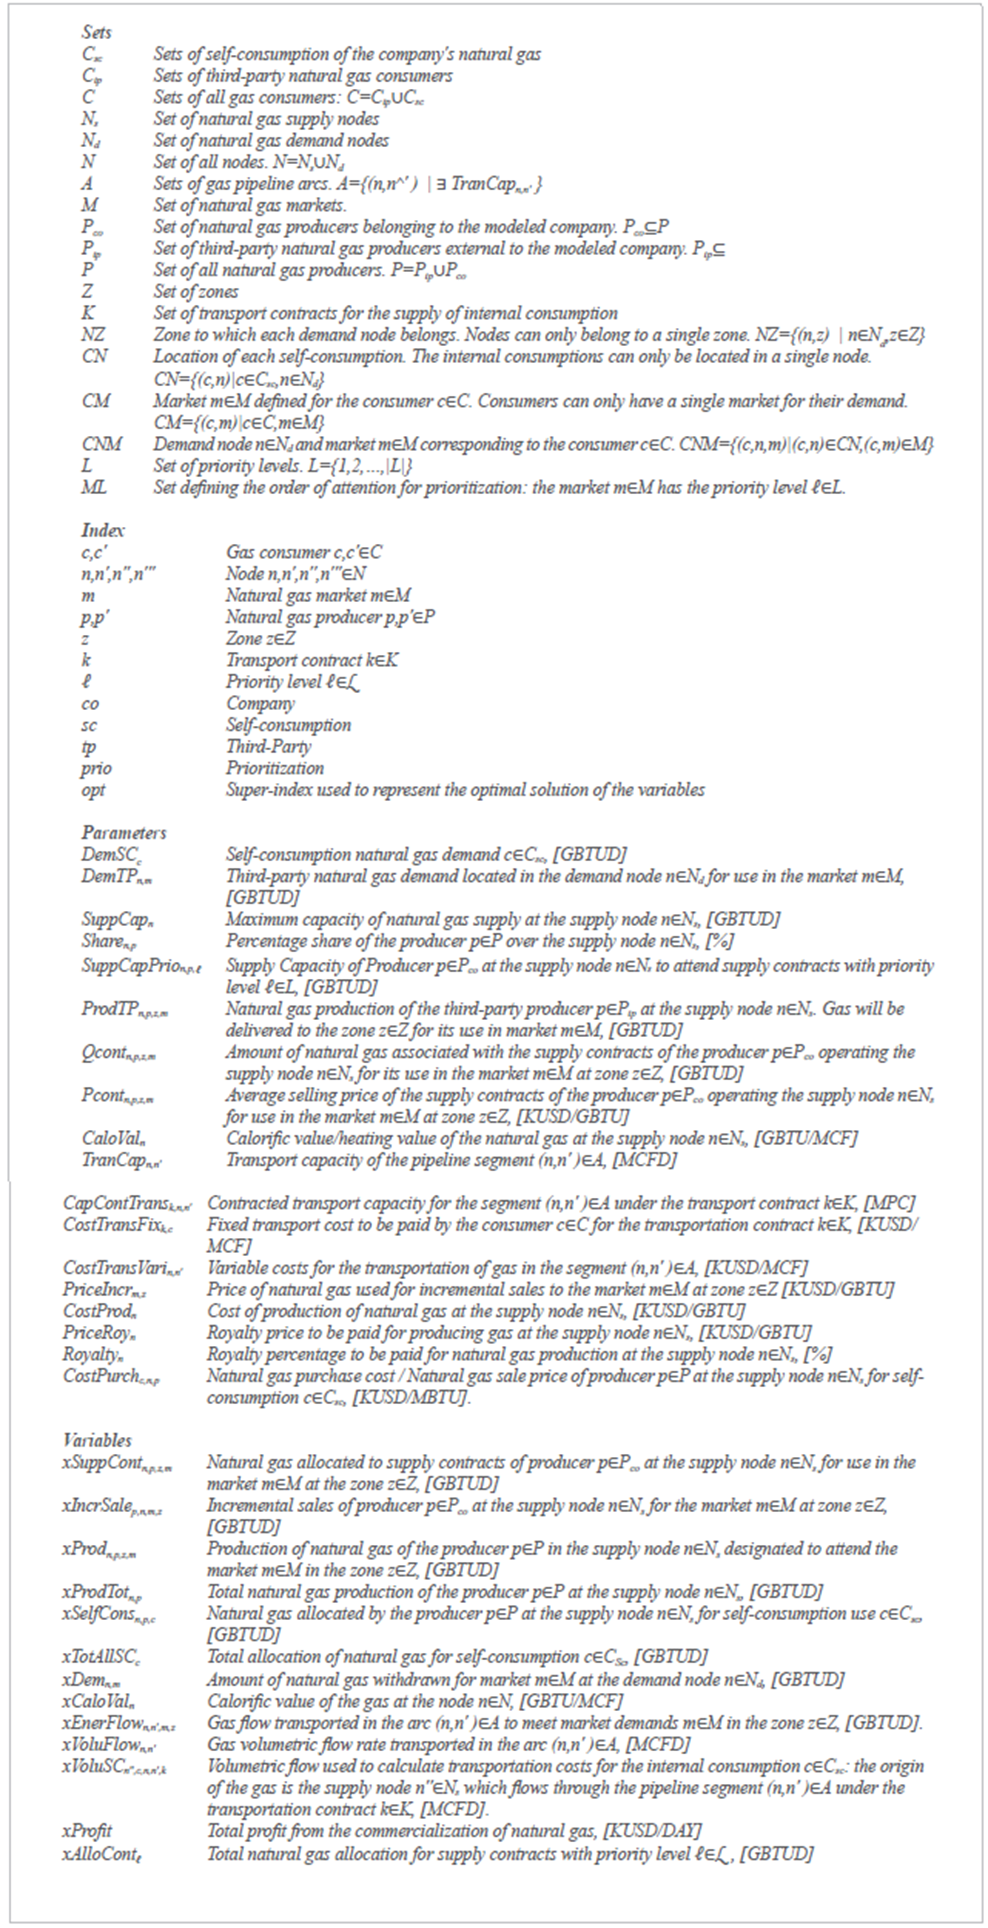
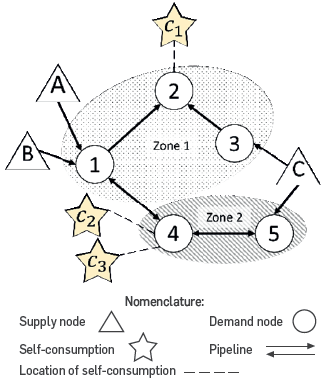
The infrastructure of natural gas transport is modeled as a directed graph, G=(N,A) where N is the set of all nodes and arcs, which for this model are gas pipelines (Figure 1). The nodes are subdivided into subsets: N s , the set of supply nodes (gas production fields and regasification plants) and N d the set of demand/consumption of natural gas. In addition, the nodes N d are grouped in zones defined by the set Z.
Set C represents the natural gas consumers and is subdivided into C tp , the set of gas consumers external to the company or third-party consumers, and Csc, the set of internal consumption or self-consumption of the company. The parameter DemTP n,m represents the demand for natural gas from third-party consumers, while the parameter DemSC c considers the self-consumption demand. The set M represents the markets for the demand of natural gas, i.e., the use that each consumer will give to the natural gas. The location and the demand market for each internal consumption are defined by the sets CN and CM, respectively.
Gas production fields and regasification plants may have the participation of different producers represented by the set P=P tp u P co , where P tp is the set of third-party producers (external to the modeled company), and P co is the set of producers belonging to the modeled company. The share of each of the producers is defined by a share percentage Share n,p .
NATURAL GAS ALLOCATIONS
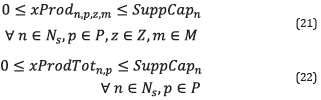
Eqs. 1 and 2 present the mathematical formulation for calculating the natural gas production of the gas producers at the supply nodes as the sum of all their natural gas allocations: supply contracts (xSuppCont n,p,z,m ), internal consumption (xSelfCons n,p,c ), incremental sales (xIncrSale p,n,m,z ), and allocations of third-party companies (ProdTP n,p,z,m ). In addition, the total production of a supply node is limited by its maximum natural gas supply capacity (SuppCap n ), as shown by constraint 3.
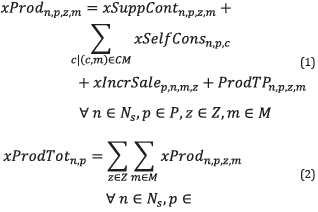

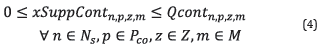
Supply contracts that guarantee firmness levels are used to meet the demand of third-party consumers since the consumer who holds the contract specifies the market and the zone where the gas will be used. The allocations of supply contracts (xSuppCont n,p,z,m ) are limited by the amount of gas contracted (Qcont n,p,z,m ), as shown in Eq. 4.
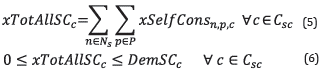
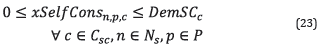
Allocations to self-consumption (xSelfCons n,p,c ) only allow meeting the demand for self-consumption (DemSCc), as represented in constraints 5 and 6.
Like allocations to supply contracts, incremental sales (xIncrSale p,n,m,z ) are used to meet the demand of third-party consumers; in fact, incremental sales can be used to meet the requirements of possible interruptible gas supply contracts.
MODELING OF THE TRANSPORT SYSTEM
Eq. 7 calculates the natural gas flow leaving each supply node (xEnerFlow n,n',m,z ), while Eq. 8 shows the balance over each demand node. The balances are formulated by market and by zone to estimate the amount of gas withdrawn at the nodes (xDem n,m ). In addition, Eq. 9 sets the maximum limit for natural gas extracted at each node, since the amount of natural gas withdrawn at each demand node is limited by the total demand of third-party consumers (DemTP n,m ) and self-consumption of the company (DemSCc).
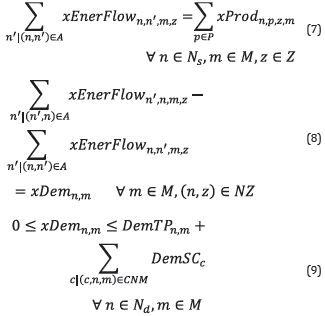
The volumetric balances of Eqs. 10 to 13 are made without considering the market or the zone in the flow variables (xVoluFlow n,n’ ). This allows modeling of the possible decisions made by transportation agents in the NTS, as it is assumed that they focus exclusively on supplying the gas volumes demanded by consumers, regardless of the gas origin or market.
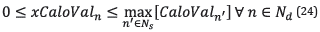
The nonlinearity in the model is given by Eqs. 11 and 12 to calculate the calorific value (xCaloVal n ) after mixing different flows in a node. Although the bilinear terms could be difficult to solve, they are necessary to consider the differences in the gas composition in Colombia. According to (CREG, 2007), the caloric value (CaloValn) in the NTS could range from 1.15 to 0.95 GBTU/MCF; we consider this as a significant difference to formulate the nonlinearity of the model instead of assuming equal calorific powers for all supply nodes.
ECONOMIC EQUATIONS
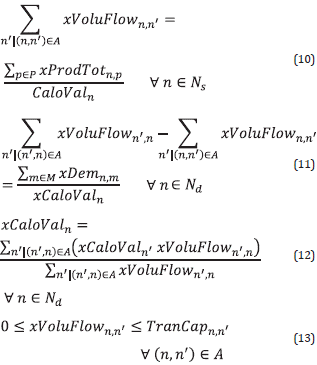
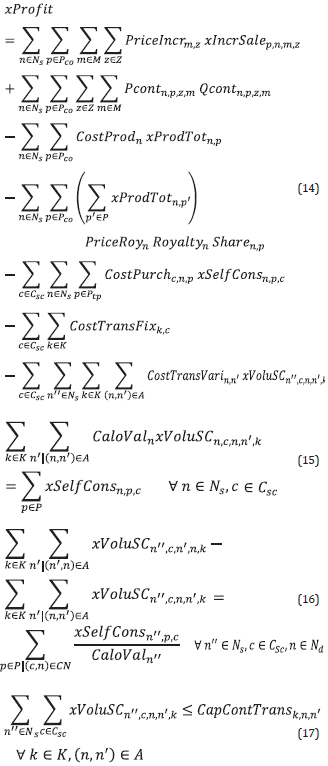
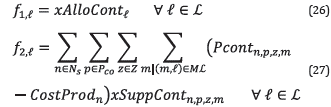
The profit for the commercialization of natural gas is calculated as the difference between the company's revenues and expenses: (1) incremental sales revenues, (2) supply contract revenues, (3) production costs, (4) royalty payments, (5) cost of gas purchases from third-party producers, (6) fixed transportation costs and (7) variable transportation costs.
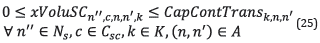
To calculate variable transportation costs, balances are formulated to establish the route of transportation contracts (xVoluSC n,c,n,n,k ) that should be used for each internal consumption. Eqs. 15 to 17 are used for this purpose, considering the transport capacity contracted through the transport contract kEK (CapContTransk,n,n').
PRIORITIZATION OF GAS ALLOCATIONS
It is considered that the priorities imposed on natural gas allocations are based on the end consumer's use of natural gas. Figure 2 shows that the priority levels for supply contracts can be configured by the user.
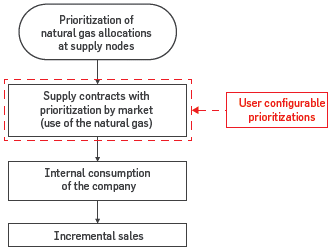
The objective of prioritizing natural gas allocations, as shown in Figure 2, is to ensure compliance with the commitments made by the gas-producing company with its customers. Therefore, the following is considered:
The allocations to supply contracts with third-party consumers have a higher priority than the allocations to the company's internal consumptions. Incremental sales have the last level of priority.
The order of attention of the supply contracts can be configured by the user via the set ML.
If a supply node is unable to meet its total firm demand (supply contracts), it cannot allocate gas to other uses such as the company's internal consumptions or incremental sales. Instead, the supply node will have to allocate all its gas to the contracts according to the priority levels, and then prorate its allocations based on the contracted quantity for each one of them.
Incremental sales are at the last level of priority because a producing field should only make incremental sales if, and only if, it has met its respective supply contracts, and has allocated the necessary gas to meet the company's internal consumption demand.
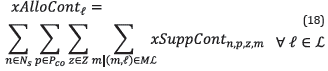
Eq. 18 calculates the allocations made to supply contracts for each priority level l∈ℓ.
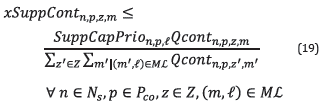
The prorating of supply contracts is intended to proportionally distribute the amount of gas available among all contracts. For modeling the prorating, constraint 19 is used, which establishes an upper limit for the allocation of contracts based on the contracted quantity (Qcont n,p,z’,m’ ) and the field availability (SuppCapPrio n,p, ℓ).
VARIABLE BOUNDS
The limits of the variables are presented below. Bounds are fundamental for the nonlinear model presented in this work.
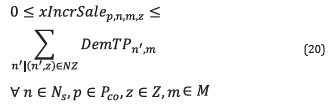
The incremental sales are limited by the demand of third-party consumers:
The production of a supply node is limited by its maximum natural gas supply capacity:
Natural gas allocations for internal company consumption are limited by their respective demand:
The heat value of the natural gas at each node is limited by the maximum heat value in the network:
The volumetric flow used to calculate internal consumption transportation costs is limited by the contracted transport capacity for each segment:
Note that Eqs. 4, 6, 9, and 13 already show the bounds for variables xSuppCont n,p,z,m , xTotAllSC c , xDem n,m , and xVoluFlow n,n’ , respectively.
4. FORMULATION OF THE OPTIMIZATION PROBLEM
The model proposed in this paper is formulated as an optimization problem that maximizes the economic benefit from natural gas commercialization and guarantees the allocations to supply contracts and the allocations to self-consumption. All these decisions must consider the order of allocations imposed by the prioritization of the demand.
As mentioned in the bibliographic review, a few papers can be found in the literature that considers modeling prioritization for natural gas allocation in optimization models. These works are characterized by the use of iterative resolution strategies based on the hierarchies of the prioritization they attempt to model. A similar strategy is then proposed in this paper, based on the definition of hierarchies shown in Figure 2. Each of the hierarchies is defined below:
max f 1ℓ : maximize the allocation to supply contracts with priority level ℓ.
max f 2 ℓ . maximize the economic benefit associated with the allocation of contracts with priority level ℓ.
max f 3: maximize the allocations made for internal consumption.
max f 4: maximize the company's total profit.
5. SOLUTION PROCEDURE
Given that the objectives proposed are classified in order of importance, the lexicographic method for solving optimization problems can be used (Singiresu S., 2009). This solving strategy is based on the iterative solving of optimization problems defined by the different objective functions of a model: the objective function with the highest priority is solved first, and then the second objective function is solved while ensuring that the optimal value of the first solved function is preserved; this process is repeated until all the objectives have been solved.
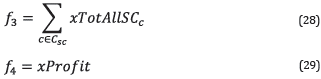
For this paper, an algorithm based on the resolution of the lexicographic method is used in such a way that all the objectives are solved while respecting the prioritization of natural gas allocations. Figure 3 shows a flowchart explaining the resolution algorithm based on the hierarchy of objectives of the optimization problem. The hierarchy of priority levels l is used to maximize f 1,ℓ and f 2,ℓ within loops that go through all priority levels ℓ to get the gas allocations to supply contracts.
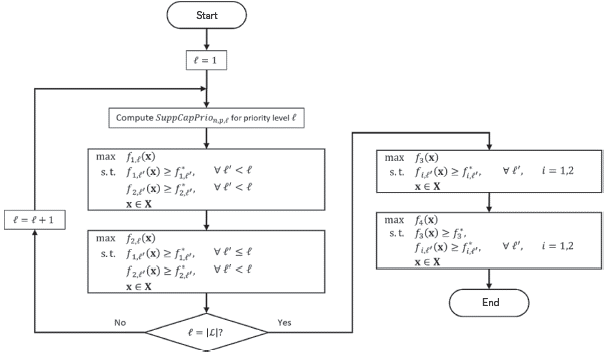
In the loop responsible for solving supply contract allocations, the production capacity for each level ℓ is calculated as the difference between the total field capacity (SuppCap n ), the third-party production (ProdTP n,p’,z,m ), and the allocations made for the previous levels ℓ'<ℓ (xSuppContopt n,p,z,m):
The proposed model is formulated as a optimization problem solved with the lexicographic method to guarantee the allocation priorities stipulated by the Colombian government and avoid infeasible solutions. The solution procedure considers the following:
The planners assume that customers will nominate/request an amount of gas equal to the quantity specified in the customer's contract (Qcont n,p,z,m ), but the allocations to the supply contracts (xSuppCont n,p,z,m ) will be limited by: the production capacity of the supply node (SuppCap n ), the demand at the consumption nodes (DemTP nm ), and the transport capacity (TranCap n,n' ), as established by Eqs. 1-3 and 7-13. Considering the previous, the solution procedure proposes the maximization of f 1ℓ (Eq. 27) so that the model finds the maximum amount of gas that can be allocated to supply contracts considering contractual, production, demand, and transportation constraints. Since the supply contracts have the higher priority of allocation, the first objective to be maximized is the total amount of gas that will be allocated to the supply contracts, i.e., max f 1ℓ. Note that, in an ideal case, the maximization of 1ℓ' will make xSuppCont n,p,z,m equal to Qcont n,p,z,m . However, if there are constraints that do not make it possible to guarantee the equality, then the model will find a feasible solution that assures the maximum possible allocation to customers with supply contracts.
After maximizing the allocations to supply contracts, the profit from those allocations is maximized, i.e., maxf 2ℓ (Eq. 28). This is done because the previous maximization (maxf 1ℓ) is performed to guarantee the logistics constraints in the planning process, but even so, the modeled company wants to improve its economy with a feasible solution.
Then, the planners want a feasible solution fully meeting the demand of internal consumptions (DemSC c ), but the allocations to self-consumption (xSelfCons n,p,c ) will be limited by: the production capacity of the supply node (SuppCap n ), the network transport capacity (TranCap n,n' ), and the contracted transport capacity (CapContTrans k,n,n' ), as established by Eqs. 1-13, and 15-17. Therefore, the solution procedure proposes the maximization of f 3,ℓ (Eq. 29) so that the model finds the maximum amount of gas that can be allocated to internal consumptions considering production, demand, and transportation constraints. Consequently, the third objective to be maximized is the total amount of gas that will be allocated to internal consumptions, i.e., max f 3,ℓ . Note that, in an ideal case, maximization will make xTotAllSC c equal to DemSC c . However, if there are constraints that do not make it possible to guarantee the equality, then the model will find a feasible solution that assures the maximum possible allocation to internal consumptions of the company.
Finally, after all the allocations were maximized, the profit of the company is optimized, i.e., maxf 4 (Eq. 30). Note that if there is still natural gas available in the final step of the solution procedure and there are unmet demands from third-party customers, then incremental sales (xIncrSale p,n,m,z ) can be made to improve the company's profit.
It is possible that the proposed solution procedure may not lead to the global optimum, but it is a strategy to obtain good feasible solutions to the planning problem that meet the following characteristics: (i) the solutions satisfy the priorities stipulated by the Colombian government (e.g., changes in priorities established when shortage scenarios occur), (ii) the solutions satisfy the business needs of the company (including supply contracts with third-party customers and allocations to the company self-consumptions), and (iii) the priority levels are easily configurable by the user via the set ML without the need for tuning parameters or penalties to solve the problem. All these characteristics makes the model useful as a support tool for decision-making for the planners at the company.
Another approach to solving the model could be to add penalties for the failure of delivery of the supply contracts to an objective function that only considers profit maximization. This option may be simpler from a mathematical formulation point of view; however, we have tested the model with that kind of formulation, and it does not completely satisfy the company's needs:
The company's supply contracts have penalty clauses for the failure to deliver the contracted amount, but these penalties do not exactly match the priority levels showed in Figure 2.
Penalties could be adjusted to obtain a solution that meets the prioritization needs, but this tuning process is not straightforward and would need to be done every time the priority levels change (sometimes, they change drastically when shortage scenarios occur).
The mentioned difficulties do not make the formulation of the model through penalties impossible, but the company's planners would need a lot of time to fine-tune the penalties and typically they evaluate several periods and scenarios on the same planning exercise, making the exercise time-consuming. For this reason, the lexicographic method embedded in the formulated tool works easily and meets the expected requirements.
6. CASE STUDIES
The model was applied and evaluated with data from the Colombian natural gas supply chain, as shown in Figure 4. The main considerations common to all the case studies are summarized below:
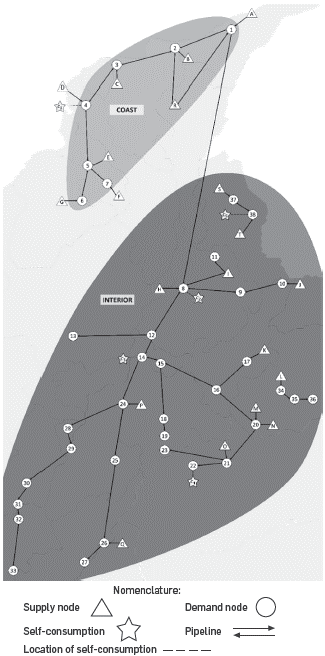
19 supply nodes:
8 natural gas production fields exclusively owned by the modeled company (I, J, L, M, N, O, Q, and S).
8 fields exclusively owned by third-party producers (B, C, E, F, G, H, K, and R).
2 fields owned by the company and a third-party producer (A and P).
1 liquefied natural gas regasification plant owned by a third party (D).
38 demand nodes distributed in 2 zones (Coast and Interior) and 35 gas pipeline sections that interconnect them.
8 markets for the demand of natural gas: Commercial, Compressed Natural Gas (CNG) for natural gas vehicles, Industrial, Petrochemical, Refineries, Residential, Power Generation (also known as Thermal market), and NTS compressor stations (also known as Transport market).
5 company internal consumptions:
A base case representing a standard month of system operation is considered, and variations in transportation constraints and prioritization levels are made to show the usefulness of the formulated model as a decision-support tool.
7. RESULTS AND ANALYSES
The optimization problems proposed for the case studies were formulated using GAMS 25.1.2 and were solved using BARON 18.5.8 with IPOPT as an NLP sub-solver.
BASE CASE
The base case considers the following priority levels to meet the demand: 1 Transportation market, 2 Residential and Commercial markets, 3 CNG markets, 4 Industrial, Petrochemical, and Refinery markets, and 5 Thermal markets. Table 1 shows the computational performance of the Base Case for each of the resolution steps described in the solution procedure. For the study cases evaluated in the present work, it is considered that a tolerance of 10% for the solver BARON is sufficient since it is what is requested by the company's planners.
Table 1 Computational performance and problem size of the Base Case.
| Priority level ℓ | Objective function | GAP* | CPU (s) |
|---|---|---|---|
| 1 | max f 1 | 0.01 | 0.41 |
| max f 2 | 8.49 x 10⁻¹² | 3.78 | |
| 2 | max f 1 | 4.02 x 10⁻¹³ | 0.47 |
| max f 2 | 0.10 | 2.92 | |
| 3 | max f 1 | 3.61 x 10⁻¹¹ | 0.39 |
| max f 2 | 0.10 | 2.78 | |
| 4 | max f 1 | 6.29 x 10⁻¹³ | 0.39 |
| max f 2 | 1.28 x 10⁻¹² | 3.64 | |
| 5 | max f 1 | 4.07 x 10⁻¹² | 0.41 |
| max f 2 | 0.10 | 2.83 | |
| NA | max f 3 | 0.09 | 1.52 |
| max f 4 | 0.10 | 6.58 | |
| Total CPU (s) | 26.11 | ||
| No. of equations | 1253 | ||
| No. of variables | 1945 | ||
DEMAND RESULTS
Figure 5 shows the distribution of the natural gas demand markets used in the base case for the coastal region, with a representative demand projection for Colombia, where most of the demand corresponds to the thermal market. Coastal demand was fully met, and the demand was met mostly by third parties (the company only met 14% of the base case refinery demand), as field "A" is the only company field that can serve the Coastal zone.
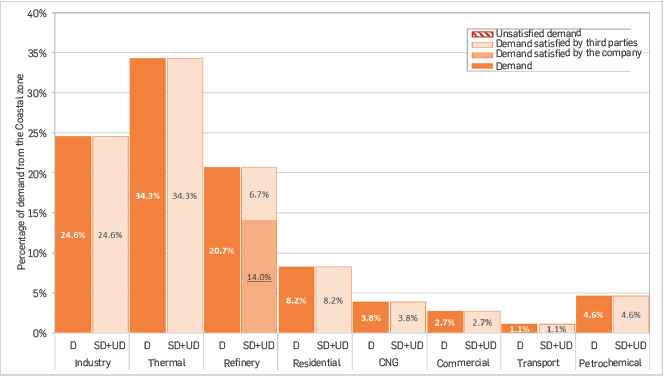
Figure 5 Attention to demand in the coastal zone for the base case: demand (D), satisfied demand (SD), and unsatisfied demand (UD).
Figure 6 shows the distribution of demand markets for the Interior region, where the industrial market represents most of the demand. Unlike the Coastal zone, the results of the Interior zone are characterized by the following: (1) the demand was mostly met by the modeled company and (2) there are unmet demands for the CNG and Residential markets.
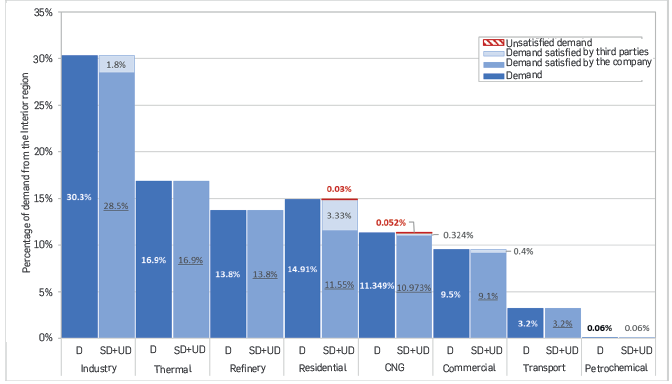
Figure 6 Attention to demand in the Interior zone for the base case: demand (D), satisfied demand (SD), and unsatisfied demand (UD).
The results of the model on the total demand service in the system enable the planning user of the model to estimate how much will be the level of natural gas service of the company and, thus, to analyze its situation within the total context of the natural gas market. In addition, a planning user can also use the model results to identify potential business opportunities. For example, the base case results indicate that 4.67% of the Interior demand can be met by incremental sales. In other words, the model identifies natural gas demands that will not be met by the company's supply contracts and neither by third-party producers and, therefore, the user can make the decisions that best benefit the company with this information.
TRANSPORT RESULTS
The unattended demand in the Interior zone refers to the demand of node 33. To analyze these results, one can turn to the gas transport results provided by the model, such as those shown in Table 2. When analyzing the system configuration in Figure 4, it may be observed that the only pipeline segment reaching node 33 comes from node 32, i.e. all the demand from node 34 should be able to arrive through the segment (32-33). Nevertheless, Table 2 shows that the segment is at 100% of its capacity and, therefore, there is unsatisfied demand for node 33. This example proves that the model's transportation results provide relevant information to planners, which enables them to analyze demand service outcomes.
Table 2 Gas pipeline segments with high utilization capacity.
| Segment | Máximum Capacity (MCFD) | Utilization rate (%) |
|---|---|---|
| 32 - 33 | 3.68 | 100.0% |
| 15 - 14 | 260.239 | 94.7% |
| 6 - 5 | 165.936 | 94.2% |
| 20 - 16 | 458 | 84.5% |
As shown in Table 2, section (32-33) was not the only pipeline with a high utilization rate; these types of model results enable the planners to analyze their operations.
INTERNAL CONSUMPTIONS
Table 2 shows that all internal consumption was able to meet all its demands and, therefore, in the base case there are no transportation constraints that affect the satisfaction of the internal consumption demand. It is evident that "c1" was the only internal consumption that used gas from third-party fields (31.85% of its demand was met by the third-party field "E", and 0.37% was met by the regasification plant "D"). It could be argued that "c1" needs to meet its demand through third-party gas, as the only company field that can meet it is "A". However, "A" serves a substantial portion of "c2"s demand (approximately 46%) and cannot give more gas to "c1". Then, the optimization results are based on giving "c1" as much as possible from "A" (approximately 67% of its demand), and then completing the remaining demand with gas from "E" and "D". This optimizes the strategy from an economic perspective because the model minimizes gas purchase costs from third parties to maximize the company's profit margin. This type of results provided by the model on internal consumption is a useful piece of information for planners to make decisions and compare different options available for the supply of self-consumption.
Table 3 Supply of internal consumptions for the base case.
| Internal Consumption | Field | Percentage of demand of the served internal consumption | Percentage of internal consumption unattended demand (%) | |
|---|---|---|---|---|
| Company | Third Parties | |||
| cl | A | 67.78% | - | - |
| D | - | 0.37% | - | |
| E | - | 31.85% | - | |
| c2 | A | 46.2% | - | - |
| J | 18.4% | - | - | |
| M | 35.4% | - | - | |
| c3 | M | 100.0% | - | - |
| c4 | N | 84.95% | - | - |
| O | 15.05% | - | - | |
| c5 | S | 100.0% | - | - |
ECONOMIC RESULTS
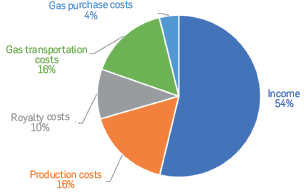
Figure 7 shows the distribution of the company's revenues and expenses for the base case. It should be mentioned that only purchases made from third-party fields are considered expenses, and allocations made by company fields are not considered expenses. This is because gas allocations to internal consumption served from the company's fields do not generate cash flow, as the revenues received by the fields are equal to the expenses paid for self-consumption, and, therefore, the terms are canceled within the calculation of the profit margin.
CASE 1: DECREASE IN TRANSPORT CAPACITY
In this case, the transport capacity of the segment (15-14) decreased by 50%. Case 1 has a computational performance similar to the Base Case since the size of the problem does not change; the total CPU time of Case 1 was 33.8s. This case represents a potential eventuality that could occur in the transport system in the event of unforeseen events or the maintenance of the gas pipeline segment. As was to be expected, the results of Case 1 point out that the segment (15-14) works at its maximum capacity. Table 4 shows a comparison of the unsatisfied demand of the base case and that of Case 1. The Interior demand is affected, as the central location of the segment (15-14) makes it an important gas line for the supply of gas in the Interior region. The Thermal market is the one affected the most, considering that it changes from meeting its demand in full in the base case to attending slightly over half of the demand in Case 1. Internal consumptions are also affected by the decrease in the transport capacity of the segment (15-14). Table 4 shows a comparison of the internal consumption allocations between the results of the base case and Case 1. All internal consumptions manage to fully meet their demand in Case 1, and not all self-consumptions are affected by the decrease in transport capacity. For example, the "c3", "c4" and "c5" consumptions do not vary their sourcing strategy. However, "c1" and "c2" do have variations in their gas purchases: "c1" makes more gas purchases from third parties in Case 1 than in the base case, and "c2" does not make purchases from third parties but does adjust its gas allocations from the company's fields.
Table 4 Comparison of the percentage of unsatisfied demands of the base case and Case 1.
| Zone | Market | Percentage of unsatisfied demand (%) | |
|---|---|---|---|
| Base Case | Case 1 | ||
| Interior | Commercial | - | 5.8% |
| Interior | CNG | 0.5% | 13.6% |
| Interior | Refinery | - | |
| Interior | Industrial | - | 6% |
| Interior | Residential | 0.2% | 10% |
| Interior | Thermal | - | 47.7% |
| Interior | Transport | - | 1.1% |
| Interior | Petrochemical | - | |
| Coast | Commercial | - | |
| Coast | CNG | - | |
| Coast | Refinery | - | |
| Coast | Industrial | - | |
| Coast | Residential | - | |
| Coast | Thermal | - | |
| Coast | Transport | - | |
| Coast | Petrochemical | - | |
The decrease in the transport capacity of the segment (15-14) implies that the fields "M" and "N" cannot evacuate all their gas and, therefore, unsatisfied demands are generated in the Interior (see Table 4). Bearing this in mind, the model makes the "J" field allocate all its production to gas sales to the Interior with two objectives: (1) compensate for the zone's demand attention, and (2) replace the sales previously made by "M" and "N" to reduce the impact on the company's gas sales revenues. This change in the production of "J" means that it can no longer allocate gas to consumption c2 (as it did in the base case). Thus, field "A" allocates to "c2" the same amount of gas that was allocated to it in the base case, plus that assigned to it by field "J"; then "A" must decrease the amount of gas allocated to "c1". Consequently, c2 must obtain more natural gas from third parties, and it does so by purchasing more gas from regasification plant D.
Table 5 Comparison of gas allocations to the internal consumption demand between the Base case and Case 1.
| Internal Consumption | Field | Percentage of demand of the served internal consumption | |||
|---|---|---|---|---|---|
| Company | Third Parties | ||||
| Base Case | Case 1 | Base Case | Case 1 | ||
| c1 | A | 67.78% | 44.05% | - | |
| D | - | 0.37% | 24.10% | ||
| E | - | 31.85% | |||
| c2 | A | 46.23% | 64.63% | - | |
| J | 18.40% | - | - | ||
| M | 35.37% | - | |||
| c3 | M | 100% | - | ||
| c4 | N | 84.95% | - | ||
| O | 15.05% | - | |||
| c5 | S | 100% | - | ||
The results of Case 1 shows that the model can adapt to diverse types of constraints that affect the system subjected to the study. This is useful for planning users, as it allows them to easily assess the impact of scheduled events (e.g., gas plant maintenance, compressor station maintenance, seasonal demand variation), or unforeseeable events.
CASE 2: CHANGE IN PRIORITIZATION LEVELS
Case 2 contains the same input data as Case 1, but the order of priority of demand attention is adjusted to give greater importance to the thermal market, as this was the one most affected by the decrease in transport capacity in Case 1. The priority levels of Case 2 are:
Thermal market and transport
Residential and commercial markets
CNG market
Industry, petrochemical markets, and refineries
Case 2 has computational performance similar to the Base Case since the size of the problem does not change; the total CPU time of Case 2 was 34.2s. Table 6 shows a comparison between the unsatisfied demand of Case 1 and that of Case 2. The model applied the priority levels established for Case 2 and succeeded in reducing the interior thermal demand deficit from 47% to 15%. Similarly, it may be noted that the industrial market is now the most affected by the reduction in transport capacity in the 15-14 segment, from 6% in Case 1 to 30% in Case 2. Specifically, the nodes that have unsatisfied demand for Case 2 are 8, 12 to 14, 24 to 29, 31, and 33, which is consistent considering that these nodes are directly connected to nodes 15 and 14.
Table 6 Comparison of the percentage of unsatisfied demands of Cases 1 and 2.
| Zone | Market | Percentage of unsatisfied demand (%) | |
|---|---|---|---|
| Case 1 | Case 2 | ||
| Interior | Commercial | 5.8% | - |
| Interior | CNG | 13.6% | 7.9% |
| Interior | Refinery | - | |
| Interior | Industrial | 6.0% | 30.9% |
| Interior | Residential | 10.0% | 3.1% |
| Interior | Thermal | 47.7% | 15.7% |
| Interior | Transport | 1.1% | 2.6% |
| Interior | Petrochemical | - | |
| Coast | Commercial | - | |
| Coast | CNG | - | |
| Coast | Refinery | - | |
| Coast | Industrial | - | |
| Coast | Residential | - | |
| Coast | Thermal | - | |
| Coast | Transport | - | |
| Coast | Petrochemical | - | |
The results of Case 2 show the flexibility of the model to configure prioritization levels, as it allows easily configuring any desired prioritization by markets.
CONCLUSIONS AND FUTURE WORK
This paper presented a NLP ministerio de minas model that can be used as a tool for planning the operations of a natural gas trading company. The optimization problem was solved by applying an algorithm based on the lexicographic method (i.e., the existing hierarchy between the different objective functions) and the priority levels imposed on the order of attention of the demand. As a result of the foregoing, a planning strategy is achieved, which maximizes the profit margin of the company and the fulfillment of prioritization. In addition, the model can be used to analyze the economic impact on the company's earnings concerning the negotiation of new supply or transportation contracts. The utilization of the lexicographic method ensures a feasible solution regardless of the logistics constraints existing in the network, as this is one of the main features required by the planners.
The model was successfully evaluated in several case studies that proved its usefulness as a decision-support tool. First, the results of one base case were analyzed with representative data from the natural gas market in Colombia. Later, variations of the base case were analyzed, which allowed us to visualize the functionalities of the proposed model. Moreover, the mathematical formulation of the model developed is quite flexible as regards the user needs. For example, it is possible to easily modify the priorities to study various eventualities as necessary for planning purposes. In the same way, the sets of nodes, producers, markets, and zones can be easily adapted to new topologies and case studies. In the future, it is possible to implement heuristic methods for the solution of the model and for comparing those strategies with the algorithm presented in this paper. Similarly, the expansion of the model is proposed as future work concerning: (1) the formulation of the model as a multi-period planning tool to consider how inventory options could change the decisions of the company and its impact on the computational performance, (2) the inclusion of uncertainty in the model parameters such as demand and third-party production, (3) the integration with other models that represent the commercialization of liquefied natural gas, or other types of hydrocarbons marketed by the company, or (4) the optimization of strategies with environmental criteria.