


 Inglés (pdf)
 Articulo en XML
 Referencias del artículo
 Enviar articulo por email
 Citado por SciELO
  Citado por Google
  Similares en
SciELO
Similares en
SciELO  Similares en Google
 Permalink
Introduction
Aqueous resources pollution is an issue of current special concern. A number of pollutants can be found in water, including polycyclic aromatic hydrocarbons (PAHs) (Tian et al. 2012; Rubio eta/., 2013; Rubio-Clemente et al. 2014a, 2015). These compounds constitute a group of organic pollutants formed of two or more fused benzene rings containing mainly carbon and hydrogen (Rubio-Clemente et al. 2014b; Dos Santos et al. 2018). PAHs are ubiquitous compounds in the environment (Alves et al. 2017; Segura et al. 2017). They come from anthropogenic sources, such as fossil fuel combustion, metal smelting processes and food smoking, among other human activities; and can be found in the atmosphere, soil, water and even in living beings because of their bioaccumulative properties throughout the food chain (Chizhova et al. 2013; Menezes et al. 2013; Santos et al. 2017).
The main concern related to the presence of PAHs in the environment is ascribed to their toxic potential, such as anthracene (AN), which has exhibited a high acute phototoxicity, and carcinogenic, mutagenic and teratogenic characteristics, like benzo[a]pyrene (BaP) (Rubio-Clemente et al. 2014b). In this regard, these compounds are subjected to be monitored by national and international regulations (Directive 2013; Ribeiro et al. 2015); therefore, the adoption of an analytical method aiming at their determination is required (Rubio-Clemente etal. 2017).
Due to their hydrophobicity, PAHs are poorly soluble in water, being present at ultra-trace levels in the range of ng/L or μg/L; fact that limits PAH identification and quantification in aqueous matrices (Rubio-Clemente et al. 2017). Recently, several analytical techniques have been reported (Nawaz et al. 2014; Petridis et al. 2014; Ahmadvand et al. 2015; Khodaee et al. 2016). However, they use previous separation and pre-concentration procedures, being PAH analysis a tedious process. Additionally, separation and pre-concentration techniques might contaminate the sample to be analyzed and produce loses of analytes; especially when multistep procedures are performed (Buczymka et al. 2014; Anumol etal. 2015; Boix etal. 2015). Consequently, large-volume injection techniques are proposed to be used as alternative procedures (Boix et al. 2015). Sample large-volume injection techniques can also be used with reversed-phase high-performance liquid chromatography (RP-HPLC) and gas chromatography (GC), and be combined with fluorescence detector (FLD) or diode array detector, and even with mass spectrometry, finding out accurate and repeatable results within a short period of analysis, without incurring high costs, neither the contamination of the sample nor the loss of the target analytes.
On the other hand, during the development of new analytical methods, one-factor-at-a-time techniques are commonly used. However, the evaluation of several factors influencing the chromatographic system by analyzing the effect of one single parameter at a time can be an expensive task, and valuable information about the analyzed factors can be missed (Trably et al. 2004; Hanrahan & Lu 2006, Andrade-Eiroa et al. 2010; Rubio-Clemente etal. 2017). In this regard, multivariate statistical approaches can overcome these drawbacks by using principal component analysis (PCA) and design of experiments (DOE). PCA is a multivariate analytical tool that can be used to reduce a set of original variables and to extract a small number of latent factors, also called principal components (PCs), which allow the analysis of the relationships among the observed variables (Machala et al. 2001; Golobocanin et al. 2004). In turn, DOE can be used to determine the most influential factors within the considered experimental system (Ferreira et al. 2007; Dejaegher & Vander 2009, 2011).
Under this scenario, this work is focused on analyzing AN and BaP chromatographic behavior in order to optimize the system for the simultaneous analysis of the analytes of interest at ultra-trace levels in aqueous samples by means of RP-HPLC coupled with FLD and using PCA and DOE under different experimental conditions. In addition, the validation of the optimized experimental chromatographic conditions was carried out using different natural water matrices.
Materials and methods
Reagents and solutions
Anthracene (AN, 99%) and benzo[a]pyrene (BaP, 98 %) analytical certified standards from Dr. Ehrenstorfer (Ausgburg, Germany) and gradient-grade acetonitrile purchased from Merck (Darmstadt, Germany) were used without further purification. Deionized water with a resistivity of 18.2 MQ and obtained from a Millipore purification system (Bedford, USA) was also employed.
Stock standard solutions of AN and BaP were prepared in acetonitrile at a concentration of 1000 mg/L. The working solutions used during the PCA and DOE were prepared by spiking deionized water with a small aliquot of AN and BaP for obtaining a final concentration of 20 [dg/L and 2 [dg/L, respectively.
The calibration curves were built within a range of 75 - 3000 ng/L for AN and of 30 - 3000 ng/L for BaP, using diluted standard solutions and 10 % of acetonitrile (v/v) so that the target PAH adsorption on the walls of the vials is prevented (Martinez et al. 2004).
Analytical methods
AN and BaP were identified and quantified in aqueous samples with an Agilent HPLC system series 1100/1200 (Palo Alto, USA) equipped with a G1322a vacuum degasser unit, a G1311a quaternary pump, a G1321a multiwavelength fluorescence detector, a G1316a column oven, and a G1329a autosampler. The column was a 5 μm Kinetex core-shell technology C18 (150 x 4.6 mm i.d.) from Phenomenex (Torrance, USA). Unless otherwise mentioned, elution was carried out under isocratic conditions using a mobile phase composed of acetonitrile and deionized water (90:10, v/v), a flow rate of 1 mL/min, a column temperature of 35 °C, a sample injection volume of 100 μL, an emission wavelength of 416 nm and excitation wavelengths of 254 nm from 0 to 3.20 min and 267 nm from 3.21 to 5 min. OpenLab CDS Chemstation software (Agilent, Palo Alto, USA) was used for chromatographic data analysis.
Statistical analysis
PCA was used to examine the behavior of AN and BaP within the chromatographic system under several experimental conditions. The objective of PCA consists of building k lineal combinations (Yk) of the considered (Xp) variables containing the major variability, being a the associated coefficients. The lineal combinations can be expressed as Eq. 1-3.
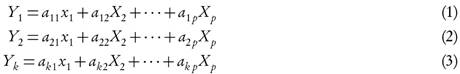
The first PC (Y1) refers to the lineal combination of the response variables with the maximal variability. The second PC (Y2) is the lineal combination with the second major variability that is not correlated with the first PC. The variability grouped by the following PC (Yk) is decreased up to a non-statistical significant variability.
Additionally, a fractional factorial DOE was employed to find the optimal operating conditions that allow for the simultaneous identification and quantification of the target analytes.
Statgraphics Centurion XVII (Statpoint, Warrenton, USA) was used for the statistical treatment of the experimental data.
Results and discussion
Chromatographic behavior using principal component analysis
Taking into account the different factors that influence the separation of compounds in a chromatographic system for an accurate identification and quantification, the strength of the mobile phase, which was evaluated in terms of acetonitrile percentage, was selected to be analyzed. The injection volume is another parameter to be considered, particularly when determining compounds in the range of ng/L, as it is the case, since the injection of large volumes of samples may derive in the increase of the number of molecules and, therefore, in the increase of the detector analytical response. The excitation and emission wavelengths also play a main role in the quantification of compounds that exhibit an excitation and relaxation behavior under ultraviolet radiation, such as PAHs. Consequently, these two factors were also taken into consideration. Moreover, the flow rate of the mobile phase and the temperature of the column were demonstrated to influence the chromatographic system; that is, the determination of analytes due to the correlation between their elution and the pressure of the system. Thus, six factors affecting the chromatographic system were initially considered, and varied within different operational ranges. In Table 1 the factors and ranges used are listed. These ranges were selected according to different investigations (Bourdat-Deschamps etal. 2007; Lucio-Gutierrez etal. 2008; Andrade-Eiroa et al. 2010), the chromatographic expertise of the authors and previous experimental runs.
Among the different responses to be measured related to the identification and quantification of organic compounds, the retention time of AN and BaP, as well as the resolution between these two compounds, were selected for identification purposes. Since identification is not enough, in terms of regulation accomplishment, the counts of area and height of AN and BaP were also considered for quantification purposes. In order to find out the optimal experimental conditions for AN and BaP analysis in water at ultra-trace concentrations, PCA was firstly conducted to correlate the different responses selected and, therefore, to obtain those models describing the chromatographic behavior of AN and BaP. However, it is highlighted that prior to any further statistical analysis, normality of the response variables was checked. All the measured variables were verified to follow a normal distribution by using Kolmogorov-Smirnov test, with the exception of AN area and AN height. Consequently, these variables were treated and log transformations of AN area and AN height were obtained for assuring normality assumption.
Subsequently, the response variables were subjected to PCA. It was found that the first three PCs explained more than 97 % of the total variability among the seven considered response variables. These results were confirmed by the scree plot represented in Fig. 1, The scree plot displays the number of principal components versus their corresponding eigenvalues. This kind of plot indicates in a graphical way the number of PCs to be retained based on the size of their eigenvalues. The ideal pattern is a steep curve that is gradually smoothed up to a straight line, as represented by the blue line in the figure.
Figure 1 Scree plot of the considered responses. Operating conditions: [anthracene] 0 = 20 μg/L; [benzo[a]pyrene] 0 = 2 μg/L; injection volume = 50-100 μL; strength of the mobile phase= 70-90 %; excitation wavelength = 230-280 nm; emission wavelength = 408-424 nm; flow rate = 1-1.5 mL/min; column temperature= 25-35 °C.
The number of principal components suggested to be selected corresponds to those components with eigenvalues higher than 1; that is, the components that remain above the horizontal red line. In Table 2, the estimated values of the coefficients for each extracted principal component are shown.
From Table 2, it can be observed that the coefficients having the main weights (weight > 0.5) in PC 1 are the retention times of AN and BaP, and the resolution between AN and BaP; that is, all the response variables related to the elution of the target analytes. In this regard, PC 1 can be representative of the identification index of AN and BaP. Concerning PC 2, the main coefficients are the log area of AN and the log height of AN. In turn, for PC 3, the coefficients representing the area and height of BaP are the highest ones. Therefore, PC 2 and PC 3 might be indicative of the behavior of AN and BaP, respectively, in terms of the peak area and height; that is, PC 2 and PC 3 represent the quantification index of AN and BaP, respectively. PCA tool has also been used for developing retention models in liquid chromatography and standard fingerprints, among other uses (Nikitas et al. 2012; Qi et al. 2017).
Optimization using design of experiments
Once the identification and quantification of AN and BaP were described by these indeces, corresponding to PC 1, PC 2 and PC 3, the factors statistically significant for each component were examined and the experimental conditions were optimized by using DOE; particularly, a fractional factorial design due to the high number of factors considered initially. A total of 16 runs plus 5 central points were executed within the selected operating ranges, and analysis of variance (ANOVA) test was performed for each chromatographic index. For a confidence interval of 95 %, it was observed that the block effect was not significant for the chromatographic system under the tested experimental conditions. Concerning PC 1, representing the identification index of AN and BaP, it was evidenced to be influenced negatively by the flow rate and the strength, in terms of acetonitrile content of the mobile phase. This means that as the flow rate is increased, the analytes elute faster and the resolution is, subsequently, decreased. This inversely proportional linear relationship between resolution and flow rate was also observed by Andrade-Eiroa et al. (2010) while optimizing the separation of the pairs dibenzo[a,h]anthracene-benzo[g, h, i]perylene and benzo[g, h, i]perylene-indeno[1, 2, 3-cd]pyrene. Similar reasoning can be withdrawn when considering the percentage of organic solvent in the mobile phase. An increase of the mobile phase strength leads to AN and BaP are eluted more rapidly, decreasing their retention times by the stationary phase of the chromatographic column, which results in a decrease of resolution between these two organic compounds. From these two factors, the flow rate was found to exert a higher influence in the identification index of both pollutants, since it has a coefficient associated of -2.1767 in comparison with the coefficient linked to the acetonitrile percentage (-0.1774) of the mobile phase.
With respect to PC 2, representing AN quantification index, the excitation wavelength was observed to develop a major role in AN area and height with a weight of -0.0542. This fact indicates that a decrease of the excitation wavelength results in an increase of the index describing AN quantification and, therefore, an increase of the log area and of the log height of AN. Thus, AN area is increased as well as AN height, improving AN signal detected by the FLD.
Finally, concerning PC 3, it was found that it is statistically affected by the injection volume by a weight of 0.0286. Thus, when the injection volume is increased, the amount of BaP molecules eluting is correspondingly increased with the subsequent augmentation of the area and height of BaP chromatographic peak. Additionally, for a significant level equal to 0.05, the flow rate and the excitation wavelength exerted a negative (-2.1898) and positive (0.0190) influence, respectively. On the one hand, an increase of the flow rate of the mobile phase leads to a decrease of the area of BaP peak. This can be explained from the fastest elution of the analyte molecules, reducing BaP band and, therefore, decreasing the dimensions of BaP peak. On the other hand, an increase of the excitation wavelength results in an increase of the area and height of BaP. It must be noted that, despite the non-statistically significance of the excitation wavelength for a = 0.05, it was considered in the BaP quantification index because its p-value was close to 0.05 (p-value = 0.0772).
In Fig. 2, the described magnitudes and signs of the selected factors, both the statistically and non-statistically significant ones, for the three PCs are represented through the main effect plots.
Figure 2 Main effect plots for the identification index ( a), anthracene quantification index (b) and benzo[a]pyrene quantification index (c). Operating conditions: [anthracene] 0 = 20 μg/L; [benzo[a]pyrene] 0 = 2 μg/L; injection volume = 50-100 μL; strength of the mobile phase = 70-90 %; excitation wavelength = 230-280 nm; emission wavelength = 408-424 nm; flow rate = 1-1.5 mL/min; column temperature = 25-35 °C.
The models built describing the three chromatographic indeces representing the chromatographic behavior of AN and BaP under the experimental conditions tested with p-values lower than 0.05, corresponding to 0.0000, 0.0000 and 0.0085, respectively, are described by Eq. 4-6.

where I i is the AN and BaP identification index, I ii is the AN quantification index and I iii is the BaP quantification index. In turn, FR, S, EW and IV represent the flow rate, strength of the mobile phase, excitation wavelength and the injection volume of the sample, respectively.
By optimizing all the principal components obtained simultaneously using multicriteria decision approach, the optimal chromatographic conditions with a desirability of 83.52 % were 1.0 ml/min, 90%, 100 pL, 230 nm, 409 nm and 25 °C for the flow rate, acetonitrile content of the mobile phase, injection volume, excitation and emission wavelengths and the column temperature, respectively. However, it is worldwide known that the absorption and fluorescence emission capacities of a substance depend on the substance itself. Additionally, absorption and fluorescence properties of the particularly tested compounds do not follow a linear relationship with the wavelengths used, since their absorption molar coefficients and absorption spectra vary with the single excitation wavelength (Rubio-Clemente et al. 2017). For example, in the case of AN, the absorption coefficient at 254 nm is log ε 254 = 4.9 in ethanol. For BaP, it has a value of log s 254 = 4.6 in ethanol (Zsila et al. 2006; Jones, 1947). BaP absorption spectrum is characterized by several bands of varied intensity; a first one in the range between 245 and 305 nm, higher than 254 nm; and a second one from 320 to 410 nm (Thomas & Burgess, 2007). Moreover, AN absorption spectrum has a distinguished band around 254 nm (Thomas & Burgess, 2007). In this regard, the optimization procedure used in this work is limited when the studied system is influenced by the quadratic effects of the considered factors, as it is the case for these parameters.
Therefore, a minacious study was subsequently performed to find out the excitation and emission optimal wavelengths of AN and BaP. It was found that 416 nm was the optimal emission wavelength within the selected initial range for both of the examined analytes. The excitation wavelength was fixed at 254 nm and 267 nm during AN and BaP elution time, respectively.
On the other hand, taking into account that the column temperature was not statistically significant for the models built and considering that the analysis time can be reduced by augmenting the temperature of the column oven, reducing also the pressures in the system and improving the column efficiency, as reported by Andrade-Eiroa et al. (2010), the optimal column temperature was kept at 35 °C.
Validation
Under the optimized conditions, the proposed analytical method was validated. Good linearity values and low limits of quantification and detection of 75 and 5.54 ng/L for AN, and 30 and 4.26 ng/L for BaP were obtained. Additionally, intraday and interday precisions lower than 2 and 11%, respectively, were found for the high, medium and low levels tested. Accuracy was also verified and relative standard deviations (RSD) lower than 10 % were evidenced. Furthermore, the analysis of AN and BaP in different matrices of real natural water gave satisfactory recoveries (RSD < 13 %).
Conclusions
The results of the present study indicated that the chromatographic behavior of the selected PAHs under the experimental conditions tested may be explained by PCA using three indeces describing the elution of AN and BaP, the peak shape of AN and that of BaP, representing the former one and the latter ones the identification and the quantification of the target compounds, respectively. It was demonstrated that the identification index of the target compounds under the experimental domain studied here was defined by the flow rate and the strength of the mobile phase. Concerning the AN quantification index, the excitation wavelength was found to develop a main role. Finally, the BaP quantification index, as expected, was also influenced by the excitation wavelength; however, the injection volume and the flow rate were observed to exert also a main function.
The optimal operating conditions found using DOE that maximizing the indices referred above were 1 mL/min, 90 %, 35 °C, 100 ¡uL, and 416 nm for the flow rate, acetonitrile content of the mobile phase, column temperature, injection volume and the emission wavelength, respectively. The optimal excitation wavelengths were 254 nm and 267 nm for AN and BaP. The developed and validated method showed to be suitable for the identification and quantification of AN and BaP at ultra-trace levels in relatively clean natural water by direct injection in only 5 min of analysis.

