


 Inglés (pdf)
 Articulo en XML
 Referencias del artículo
 Enviar articulo por email
 Citado por SciELO
  Citado por Google
  Similares en
SciELO
Similares en
SciELO  Similares en Google
 Permalink
Introduction
Marine turtles (superfamily Chelonioidae) comprise seven existing species grouped into two families: Cheloniidae, including the flatback (Natator depressus), olive ridley (Lepidochelys olivacea), Kemp's ridley (Lepidochelys kempii), loggerhead (C. caretta), hawksbill (Eretmochelys imbricata), and green turtle (Chelonia mydas) species (Pritchard & Mortimer, 1999); and Dermochelyidae which currently comprises a single species, the leatherback sea turtle (Dermochelys coriacea).
The loggerhead turtle, Caretta caretta (Cc) is distributed around the oceans of the world in tropical and subtropical latitudes (Amorocho, 2003). Its main nesting locations have been reported in the coasts of the peninsula of Florida (FWC 2015), in the western Brazilian Atlantic Ocean, in the Eastern Mediterranean Sea, in the Omani Arabian Sea, in Madagascar, and in Japan (Dodd 1988, Lancheros & Hernández 2013, Hernández et al. 2017). Despite its wide global distribution, it is considered as an endangered species (IUCN 2016). Loggerhead populations are directly threatened by several anthropic activities including: fisheries bycatch, excessive fishing/hunting, and illegal trade of eggs and meat. In addition, Loggerhead turtle populations are affected by habitat deterioration, coastal development, pollution, pathogens and climate change (Eckert et al. 2000, Lancheros & Hernández, 2013, Machado & Bermejo, 2012). Loggerhead turtles reach their sexual maturity at around 20-30 years of age (Machado & Bermejo, 2012), which does not offset the rampant overall population decline of the species. The threat to Loggerhead turtles has been well documented the Colombian Caribbean (Amorocho, 2003, Ceballos-Fonseca, 2004), where the world's second highest number of catches per year (approximately 600 turtles) has been reported (Humber et al. 2014). This, despite existing national laws and international agreements to protect the species from anthropic threats (SWOT 2012, IUCN 2016).
In all vertebrate taxa, the mitochondrial genome (mitogenome) is arranged as a single, circular, and haploid DNA molecule that features a uniquely high mutation rate, is non-recombining, maternally inherited, and has a specific organization and expression mode (Avise, 1994). Stretches from the mitogenome constitute the most commonly used molecular markers for genetic analysis of loggerhead turtle populations (Drosopoulou et al. 2012, Duchene et al. 2012). The loggerhead turtle mitogenome contains 37 coding units including two ribosomal RNAs (rRNAs) genes, 22 transfer RNAs (tRNAs) genes, 13 protein-coding genes, and one non-coding region of approximately 1 100 bp called the D-Loop or control region. This D-Loop contains the origin of the H replication strand and signals for mitochondrial replication and transcription (Drosopoulou et al. 2012, Duchene et al. 2012, Chiari et al. 2012).
In sea turtles, as well as in other vertebrates, point mutations in tRNA genes are likely to alter the 3D structure and function of this machinery, hence compromising peptide synthesis and possibly leading to systemic lifespan-threatening conditions. Despite the key role of mitochondrial tRNAs, their study has almost exclusively been undertaken in humans (MITOMAP, 2018). But, the availability of large databases containing thousands of tRNA sequences from hundreds of complete genomes has promoted the development of the new field of “tRNAomics” (Marck & Grosjean, 2002). Furthermore, the understanding of sea turtle tRNA secondary and tertiary structures can benefit greatly from such structural biology resources (Popenda et al. 2012).
Mitochondrial D-Loop haplotypes have been useful in the identification of sea turtle individuals, nesting colonies, and their relationship with foraging areas. Studies have been carried out with mitochondrial haplotypes addressing important aspects of the phylogeography, phylopathy (natal homing), genetic structure, and maternal lineages of loggerhead turtles (Bowen et al. 1995, Bowen & Karl, 2007). The most thorough analyses of loggerhead turtle nesting colonies, based on D-Loop sequence data, have been carried out in Brazil (Reis et al. 2010), Southeastern United States (Francisco et al. 1999), the Atlantic-Mediterranean (Encalada et al. 1998), and the Pacific Ocean (FitzSimmons et al. 1996, Nobetsu et al. 2004 and Hatase et al. 2002).
Several studies have employed data from single mitochondrial regions (e.g. the Cytochrome b gene (Cytb), ND4 gene, and the D-Loop) to best explain the phylogeny of different animal taxa (Dutton et al. 1996, Scotto 2006, Adebambo 2009, Duchene et al. 2011). However, there is an ongoing debate whether single mitochondrial markers are ideal to trace phyologentic histories (Scotto, 2006). The entire mitogenome is becoming the marker of choice for phylogenetic reconstructions, since it provides better phylogenetic resolution and precision than single traditional markers (Duchene etal. 2011, Novelletoetal. 2016, Miyaetal. 2003, Kimetal. 2005, Jungetal. 2006, Parham etal. 2006, Drosopoulou etal. 2012). The reconstruction of the evolutionary history of the Cheloniidae has been performed via phylogenetic tree analyses based on genetic data from the entire mitogenome (Kim et al. 2005, Duchene etal. 2012, Drosopoulouetal. 2012).
In this study, the complete mitochondrial genome of a loggerhead turtle of the Colombian Atlantic Ocean (Cc-AO-C) was sequenced and analyzed with three purposes: (1) to compare the characteristics of mitochondrial genome with all previously reported mitogenomes of loggerhead individuals nesting in Hawaii, Pacific Ocean (Cc-PO-H); Peru, Pacific Ocean (Cc-PO-P); Greece, Mediterranean Sea (Cc-MS-G) and Florida, Atlantic Ocean (Cc-AO-F). (2) Assessing the mutations in the tRNAs genes and their possible implications in 2D and 3D structures, and (3) revisiting the phylogeny of the superfamily Chelonioidae using data from 13 protein-coding genes, the 16S rRNA gene, and the complete mitochondrial genome.
Materials and methods
Sampling, DNA extraction and quantification
A single blood sample was collected from a loggerhead turtle. This turtle was found at Don Diego beach (11° 16' N - 73°45' W) in the Colombian Caribbean. This turtle showed the morphological characteristics of the logger head species Suppl. 1, was in good health condition, and had no evident physical anomalies. The sample was obtained from the dorsal cervical sinus of the turtle according to Dutton's method (1996). The blood sample was taken in a test tube with Tris-EDTA buffer to avoid coagulation and transported at 4 °C to the Molecular Biology Laboratory at the Universidad Jorge Tadeo Lozano, in Bogotá.
Total genomic DNA was extracted by using the GF-1 Tissue DNA Extraction Kit (Vivantis, Subang Jaya, Malaysia) according to manufacturer's instructions. The amount of DNA extracted was measured with a Nanodrop 1000 and analyzed with the ND-1000 V3.7.1 program (Thermo Scientific, Waltham, USA).
Primer design
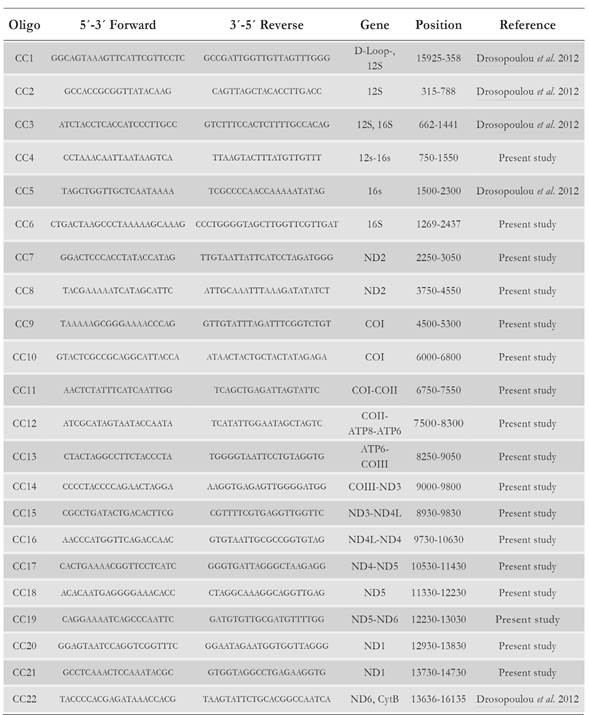
The sequencing strategy for the entire mitogenome was based on PCR amplification of overlapping fragments of 800 - 2 500 bp in length. The overlap among fragments was of 50 - 200 bp to facilitate full sequence assembly. A total of 22 primer pairs were employed to sequence the mitogenome of the Colombian Caribbean loggerhead turtle (Table 1). Seventeen primer pairs were designed using the Overlapping Primer Sets Program (Whitehead Institute, Cambridge, USA) based on the mitochondrial genome sequence of another loggerhead sea turtle (Cc-MS-G, GenBank accession number NC_016923.1). The remaining five primer pairs were used as previously described by Drosopoulou et al. (2012).
Table 1 Sequence, position and amplified genes of the loggerhead turtle Cc-AO-C mitogenome with primer pairs used as described in the text.
Different analyses were performed to identify chimeras between the mitochondrial genome and nuclear paralog sequences. First, the mitochondrial DNA was assembled with the reference genome of the loggerhead turtle (GenBank accession number NC_016923.1). Then, the mitogenome was aligned with mitogenomes of other four loggerhead turtles, and a phylogenetic tree was built using the complete mitogenome sequences of all six sea turtle species.
Complete mtDNA amplification and sequencing
PCR reactions were carried out to a final volume of 25 pl. Each PCR reaction included: 1X PCR buffer (160 mM (NH4)2 SO4, 67 mM Tris-HCl [pH 8.8 to 25 °C], 0.1 % Tween-20), (Bioline Inc., Oxnard, USA), 1.5-3.0 mM de MgCl2, 0.4-1.0 μM of each forward and reverse primer, 200 μM of each dNTP, 1U of Taq Polymerase and 60 ng of DNA (Bioline Inc., Oxnard, USA). The employed thermocycling program consisted of an initial denaturation step at 94◦ C for 5 min, followed by 35 cycles at 94 ◦C for 1 min, 30 ◦C - 50 ◦C (depending on each primer pair) for 1 min, 72 ◦ C for 1 min, and a final extension step at 72 ◦ C for 10 min. The PCR reaction was carried out in a block PTC-100TM Programmable Thermal Controller Thermocycler (MJ Research, Madison, USA). Complete standardization to this protocol was described by Beltran-Torres et al (2013).
The PCR-amplified electrophoretic bands were purified using the GF-1 Gel DNA Recovery kit (Vivantis Malaysia HQ). Purified material was used for double strand (5'-3' and 3'-5') sequencing reactions, using the automated tag DyeDeoxy Terminator Cycle-sequencing method in an ABI 3730XL sequencer (Applied Biosystems, Foster City, USA) at SSIGMOL, Universidad Nacional de Colombia, Bogotá, Colombia.
Mitogenome assembly
The 22 obtained sequences were aligned using ClustalW (Thompson et al. 1994) and assembled by means of the Geneious R6 program (Biomatters Ltd., Auckland, New Zealand) using the Cc-MS-G mitogenome as reference sequence (GenBank accession number NC_016923.1). To poceed with the assembly of the Cc-AO-C loggerhead sea turtle mtDNA reads to the reference sequence as FASTA files, the following options were used: File, import from file and finally Map to Reference. To determine the nucleotide composition of the assembled mitogenome, the “statistics” option was run. The Geneious Basic Local Alignment Search Tool (BLAST) (Altschul et al. 1990) was used to identify sequence similarities among the newly generated assembly and other loggerhead mitogenome assemblies previously mentioned. Functional annotation of the Cc-AO-C mitogenome assembly was made using BLASTX.
Genetic variation analysis
Standard diversity indices, such as number of haplotypes (k), number of polymorphic sites (S), haplotype diversity (H), average number of differences between pairs of sequences (n), and nucleotide diversity (n) according to Nei (1987) were estimated for each one of the thirteen mitochondrial protein coding genes from ad hoc sequence alignments of the Cc-AO-C turtle sequence (accession number KP256531.1) with sequences of other four loggerhead mitogenomes. These loggerhead mitogenomes were downloaded from the NCBI database and consisted of the Cc-AO-F (Florida-USA) (accession number JX454983), Cc-MS-G (Greece) (accession number NC_016923), Cc-PO-P (Peru) (accession number JX454988), Cc-PO-H (Hawaii) (accession number JX454977). All genetic variation estimators were obtained with DNAsp v5.10 (Librado & Rozas, 2009). A similar approach was also applied to the D-Loop region of the Cc-AO-C and the afore mentioned four loggerhead mitogenomes and a set of 92 loggerhead D-Loop haplotype stretches of the Archi Carr Center for Sea Turtle Research at the University of Florida (accstr.ufl.edu).
tRNA structure analysis
Prediction of tRNA 2D structures were done with ARWEN (http://mbio-serv2.mbioekol.lu.se/ARWEN/) (Laslett & Canback 2008) and 3D structures were predicted with the 3D RNA composer Program (Popenda et al. 2012) (http://rnacomposer.cs.put.poznan.pl/Home/Compose). All structures were visualized using Geneious R6 in pdb format. The 3D structure of the tRNAs of Cc-AO-C was compared to those described for the loggerhead turtles of Cc-AO-F, Cc-MS-G, Cc-PO-P and Cc-PO-H. These tRNA data were also used to perform intraspecific analyzes.
Phylogenetic analysis
Phylogenetic inferences were made for the superfamily Chelonioidae using data from individual genes and complete mitochondrial genomes. The inference was made with mitogenome sequence data from seven sea turtle species: C. mydas (Cm-AO) (accession number NC_000886.1), N. depressus (Nd-PO-A) (accession number NC_018550.1), E. imbricata (Ei-AO-C) (accession number KP2218061), C. caretta (Cc-MS-G) (accession number NC_016923), L. olivacea (Lo-PO-CR) (accession number NC_028634.1), L. kempi (Lk-AO-US) (accession number JX_454982.1), and the mitogenome described in this study. The mitochondrial genome of D. coriacea (Dc-AO-US) (accession number JX_454989.1) was used as an outgroup.
Phylogenetic analyses were performed using three approaches, Maximum Likelihood (ML), Bayesian Inference algorithms (BI), and Maximum Parsimony (MP). ML and BI analyses were made with Geneious R6 (Biomatters Ltd., Auckland, New Zealand) and MP with MEGA 5.2. (Tamura et al. 2011). The models of nucleotide substitution of Tamura-Nei (TN), Hasegawa, Kishino and Yano (HKY), and the Generalized Time Reversible (GTR) model were used in the construction of phylogenetic trees. These models were chosen based on the lowest scores of the Bayesian Information Criterion (BIC) implemented in MEGA 5.2. (Nei & Kumar 2000, Tamura et al. 2011). For ML-and MP-based phylogenetic analyses, 1 000 bootstrap replicates were performed to generate a good statistical support.
Mitochondrial genome of Caretta caretta
Bootstrap values above 70 % were accepted as strong enough support for the different branches, according to Hillis & Bull (1993). 10 000 iterations were performed for the BI analysis. A consensus tree, with posterior probability values expressed in percentages, was obtained.
Results and discussion
The Cc-AO-C mitogenome sequence
The complete mitogenome sequence (16 362 bp in length) of the loggerhead turtle individual Cc-AO-C was obtained and deposited in the GenBank under accession number KP256531.1. Upon analysis of this mitogenome sequence, we confirmed that the sampled turtle was indeed a member of the Caretta caretta species. Since hybrids between sea turtles have been frequently reported (Bowen & Karl, 2007; Drosopoulou et al. 2012; Duchene etal. 2012), it was necessary to ascertain that the captured mitogenome was indeed from the loggerhead species. In addition, attention was paid during primers design to avoid unintended amplification and sequencing of nuclear paralogs of some mitogenome genes. Moreover, obtained sequence reads were inspected for double peaks, as seen in diploid nuclear sequences, before mitogenome assembly.
As revealed by its base composition, the sampled mitogenome was A-rich (35%) and had alow content of G(12.2%), with intermediate C and T contents of 27 % and 25.7 %, respectively. The mitogenome of the Cc-AO-C turtle contains 13 protein-coding genes (ND1, ND2, ND3, ND4, ND4L, ND5, ND6, COI, COII, COIII, ATP6, ATP8, Cytb) two rRNA genes (12S and 16S), 22 tRNA genes and one non-coding control region (D-Loop).
Regarding protein-coding, rRNA, and tRNA genes, the obtained sequence of the Cc-AO-C mitogenome corresponded well to functional and codon usage annotations reported for other marine turtles (Kumazawa & Nishida 1999, Duchene et al. 2012, Drosopoulou et al. 2012) (Suppl. 1)
Sequence variation across mitogenome protein-coding genes and D-Loop
The degree of sequence identity for all genes and functional units of the obtained loggerhead mitogenome was assessed against each of the other four loggerhead mitogenome sequences. Across all protein-coding genes, the average pair-wise sequence conservation degree was 98.49% (Table 2).
Table 2 Identity percentages for all mitochondrial protein-coding genes between the Cc-AO-C and each mitogenome sequence of the four loggerhead mitogenomes: Cc-AO-F, Cc-MS-G, Cc-PO-P and Cc-PO-H.
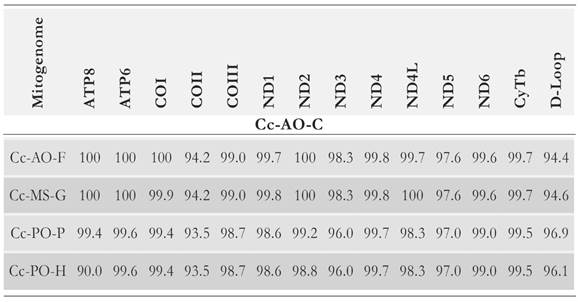
The lowest level of sequence similarity between the Cc-AO-C mitogenome and the set of four loggerhead turtle mitogenome sequences was observed at the COII gene (93-94 %); and across functional units, the Cc-AO-C mitogenome was most similar with the mitogenomes of the Cc-PO-F and Cc-PO-G turtles. Furthermore, it is interesting to see how the levels of genetic identity between the mitochondrial genes of Cc-AO-C and these Atlantic-Mediterranean turtles are higher than those between the mitochondrial genes of Cc-AO-C and the turtles of the Pacific Ocean. This observation can substantiate the possibility of genetic flow between Atlantic-Mediterranean turtles, which is further supported by various studies on their broad migratory routes and geographical range. For instance, Casale et al (2013)) provided the first evidence of a migratory connection of a loggerhead from the Mediterranean to North America. Besides, there is evidence that loggerhead turtles born on northwestern Atlantic beaches disperse as far as eastern Atlantic coasts, and some of them even enter the Mediterranean Sea (Bolten 2003) where they share foraging grounds with the Mediterranean population (Monzon-Arguello etal. 2010, Wallace et al. 2010, Carreras etal. 2011).
Sequence analysis of the ND3 gene of the Cc-AO-C mitogenome reveladed an A insertion at position 175. This programed frameshift mutation has only been seen before in the Cc-MS-G mitogenome (Drosopoulou et al. 2012), and it is a likely neutral variant since it does not lead to protein sequence changes. Moreover, the same mutation has been described in other turtle species, reptiles and birds, and it is considered as relatively ancestral (Russel & Beckenbanch 2008).
Mitochondrial genome of Caretta caretta
The parts of the mitogenome that showed the highest average number of differences between pairs of sequences (n), and thus the greatest genetic variation (Table 3) and the lowest sequence identity values (Table 2) were the D-Loop and protein-coding genes COII and ND5. Compared to other mitochondrial functional units, the D-Loop has been reported as the stretch with the highest levels of genetic diversity among sea turtle populations (Abreu-Grobois et al, 2006; Novelletto et al. 2016) as a non-coding and likely neutrally evolving DNA stretch, the D-Loop is possibly one of the top informative mitogenome fragments to perform gene flow analyses in populations of the species C. caretta. Based on the current results, the genes COII and ND5 could be equally useful when employed for this type of analyses.
Table 3 Genetic diversity estimators, for each mitochondrial proteincoding gene and the D-Loop region, for a loggerhead alignment consisting of the Cc-AO-C sequence and four loggerhead mitogenomes: Cc-AO-F, Cc-MS-G, Cc-PO-P and Cc-PO-H (see text for sequence name details).
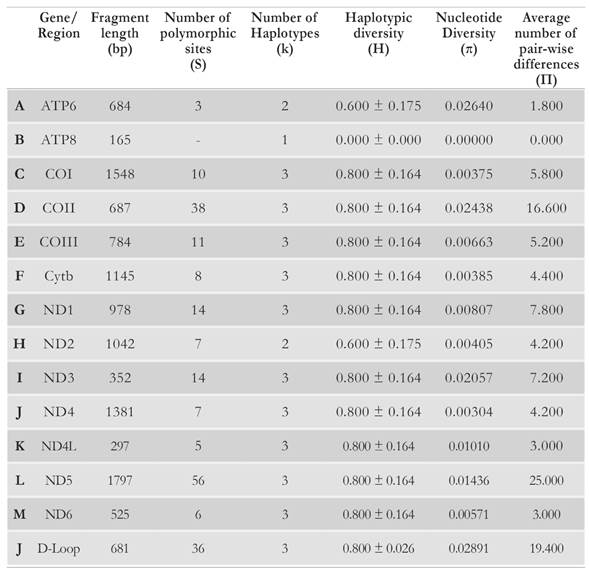
In contrast, the gene ATP8 was devoid of any sequence variation in the studied sequence set, thus having the highest degree of conservation. The availability of sequence data for the D-Loop from a broader sample of loggerhead turtles, allowed further investigation on D-Loop haplotype sequence identity across specific geographic ranges. The D-Loop haplotype of the Cc-AO-C mitogenome was most identical (99.2 %) with the CC-A1 haplotype, which is the most frequent (> 80 %) in nesting colonies along the North American east coast (North Carolina to South Florida) The CC-A1 haplotype has also been found in loggerhead turtles in the Colombian Caribbean (Franco & Hernandez, 2012, 2017). A total of 13 sites account for the differences between the Cc-AO-C and CC-A1 haplotype sequences. Thus, the Cc-AO-C haplotype can be regarded as novel among those described for nesting loggerhead turtles in the Caribbean.
The haplotype that showed 95 % identity with Cc-AO-C D-Loop was CC-A2. This haplotype has also been reported in the Colombian Caribbean (Franco & Hernandez, 2012, 2017), and it is the dominant haplotype in loggerhead turtles of samples in Quintana Roo (Mexico), southwestern Cuba (Ruiz-Urquiola et al. 2010), and the South Florida rookeries (SE and SW combined).
Prior studies have reported opposite latitudinal gradients in the frequencies of these two main haplotypes in the Caribbean. The CC-A2 haplotype is most frequent in the north and becomes less common southward, whereas the opposite pattern is seen for haplotype CC-A1 (Encalada et al. 1998; Bowen et al. 2005 and Shamblin et al. 2011). Nesting aggregation in Colombia is related to nesting colonies in Southern Florida and Mexico. Loggerhead turtles from the foraging area around Don Diego beach (in the Colombian Caribbean) are grouped with other aggregations of feeding populations from the North Atlantic, Mediterranean Sea (Spain and Italy) and to sequences frequently reported from nesting populations in the North
Atlantic and Mexico. This pattern suggests that individuals that use the Colombian Caribbean for feeding and reproduction are part of an Atlantic meta-population, where haplotypes CC-A1 and CC-A2 are the most frequent (Franco & Hernandez, 2012, 2017). The novel Cc-AO-C loggerhead haplotype may be endemic to the Colombian Caribbean rookery, and thus may suggest that Colombian loggerheads display natal homing.
tRNA variation
The 22 tRNAs were distributed along the mitogenome (13 in the H-strand and 9 in the L-strand). When the 22 tRNAs sequences of the Cc-AO-C and Cc-MS-G turtles were compared, 9.1 % (2 out of 22, tRNATrp and tRNA Leu) revealed nucleotide differences (Fig. 1). The remainder 90.9 % (20) revealed a strong nucleotide conservation. Such level of conservation may be due to the small size of these tRNAs and the selective pressure exerted on these important elements for the process of molecular translation (Florentz et al. 2003, Widmann et al. 2010) (Fig. 1).
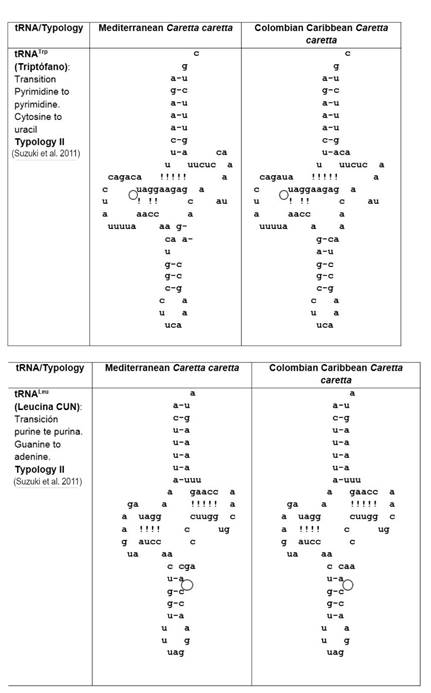
Figure 1 Comparison of 2D structure of tRNATrp and tRNALeu between both, Cc-AO-C and Cc-MS-G that presented mutations (marked with circles).
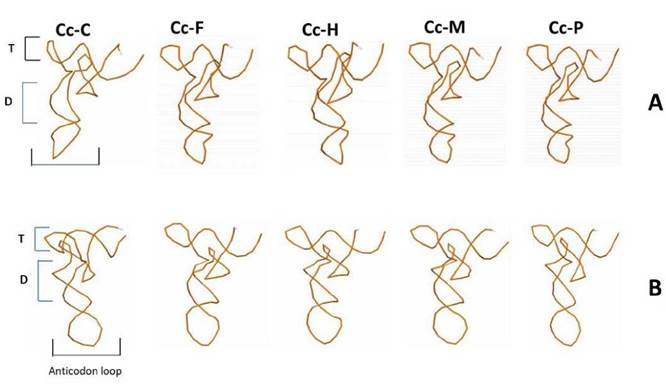
Secondary typology analysis of the Cc-AO-C tRNAs revealed unique features at tRNATrp and tRNALeu. These two tRNAs present typology II as defined by Suzuki et al (2011) (Fig. 1). The unique features at Cc-AO-C tRNATrp and tRNALeu, however, did not lead to large changes in the predicted 3D structure of these tRNAs, with respect to other loggerhead structures of Cc-PO-H, Cc-PO-P, Cc-MS-G, and Cc-AO-F (Fig. 2). The tRNATrp was characterized by presenting tertiary interactions amongpositions16-48, atthe tRNA's D-loop allowing the folding of the structure (Saks et al. 1998, Suzuki et al. 2011). Furthermore, this Cc-AO-C tRNATrp presented a transition in position 14 (Fig. 1) which does not allow for any interaction with position 48, leading to a modified 3D structure (Fig. 2). These structural changes might have a negative impact on the individual, and they should be studied at the population level to determine their actual frequency. Moreover, it is essential to verify if there are heteroplasmic mutations, and finally, study whether those changes can lead to a pathologic state of the turtles.
Phylogenetic inference of marine turtles
The individual markers that best explained the phylogeny of the sea turtles were ND5, ND4, and 16S when using the BI method. The ND5 gene has not been yet used as a molecular marker to do phylogenetic analysis in sea turtles (Fig. 3). However, in the present study the topology obtained with this gene is in full agreement with the currently accepted sea turtle phylogeny. These results support the analysis done by Dutton et al (1996) who used ND5 gene data to lay out a phylogenetic hypothesis for these organisms.
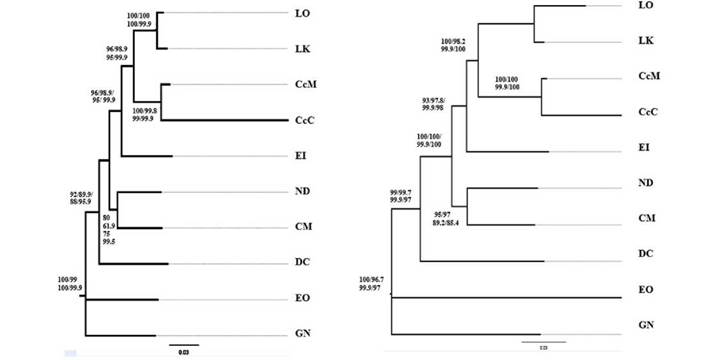
Figure 3 Phylogenetic inference of sea turtles. A: Tree based on data from gene ND4 employing Maximum Likelihood (ML), Maximum Parsomony (MP), and Bayesian Inference (BI) methods. B. Tree from complete mitogenome data following ML, MP, and BI methods. Following samples were included: L. kempii (LK), L. olivacea (LO), C. caretta- Colombian Atlantic Ocean (Cc-AO-C), C. mydas (CM), C. caretta- Greek Mediterranean Sea (Cc-MS-G), N. depressus (ND), E. imbricata (EI), and D. coriacea (DC).
Cases of phylogenetic incongruity among individual genes were found. For instance, trees based on data from the ATP8 and ND4L genes were not informative (results not shown), likely due to their small size and high level of nucleotide conservation (Table 2 and 3). These two genes are essential part of enzyme production in the mitochondria (Suzuki et al. 2011). The gene ND1 resolved relations within the Cheloniidae family but was not useful in differentiating Cheloniidae from Dermochelyidae. Previous molecular studies have not established a coherent and statistically well-supported conclusion on the phylogeny of sea turtles (Kumazawa & Nishida 1999).
In current phylogenetic analysis, the use of data from complete mitogenomes is gaining ground. With full or partial mitogenome data, phylogenetic analyses become more robust and gain in phylogenetic resolution and greater precision compared to analysis based on data from individual markers (Duchene et al. 2011). The current results support previous relationships among sea turtle species, N. depressus as the sister taxon to Chelonia (Duchene etal. 2012, Naro-Maciel et al. 2008) as well as the clade comprising Erecmochelys, Lepidochelys and Caretta (Fig. 3) (Dutton et al. 1999, Duchene et al. 2012). This result is important when explaining phylogenetic relationships within the family Cheloniidae, particularly the exclusion of N. depressus from the subfamily Carettini (Dutton et al. 1999, Duchene et al. 2012, Naro-Maciel et al. 2008). Out of the total number of mitochondrial markers, from which data were obtained to solve ancestry-descent relations among sea turtles, the ND5 gene produced highly supported trees. This marker can generate phylogenetic trees with a support comparable to that of a complete mitochondrial genome, and it confirms the topology of the proposed phylogeny for these species. This study presents the use of mitochondrial genomes as an alternative to improve phylogenetic analysis to estimate the evolutionary relations among sea turtles.
Conclusions
In this study, the complete mitochondrial genome of an individual of the endangered loggerhead marine turtle species, C. caretta, nesting in the Colombia Caribbean coast was sequenced. This has opened new possibilities to understand the extent of genetic variation and how matrilineal gene flow happens within the loggerhead species across its broad distribution range.
This loggerhead mitogenome is 16362 bp long, comprises a non-coding region (D-Loop), 13 protein-coding genes, 22 tRNA genes and 2 rRNA (16S and 12S). This sampled nesting turtle harbors a new D-Loop haplotype, with thirteen sites differing from the closest previously reported Caribbean CC-A1 haplotype. The tRNATrp and tRNALeu presented specific mutations in Cc-AO-C. The other 20 tRNAs revealed a strong nucleotide conservation and tRNATrp presented modification of its 3D structure.
The phylogeny of sea turtles was revisited with this novel mitogenome. The entire mitogenome, and the loci ND5, ND4, and 16S provided sequence data to build well resolved trees that largely agreed with currently accepted sea turtle phylogenetic hypotheses. This study presents the use of complete mitogenomes as a feasible alternative to gather data useful to conduct thorough phylogenetic analysis in sea turtles.

