


 text in
  English (pdf)
 Article in xml format
 Article references
 Send this article by e-mail
 Cited by SciELO
  Cited by Google
  Similars in
SciELO
Similars in
SciELO  Similars in Google
 Permalink
Introduction
Until before the declaration of the International Year of Quinoa, traditional quinoa production areas were concentrated in the highlands and the inter-Andean valleys under predominantly traditional production systems (Gómez & Aguilar 2016, Pinedo et al., 2017a, 2018; Soto et al., 2012; Tapia et al., 2014). The use of family labor, traditional tools with little or no dependence on external inputs, and the spatial and temporal association with other subsistence crops to ensure a diversified food basket characterize these traditional production systems (Fairlie-Reinoso, 2016; Nicholls & Altieri, 2012; Pinedo et al., 2017a). Currently, in Peru, quinoa is cultivated from the sea level up to 4,000 meters above sea level in four agro-ecological zones: highlands, inter-Andean valleys, and marine and coastal yungas (Apaza et al., 2013; Gómez & Aguilar, 2016; Tapia et al., 2014). Besides, the technology used in its cultivation is variable, ranging from traditional systems to highly technical (Gómez & Aguilar, 2016).
Mainly in the last decade, traditional production practices have been partially or totally replaced with exclusive technologies for intensive farming (Instituto Interamericano de Cooperación para la Agricultura [IICA], 2015; Pinedo et al., 2018), causing a reduction in the number of native quinoa varieties and other food security crops typical of the high Andean region (Soto et al., 2012). Therefore, from a diversified production and coexistence with the natural environment, quinoa production has moved towards more technical production models called organic and conventional, in monoculture and alternative systems (IICA, 2015; Pinedo et al., 2018).
The official statistics of Ministerio de Agricultura y Riego [Ministry of Agriculture and Irrigation] state that in Peru, the quinoa production at the national level increased significantly from 35,195 t in the year 2005 to 105,665 t in the year 2014. At the Ayacucho department level, quinoa production increased from 1,559 t in 2005 to 16,700 t in 2016, with a growth of 838% (Mercado, 2018). Meanwhile, in Ayacucho –the study area– quinoa production increased by 939%, increasing from 244 ha to 2,536 ha in the 2003-2013 campaign (Dirección Regional Agraria Ayacucho [DRAA], 2016). Furthermore, 40% of the organic production systems, 45% of the traditional, 34% the alternative or mixed, and 4.37% of the traditional production systems are observed in the study area (Pinedo et al., 2017a). Currently, organic production is promoted; however, the market accepts quinoa from conventional production systems that depend on chemical inputs, fertilizers and intensive mechanization, mainly for national consumption (IICA, 2015; Pinedo et al., 2018).
The best economic boom stage for quinoa producers occurs during the agricultural seasons 2012, 2013, 2014, and 2015 (Fairlie-Reinoso, 2016; Ministerio de Agricultura y Riego [Minagri], 2017; Pinedo et al., 2018). High prices and a growing market accelerated the change from traditional to conventional agriculture, causing a decrease in the sustainability levels, from a strong position –associated with the conservation of natural resources and soil and environmental conservation practices with ancestral practices– to one with the use of modern techniques that include the use of agricultural equipment, and excessive use of fertilizers and pesticides, prioritizing economic profitability in detriment of environmental aspects (Fairlie-Reinoso, 2016). Sustainable agriculture is based on following and complying with specific environmental quality standards, and guaranteeing living conditions with acceptable levels of coexistence in communities (Altieri & Nicholls, 2000; Fairlie-Reinoso, 2016; Ruíz et al., 2015). Agriculture is highly dependent on the services provided by ecosystems; therefore, sustainable agriculture must minimize adverse environmental impacts and optimize production, making efficient use of natural resources within the biophysical limits of agroecosystems (Organización de las Naciones Unidas para la Alimentación y la Agricultura [FAO], 2014; Sarandón, 2002).
For the reasons stated, it is necessary to analyze the impacts caused by the intensification of quinoa cultivation concerning the environmental dimension in the inter-Andean valleys of Ayacucho, Peru.
Materials and methods
The research was carried out in October 2016 corresponding to the 2015/2016 agricultural campaign, in the communities of Manallasac, Sachabamba, and Kishuarcancha, that belong to the Chiara district, Huamanga Province, Ayacucho Department, Peru. The area is located at the geographic coordinates 13°16′26.3″ S and 74°12′21.9″ W, at an altitude of 3,516 m a.s.l., and is the largest planting area of quinoa (figure 1).
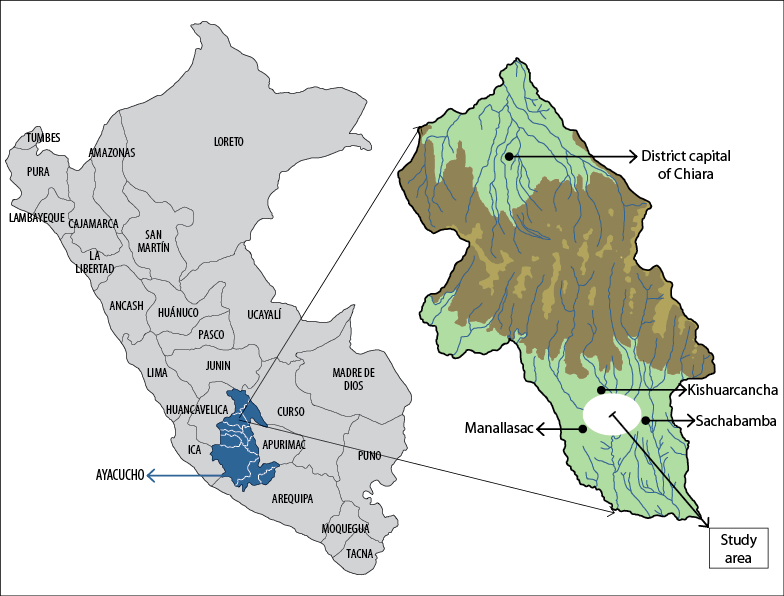
Source: Elaborated by the authors
Figure 1 Location of the study area in the district of Chiara, province of Huamanga, department of Ayacucho in Peru
From a finite population of 400 quinoa producers (DRAA, 2016), an unrestricted random sample of 92 families was identified. Furthermore, through the systematic sampling of Pinedo et al. (2018), the number of producers per community was established (table 1).
Table 1 Sample calculated proportionally per community assessed in the inter-Andean valleys of Ayacucho-Peru
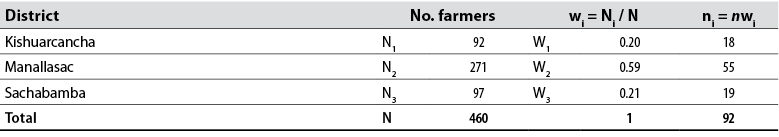
Note: N = population; n = sample; Wi = proportional weight of the sample.
Source: Elaborated by the authors
The variables and indicators were selected considering their easy identification, cost, interpretation (table 2), and possible replication in other investigations (Abraham et al., 2014; Nicholls & Altieri, 2012; Pinedo et al., 2017b; Sarandón, 2002). To establish the requirements to qualify the sustainability degree of quinoa cropping, the concept of strong sustainability, i.e., the one that considers natural resources as irreplaceable by human-made capital were included as a basis (Pearce & Atkinson, 1993). In other words, apart from being economically viable as well as culturally and socially acceptable, it must be ecologically adequate, conserving natural resources and preserving the integrity of the environment (Sarandón, 2002).
Table 2 Characterization, definition, and interpretation of sub-indicators of the environmental dimension
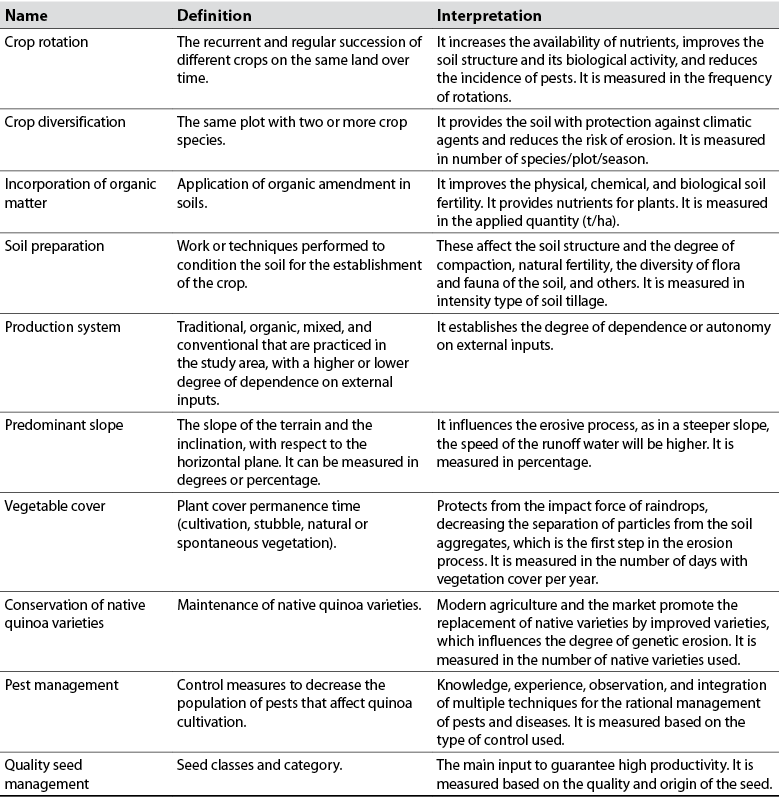
Source: Elaborated by the authors
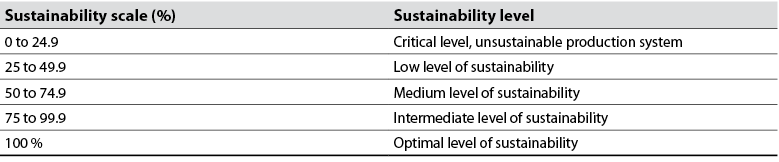
The evaluation scales were developed for each sub-indicator (table 3) to establish the level of sustainability through the values given to the indicator and the sub-indicator. The values assigned as a percentage vary between 100%, the optimal value, and 0%, the minimum value (Abraham et al., 2014), with 50% being the minimum sustainability threshold (Sarandón, 2002).
Table 3 Indicators and sub-indicators, and environmental sustainability assessment scale in percentage
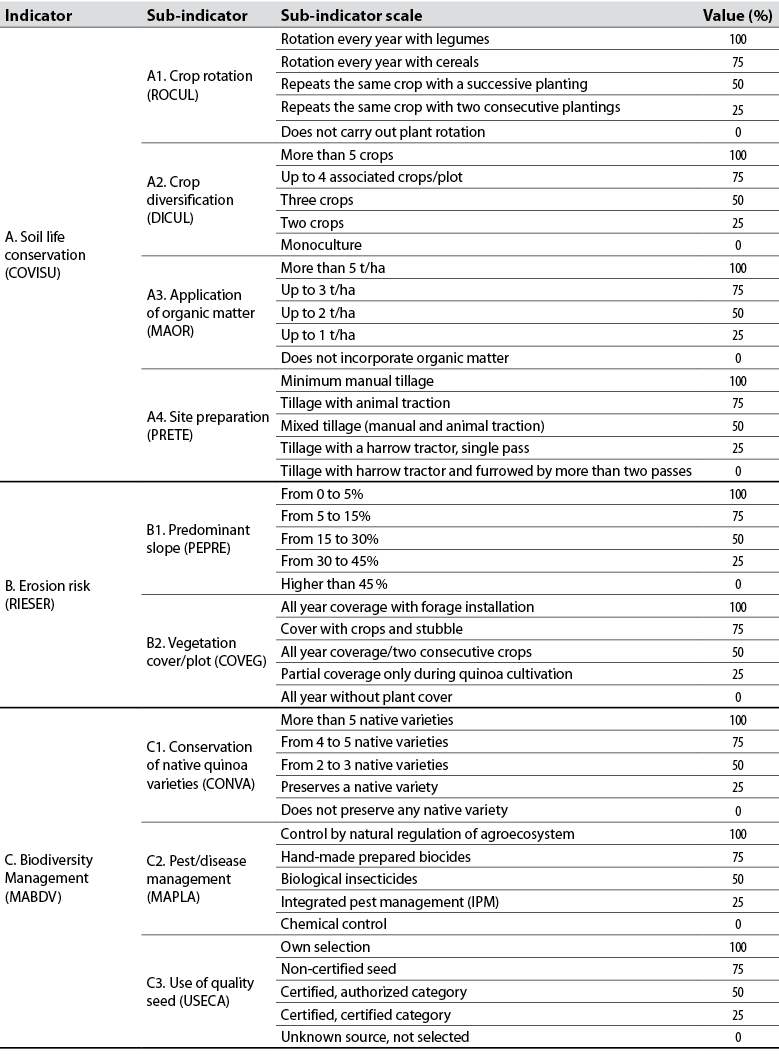
Source: Adapted from Pinedo et al. (2017b)
The scale from 0 to 100 (in percentage) is a modification of the methodological proposal of Sarandón (2002), who proposes a scale from 0 to 4, with 0 being the least sustainable and 4 the most sustainable. The value of each indicator was found using a weighted average between the frequency of responses of the producers over the total for each established range and the percentage of sustainability assigned. In turn, to find the value (%) of each sub-indicator, a simple average was applied with the weighted average of each indicator (Abraham et al., 2014). A scale to define the level of sustainability by ranges was developed (table 4), which allows locating the sustainability values (Abraham et al., 2014; Meza & Julca, 2015; Pinedo et al., 2018).
Results and discussion
The increase in the cultivated area with quinoa in Peru has modified the socioeconomic and environmental scenario in the highlands and high Andean region of the country (Bazile & Baudron, 2014; IICA, 2015; Pinedo et al., 2018). In a few years, the production systems went from constituting a self-consumption or family production agriculture with diversified subsistence to monoculture systems with high dependence on external inputs (Gómez & Aguilar 2016; Pinedo et al., 2018). Even though currently 40% of the production is produced for the organic market, the intensification of cultivation has modified the traditional cultivation cells that had the potato Solanum tuberosum L. (Solanaceae) as the main crop, followed by other tubers such as “oca” Oxalis tuberosa Molina (Oxalidaceae), “olluco” Ullucus tuberosus Caldas (Basellaceae), and Andean grains such as “tarwi” Lupinus mutabilis Sweet (Fabaceae) (IICA, 2015; Medrano & Torrico, 2015; Mercado, 2018; Pinedo et al., 2018).
To establish the sustainability level, the most appropriate way to measure the impacts generated by cultivation intensification is through economic, social, and environmental indicators (Sarandón, 2002). In the current work, soil life conservation, erosion risk, and biodiversity management indicators were used, as well as nine sub-indicators that have been used to find the value of the environmental indicator (EI). The use of indicators facilitates measurement, interpretation, and replication (Sarandón, Zuluaga, Cieza, Gómez, Janjetic, & Negrete, 2006). Following the methodological proposal of Sarandón (2002) and the adjustments made by Pinedo et al. (2018) and Meza and Julca (2015), the minimum sustainability threshold is obtained when the sub-indicators reach 50% according to the established scale.
The weighted values of the sub-indicators that are above the minimum sustainability threshold (MST) are the following: i) crop rotation (ROCUL), ii) organic matter management (MAORG), iii) predominant slope (PEPRE), and iv) pest management (MAPLA), with 82.07 %, 77.45 %, 64.13 %, and 51.21 %, respectively, reaching the intermediate and medium levels of sustainability.
The sub-indicators variety conservation (CONVA), use of quality seeds (USECA), soil preparation (PRETE), crop diversification (DICUL) and plant coverage (COVEG), which showed values of 48.91 %, 45.92 %, 18.70 %, 15.10 %, and 38.41 %, respectively, did not reach sustainability levels as they were below the MST (table 5).
The variables with the most significant influence on unsustainability were DICUL and PRETE with 15,10% and 18,70%, respectively. In fact, the new organic and conventional production models have caused the displacement of local varieties, as they are predominantly monoculture crops with intensive land use. In monoculture systems, traditional polyculture practices –planting several native varieties in a single plot– were displaced by models that promote univarietal cultivation systems (Pinedo et al., 2018). For example, in Peru, organic production and certification do not accept varietal blends due to market demands (IICA, 2015; Mercado, 2018).
Table 5 Weighted values of environmental sustainability levels in quinoa production in the inter-Andean valleys of Ayacucho, Peru
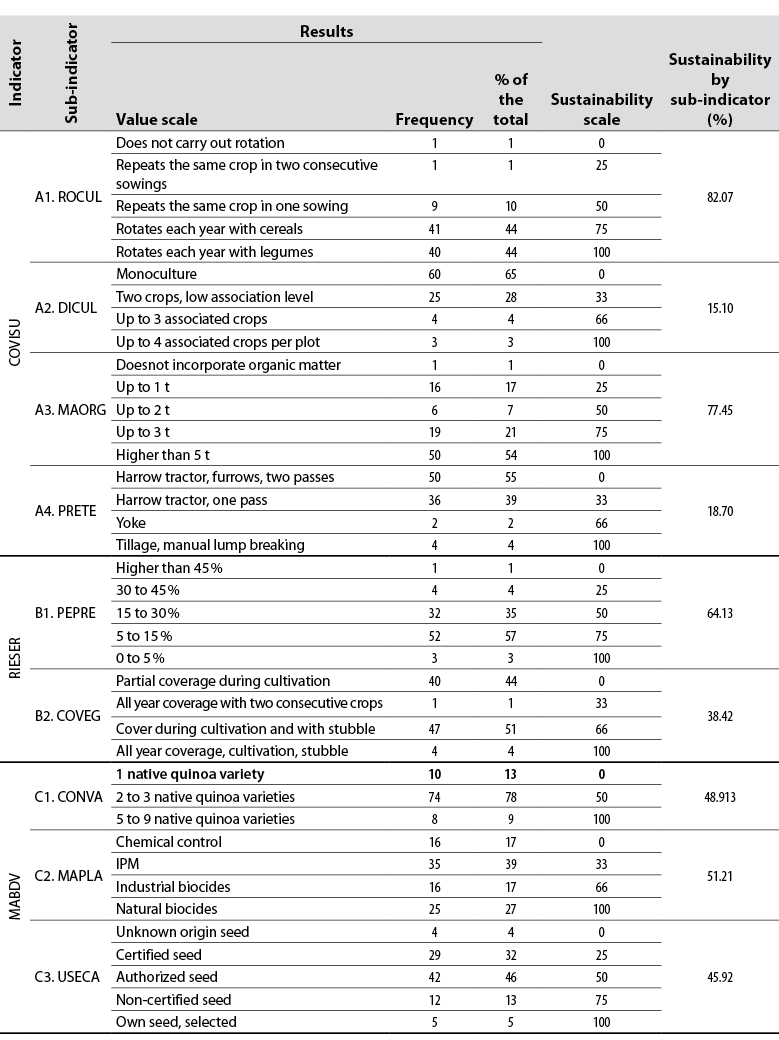
Note: soil health conservation (COVISU); soil erosion risk (RIESER); biodiversity management (MABDV).
Source: Elaborated by the authors
In the indicator of the soil life conservation (A), the ROCUL sub-indicator reached 82.7%, as the highest value, and is included in the optimal level of sustainability. This value shows that the practices from the traditional system and those that were recently introduced (organic, mixed, and conventional) perform crop rotation based on four essential crops: potato, quinoa, bean Vicia faba L. (Fabaceae) and forages. In this regard, Altieri and Nicholls (2000) affirm that crop rotation improves soil fertility and can decrease its erosion depending on the crop and agricultural practices used. These soil conservation techniques offer the means to improve productivity while protecting the soil and mitigating climate change (FAO, 2014).
The sub-indicators organic matter incorporation (77.45%) and pest management (51.21%) are located in the medium level of sustainability. Figure 2, an amoeba type of graph, allows comparing the relevant points or indicators that contribute to the sustainability of the system and the critical points that do not contribute to the environmental sustainability (Abraham et al., 2014). The critical points that require urgent attention are the indicators crop diversification and land preparation that reached values of 15.1% and 18.70%, respectively, included in the critical level of sustainability; both sub-indicators reflect very low sustainability values since the market is based on standardized quinoas of a single color, a single variety and the use of seed of improved varieties, displacing native varieties (IICA, 2015; Mercado, 2018; Pinedo et al., 2018; Soto et al., 2012).
Regarding land preparation, in the study area, traditional land preparation techniques using traditional tools were displaced by the introduction and increased use of agricultural equipment (Medrano & Torrico, 2015; Pinedo et al., 2017a, 2018), thanks to the high demand for quinoa in the market (Mercado, 2018). The use of equipment in land preparation manages to reduce costs and number of wages when the preparation is manual with traditional tools; however, its adverse effects or disadvantages are reflected in the gradual deterioration of the soil structure, due to the compaction by the weight of agricultural equipment and tools, in addition to soil erosion on land with moderate to strong slopes (Altieri & Nicholls, 2000).
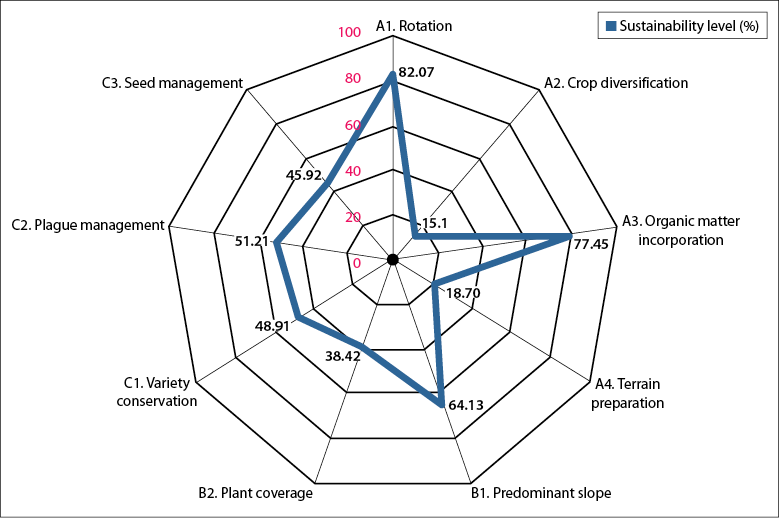
Source: Elaborated by the authors
Figure 2 Representation of the sub-indicator values of the environmental dimension in the common quinoa production area (Manallasaq, Sachabamba, and Kishuarcancha-Huamanga), Ayacucho, Peru (2016)
Quinoa achieves good yields when rotated after potato (Gómez & Aguilar, 2016; Pinedo et al., 2017a, 2018; Soto et al., 2012; Tapia et al., 2014). According to work carried out by Pinedo et al. (2017a) in the study area, there are four quinoa production systems: 1) traditional system producers performing rotations, 2) those of the organic system that have to comply with the certification standards of Servicio Nacional de Sanidad Agraria (SENASA) [National Agrarian Health Service] that requires crop rotation; 3) mixed or alternative systems (Bolívar, 2011) as part of the transition process to sustainable systems of rational soil management (Nicholls & Altieri, 2012; Sarandón & Flores, 2014); 4) conventional systems, in which crop rotation is practiced when the system has problems of low productivity or increased incidence of pests (IICA, 2015; Medrano & Torrico, 2015; Soto et al., 2012).
The high market demand changed the logic of production and the perspective of the farmer (Bazile & Baudron, 2014; Maletta, 2017) and has gradually integrated them into an increasingly competitive market, a situation that forces producers (especially of family farming) to adopt cultivation techniques or production models dependent on external inputs (Maletta, 2017; Nicholls & Altieri, 2012), with high productivity to improve their family economy. The intensification of agricultural production puts pressure on fragile production systems in the inter-Andean valleys (Medrano & Torrico, 2015). Expanding cultivation outside of traditional production areas can decrease the overexploitation of resources and could help stabilize the sustainability of the Andean cultivation system, in crops such as quinoa (Ruiz et al., 2014).
The critical point of the system is reflected in the value of 15.2% reached by the DICUL indicator. Due to the growing demand for quinoa grains in the international market (IICA, 2015; Pinedo et al., 2018; Mercado, 2018), models for the production of clean quinoa or monocultures have been promoted, causing the displacement of native varieties and other food crops. The predominance of monoculture is the cause of the loss of biodiversity and the loss of diversified traditional plot management practices (Nicholls & Altieri, 2012; Sarandón & Flores, 2014); moreover, these monoculture models generate higher dependence on external inputs (Nicholls & Altieri, 2012; Pinedo et al., 2018).
The MAPLA sub-indicator (51.21%) has a medium level of sustainability, which can be considered acceptable; however, it requires improvements regarding technical assistance and training for integrated pest management (IPM) and biological pest control, which significantly reduce the need to use pesticides (Altieri & Nicholls, 2000; Gómez & Aguilar, 2016). Nevertheless, these programs must respond to the particular conditions of a given location, area, or region with its own characteristics (Sarandón & Flores, 2014; Zepeda, 2018). Intercropping reduces weeds, pests, and diseases, improves soil quality and makes the use of water and nutrients more efficient as well as increases the productivity of the land (Altieri & Nicholls, 2000); nonetheless, sustainable pest management should consider adopting modern technologies, respecting local knowledge and preserving the environment. (Sarandón & Flores, 2014; Zepeda, 2018).
Regarding the PRETE and PEPRE indicators in the study area, the predominant soil slope varies from 5% to 30%. This characteristic favors the intensive use of agricultural equipment in quinoa-production labors such as soil preparation and furrowing, sowing, and harvesting (Pinedo et al., 2017a) that gradually deteriorate soil components and fertility. According to Altieri and Nicholls (2000), soil-conditioning practices for planting should contribute to the conservation of its physical, chemical, and biological properties.
The CONVA sub-indicator reached 48.1% sustainability, a level that shows the tendency of native quinoa varieties to disappear due to the market preference for varieties with high homogeneity grains in size and color (Mercado, 2018; Pinedo et al., 2018). Traditional Andean agroecosystems with high genetic diversity based on populations of wild species related to crops have been displaced by the entry of improved varieties (Altieri & Nicholls, 2000; Medrano & Torrico, 2015; Pinedo et al., 2018). This situation can be partially solved with ex situ conservation, which can help maintain genetic richness (Ruiz et al., 2014). In Peru, there are eight germplasm banks where around 6,302 quinoa accessions are conserved (Fairlie-Reinoso, 2016) and constitute a heterogeneous stock or a genetic and cultural heritage of quinoa to preserve and use in genetic improvement programs (Ruiz et al., 2014). On the other hand, in the market, currently, only 20 commercial varieties of quinoa (Apaza et al., 2013) developed by Instituto Nacional de Innovación Agraria [National Institute of Agrarian Innovation] and different Peruvian universities are offered (Gómez & Aguilar, 2016; IICA, 2015). However, these quinoa varieties introduced in areas outside their traditional growing regions require accompaniment and technical assistance with external inputs, and may not be adapted to local conditions (Ruiz et al., 2014).
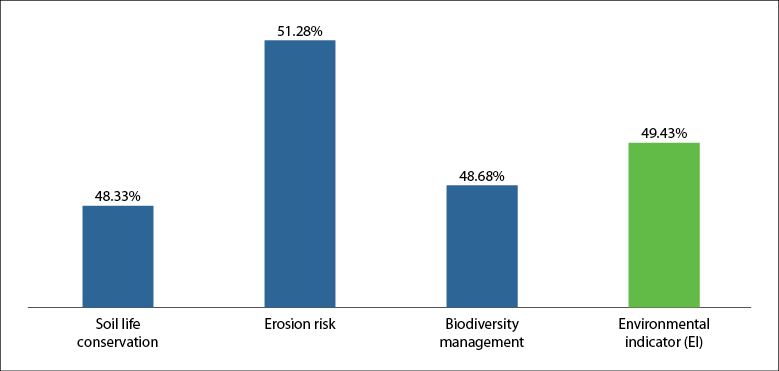
In figure 3, the weighted data of the variables or indicators show that the RIESER variable reached 51.28% with the best sustainability value, followed by the variables MABDV and COVISU.
Source: Elaborated by the authors
Figure 3 Sustainability levels in environmental variables and on the environmental indicator of quinoa production in Chiara, Ayacucho
According to the sustainability scale, in the environmental dimension, only the RIESER variable is sustainable because it is above the limits of the established minimum threshold, while MABDV and COVISU did not reach such condition (Sarandón, 2002). The average value of the three indicators shows that the EI is 49.43% and qualifies as showing a low level of sustainability; by not exceeding 50% (minimum threshold), it turned out to be unsustainable in the environmental dimension. According to Ruiz et al. (2015), the agroecosystems of the high Andean zones of Peru are fragile; the arable layer of the soils in most cases is scarce and subject to erosion by runoff, the action of rainfall, and bad agronomic practices, in addition to agricultural soils with steep slopes. The current production systems to be sustainable must not only improve productivity, be profitable and improve the social conditions of producers, but must also manage natural resources with the least environmental pollution (FAO, 2014; Sarandón, 2002; Sarandón et al., 2006). Therefore, the growing demand for food must consider the need to preserve arable land for agricultural food production and genetic diversity to safeguard the resilience of ecosystems (Jacobsen, 2003; Ruiz et al., 2014).
Conclusions
Quinoa production systems under the predominant organic, mixed, and conventional production models are not sustainable because the environmental indicator (EI) did not reach the minimum sustainability threshold established in the methodological proposal used.
The indicator erosion risk turned out to be the only one to exceed the minimum sustainability threshold, favored by soil rotation practices mainly with legume species that incorporate nitrogen into the soil, as well as by the incorporation of organic matter as a result of traditional practices, and because the predominant models such as the production of organic quinoa require the use of organic fertilizers. Another favorable factor found resulted in the sub-indicator predominant slope, because –according to the opinion of producers– erosion is lower when there is a moderate slope on their land. The sub-indicators that showed values below the minimum threshold were land preparation due to the intensification of using agricultural equipment and the diversification of crops by the displacement of traditional production systems and native quinoa varieties.

