


 text in
  English (pdf)
 Article in xml format
 Article references
 Send this article by e-mail
 Cited by SciELO
  Cited by Google
  Similars in
SciELO
Similars in
SciELO  Similars in Google
 Permalink
Introduction
Protected agriculture owes its name to the use of structures (e.g., greenhouses, shade nets, and high or low tunnels) to protect crops from severe climate (Servicio Nacional de Sanidad, Inocuidad y Calidad Agroalimentaria [Senasica], 2016). Among the products planted under protected agriculture, we find vegetables that, in terms of export solely in Mexico, are concentrated mainly by large producers of protected agriculture. Only in the period between January and September 2019, the value of these exports reached 12,077 million dollars (Servicio de Información Agroalimentaria y Pesquera [SIAP], 2019). However, in the state of Guanajuato, Mexico, small producers lack the capacities of large ones, so they settle to sell their products in nearby supply markets, which regularly pay until they finish selling the products. If producers need their payment immediately when they sell their products, there are intermediaries called coyotes who are unscrupulous buyers who receive the product always below the prices established on the portal of Sistema Nacional de Información e Integración de Mercados [National Market Information and Integration System] (SNIIM) and different international stock exchanges (Jiménez, 2014).
Despite the fact that in Mexico, some institutions and companies provide information to agricultural producers for their decision making through the internet (Rodríguez, Valencia & Peña, 2018), universities or the government have not carried out studies about the impact they achieve on competitiveness in small Mexican producers. However, Rodríguez et al. (2018), who in turn cited the Organization for Economic Cooperation and Development [Organización para la Cooperación y el Desarrollo Económicos] ([OECD], 2011), reported that large producers effectively use information and communication technologies (ICT) when consulting Internet information that helps them in their decision-making and, with it, also the improvement and maintenance of their competitiveness. Thus, the hypothesis proposed is that a high level of ICT assimilation by small producers of protected agriculture in Guanajuato would increase their competitiveness. This hypothesis assumes that the efficient use of ICT by small producers can function as a means to connect them with other links in the agri-food chain. The following research question was asked considering the previously state hypothesis: What is the relationship between the assimilation of ICT and competitiveness in small producers of protected agriculture? Furthermore, the following general objective was raised: to verify that the assimilation of ICT by small producers of protected agriculture is a strategy that influences the improvement of the competitiveness of their UP.
Competitiveness in agricultural producers
Monke and Pearson (1989) established the competitiveness of an agricultural system through its current technology, production values, input and output costs, and transfer policies. These authors proposed the Policy Analysis Matrix (PAM) model to establish the profitability coefficient (CP), with the use of matrices that contain costs for both marketable inputs and domestic factors. The data provided by the matrices allow calculating the CP:
CP = [income - (agricultural supplies – domestic factors)] / (profits).
For its part, Secretaría de Agricultura, Ganadería, Desarrollo Rural, Pesca y Alimentación [Ministry of Agriculture, Livestock, Rural Development, Fisheries, and Food] (Sagarpa, 2008) provided the Profitability/Competitiveness Radius (PCR) model according to its Cost-Benefit Ratio (CBR) and classifies them as follows. Non-profitability Radius (CBR<1), Non-competitive profitability ratio (CBR > = 1, but < Banking passive interest rate [PIR]), Fragile competitiveness ratio (CBR <= PIR, but < CBR of a Base Product System [BPS]), and Robust Competitiveness Radius (CBR > CBR of BPS). Both models (PAM and PCR) served as the basis for calculating the levels of competitiveness in producers of protected agriculture in Guanajuato.
ICT assimilation
Technological assimilation is an organizational learning process in which individuals, together with the organization, acquire the knowledge and skills necessary to effectively apply technology (Attewell, 1992, cited by Fichman & Kemerer, 1997). Fichman (2001) used assimilation as the indicator that establishes the highest degree of technological adoption, which suggests that you can invest in acquiring the best technology, but this will not be adopted and will not mean a competitive advantage if aspects that make it challenging to apply are present. Therefore, it was necessary to find those attributes immersed in the process of assimilation of ICT in producers. In this regard, the Theory of Reasoned Action (TRA) was reviewed (Ajzen, 2005), which establishes that the behavior of people can be predicted by analyzing their attitude and their influence on intention. For its part, the Technology Acceptance Model (TAM), proposed by Davis (1989), suggests two reasons why people use or not information technologies: 1) to the extent that it is considered useful to improve work (perceived usefulness –PU–), and 2) the easiness or difficulty of using it (perceived ease of use –PEOU–).
Materials and methods
For the current research, the quantitative approach was applied, with a correlational scope establishing that it should be non-experimental and transectional when analyzing the production cycle autumn/winter 2016-2017. To distinguish producers, Instituto Nacional de Estadística y Geografía [National Institute of Statistics and Geography] (Inegi, 2017) groups them by their UP according to the size of the planted surface in small (up to 5 ha), medium (more than 5 and to 20 ha), and large (more 20 ha). Unfortunately, the tool could not be applied to a calculated probabilistic sample, since in the region, a series of insecurity actions have been raised by criminal groups, which have caused fear and mistrust in producers to provide information. This is the reason why we decided that it would be a non-probability and convenience sample, with the information gathered from 26 producers, who agreed to provide information on the condition that it was anonymous.
Tool design
The tool was divided into five sections: the first three focused on obtaining the necessary information to calculate the level of competitiveness of each producer, and the fourth and fifth were used to calculate their level of ICT assimilation.
Design of the methodological model proposed in the current research
To calculate the correlation between the levels of competitiveness and ICT assimilation, a methodological model based on the PAM, PCR, TRA and TAM models was designed to be able to propose the scales that would allow establishing the different levels of competitiveness and assimilation of ICT, as shown in figure 1.
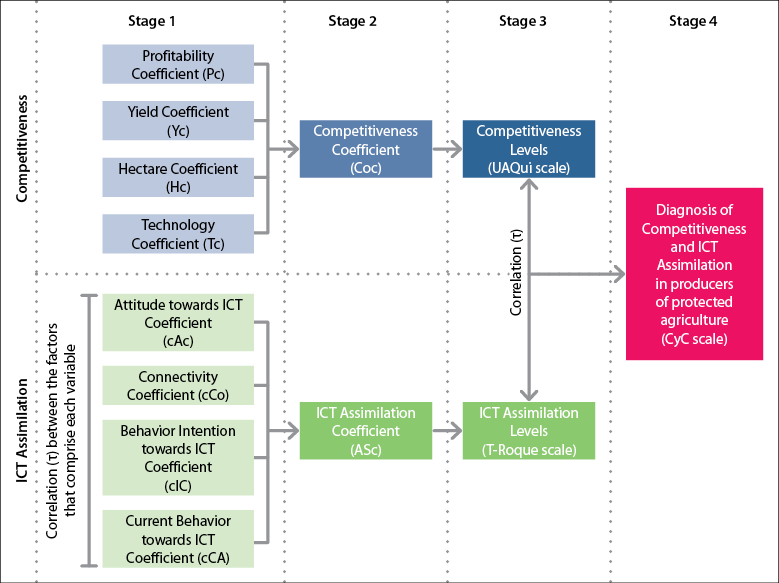
Source: Elaborated by the authors based on the PAM (Monke & Pearson, 1989), PCR (Sagarpa, 2008), TAM (Davis, 1989) and TRA (Ajzen, 1991) models.
Figure 1 Methodological model proposed in this research
Development of the UAQui scale to measure the level of competitiveness in producers of protected agriculture
From the proposed methodological model, stage 1 was implemented to establish the factors and their equations, which would serve for the calculations in stage 2, as well as the competitiveness coefficient (Coc) and to be able to design the UAQui scale in stage 3 that would measure the levels of competitiveness (figure 2).
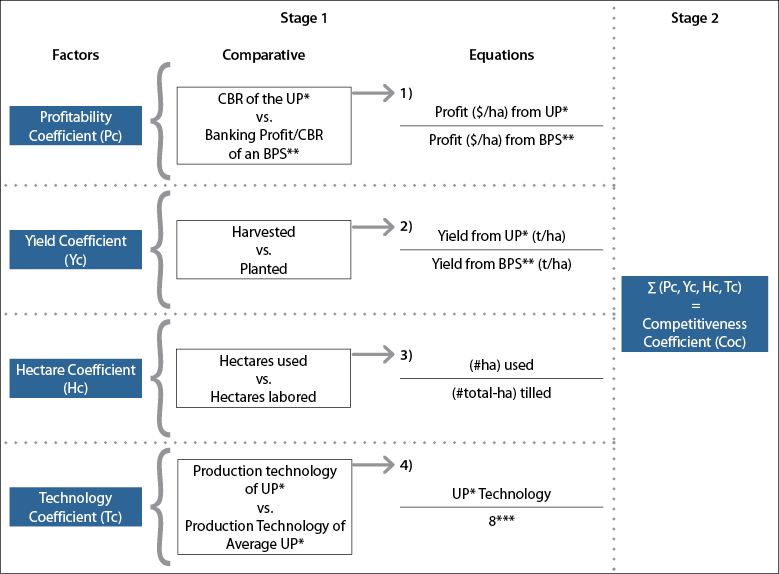
Source: Elaborated by the authors based on Monke and Pearson (1989) and Sagarpa (2008).
Figure 2 Factors and equations that comprise the competitiveness coefficient (Coc)Where * Production Unit; ** Base Product System; *** Total production technology used in protected agriculture = 8.
Before calculating the profitability coefficient (Pc), the CBR of the UP were compared to the banking passive interest rate (PIR) within the cycle in question, as well as with respect to the BPS of the product in the same cycle to determine its profitability, according to the PCR of Sagarpa (2008). In this way, if the PCR of the UP is less than 1 or less than the PIR, from this stage, the UP level of competitiveness will be predicted at level 0. Next, Pc was calculated according to equation (1) in figure 2. The yield (t/ha) of the UP was divided by the average yield of the BPS within the same cycle –equation (2) of figure 2– to calculate the yield coefficient (Yc). Moreover, the coefficient of hectares (Hc) was calculated according to the number of hectares used with respect to the number of hectares tilled –equation (3) in figure 2–. To calculate the technology coefficient (Tc), the technology applied in the UP was compared with the total technology applied in the production process within protected agriculture –equation (4) in figure 2–, in which the types of protection, irrigation, and cultivation area, among other technologies, were considered giving a maximum value of 8.
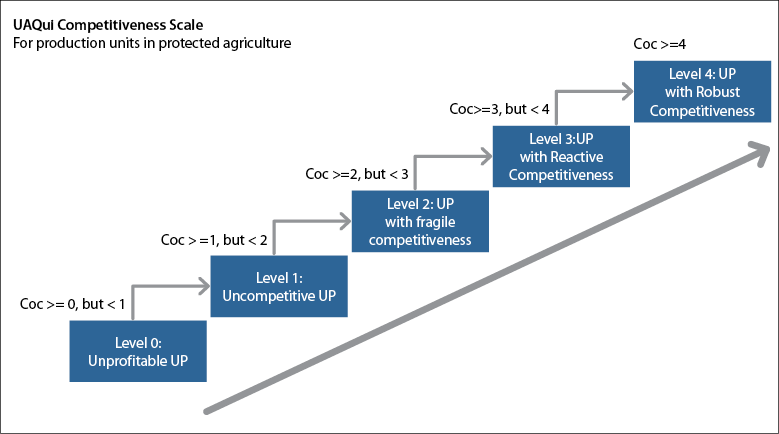
With the coefficients of the established factors, we proceeded to stage 2 to calculate the Coc of each producer. In stage 3, the UAQui competitiveness scale (figure 3) was designed based on Sagarpa (2008), where five levels of competitiveness were established.
Development of the T-Roque scale to measure the level of ICT assimilation in producers of protected agriculture
The model for determining ICT assimilation levels (AS) is presented in figure 4.
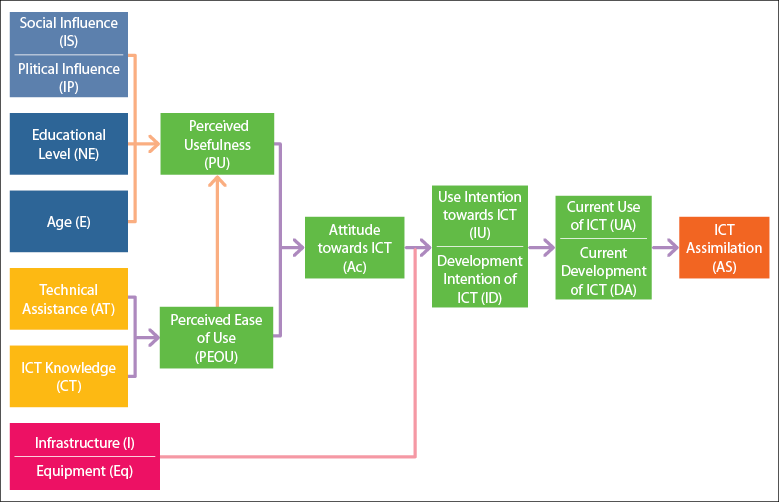
Source: Elaborated by the authors based on Ajzen (1991, 2005), Davis (1989), Leyton (2013), Fideicomisos Instituidos en Relación con la Agricultura (FIRA, 2017), Chavarría (2012) and Venkatesh et al. (2003).
Figure 4 Assimilation level of ICT
We arranged that the variables (indicators) that would affect the PU of the producer were: their PU on specific ICT (administrative systems, social networks, web pages, and apps), social influence (IS) by clients, suppliers, associations and other producers, political influence (IP) through public institutions, educational level (NE) and age (E). The Indicators for the producer PEOU were as follows: specific PEOU on specific ICT, expert-provided technical assistance, and producer ICT knowledge. The infrastructure for internet access (I), as well as its equipment (computers and cell phones), were considered to measure its connectivity capacity (Co). The attitude towards ICT (Ac), according to Monke and Pearson (1989), is influenced by PU and PEOU. Regarding the Behavior Intention (IC) of producers towards ICT, the proposed indicators were their use intention (IU) and their development intention (ID). The indicators of the current use (UA) and current development (DA) were proposed to measure the current behavior (CA) of producers towards ICT.
When the indicators were assigned, stage 1 of the methodological model began, and the factors (coefficients) that allowed assimilation in the producers to be measured were established (figure 5).
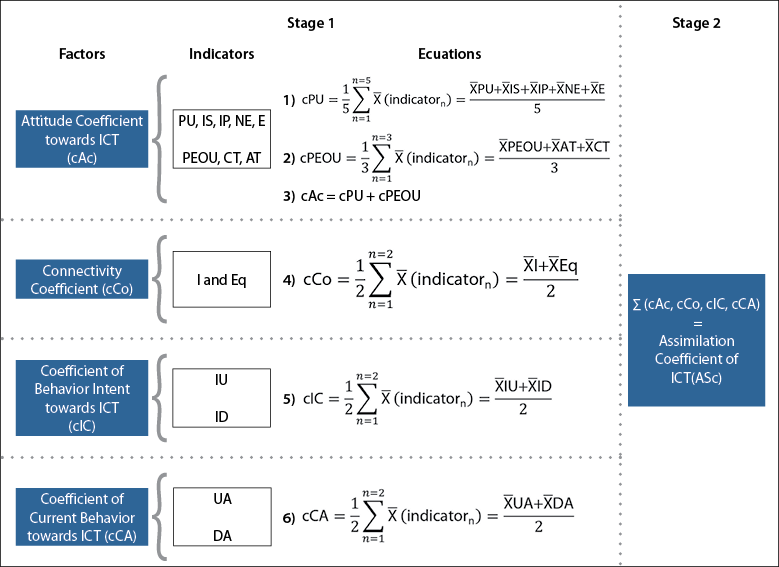
Source: Elaborated by the authors
Figure 5 Proposed equations to calculate the assimilation coefficient (ASc)
Given that the attitude of the producer towards ICT is the result of their perceptions of utility and ease of use towards these technologies, the cAc –equation (3) in figure 5– was calculated using the cPU coefficients –equation (1) of figure 5– and cPEOU –equation (2) of figure 5–, which in turn were arranged according to their indicators, as well as in the following coefficients (cCo, cIC, and cCA), to establish their corresponding equations –equations (4), (5) and (6), respectively–.
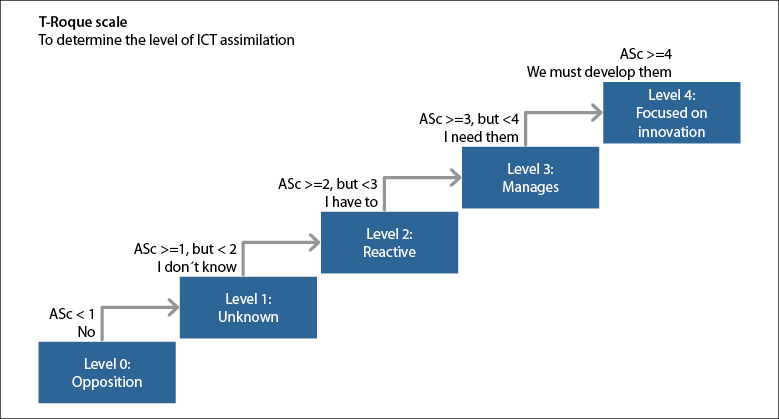
Subsequently, stage 2 of the methodological model was continued, and the ICT assimilation coefficients were calculated for each producer of the agriculture found in Guanajuato. From the calculated ASc, it was possible to design the T-Roque scale (in honor of Instituto Tecnológico Nacional de México, Roque campus [National Technological Institute of Mexico, Roque campus]), which determines the level of ICT assimilation in producers (figure 6).
Establishment of the correlation between the competitiveness and ICT assimilation levels in producers
After having established the levels of competitiveness and assimilation in the producers, stage 3 of the methodological model began, and its correlation was calculated to validate the hypothesis regarding the following probability values:
Probability value > = 0.05: the hypothesis is accepted.
Probability value < 0.05: the hypothesis is rejected.
Results and discussion
Following the methodology proposed, the CBR of the UP were calculated and contrasted against the value of 1, as well as against profits when investing $ 1,000,000 for a fixed term in Banorte/IXE funds from July 1, 2016, until June 30, 2017 (Banorte, 2018), to determine its PCR. The results showed that the CBR of all the UP were higher than 1, as well as higher than the profit from banking investments. Therefore, these results predicted that no UP would fall to level 0 of competitiveness.
Competitiveness coefficient (Coc) calculation in producers of protected agriculture in Guanajuato
The calculation of the Coc for each UP confirmed the prediction that there would be no Coc < 1, as shown in Table 1. Considering the small UP, in three of these their coefficients are very low, obtaining in total a Coc lower than 2; seven other small UP showed a Coc within the range of 2, and only one small UP (code 26) had a Coc higher than 3 (table 1).
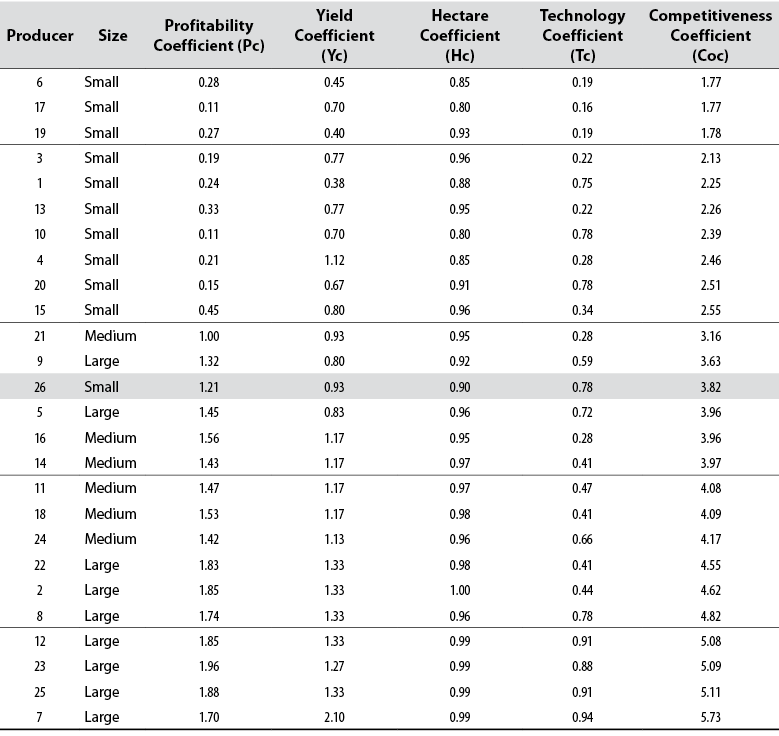
As can be seen in table 1, the small producer with code 26 made changes in the business model in addition to investing in inputs and production technology to be able to export, which coincides with De Luna et al. (2016), who reported that small producers in Latin America have made changes to improve their production and marketing. Furthermore, large UP with codes 5 and 9, stated that, during that season, they had problems with inputs, which affected their performance, positioning them in the reactive competitiveness level. With the Coc obtained in table 1, the UP were organized by level of competitiveness according to the UAQui scale (figure 7).
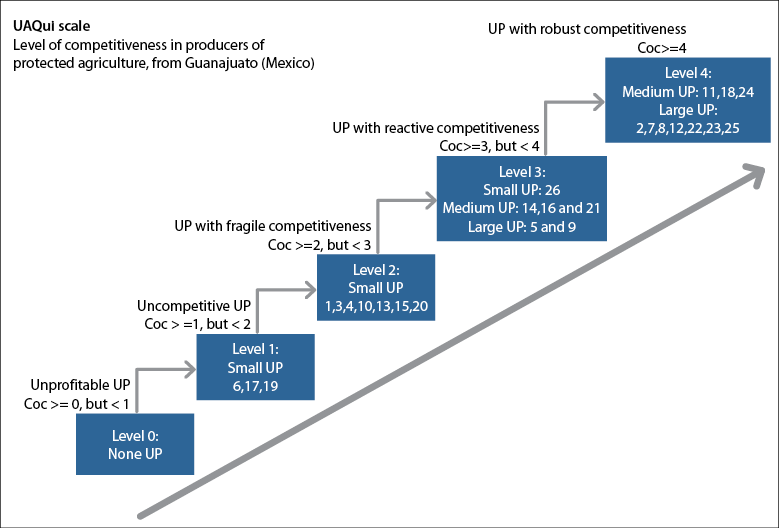
Source: Elaborated by the authors
Figure 7 Level of competitiveness of producers of protected agriculture, according to the UAQui scale
With the organization of the UP by levels, stage 3 of competitiveness was concluded. Subsequently, stage 1 was carried out for the assimilation of ICT.
Calculation of Tau Kendall correlations between the indicators and the variables, which affect the calculation of the assimilation coefficient
Non-parametric statistics were applied using the Tau (τ) Kendall correlation, obtaining the correlations shown in figure 8.
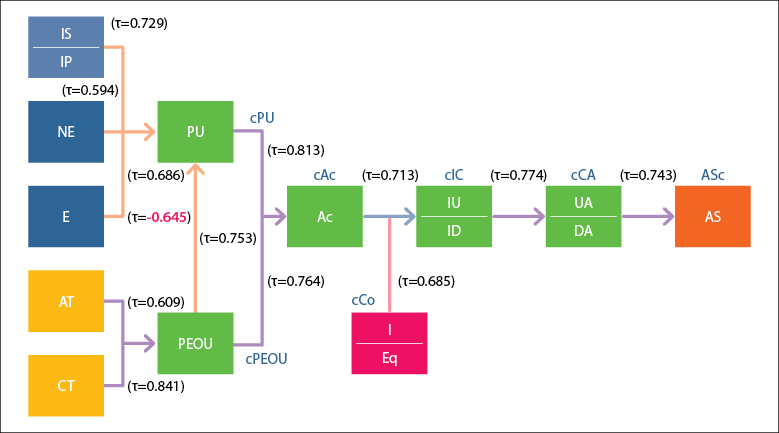
Source: Elaborated by the authors
Figure 8 Correlations between variables and indicators, which affect the Assimilation coefficient
The correlations in figure 8 show that when the producer had a higher knowledge of ICT and technical assistance, his/her perception of ease of use (PEOU) would be higher. These results are consistent with what Nagel (2012) found in producers in Latin America and the Caribbean, who stated that they did not possess skills or competencies for the use of ICT. This result is contrary to what was observed in Chinese producers, who stated that they had the skills and knowledge necessary to use ICT, which contributed to increasing their perception of ease of use (PEOU) and, consequently, their willingness to adopt them (Amin & Li, 2014).
On the other hand, the indicators IS, IP and NE have a positive impact on PU. Regarding IS, as for producers in China and Bangladesh, Amin and Li (2014) indicate that the perception of usefulness that other people have towards ICT is important. Regarding age, it has a significant impact on PU, but negatively, i.e., the older the producers, the ICT in the PU decreases. Regarding attitude, a high incidence of PEOU on PU is shown; that is, the higher the perception of ease of use, the higher will be its utility perception. Therefore, to improve their attitude towards ICT, a similar strategy can be implemented as was done to Uruguayan officials to create a standard in mobile applications and web portals (Chavarría, 2012), which facilitated their consultation and kept them updated; furthermore, this same was also proposed by Costa Rican officials in the Chavarría investigation (2012).
Regarding the behavior intention, the correlations showed that there is a high significance of the attitude and the capacity of connectivity compared to the behavior intention. This indicates that producers who have a better attitude towards ICT and have a higher capacity for connectivity will show a higher behavior intention towards these technologies. In this regard, Nagel (2012) found that Internet speed in rural areas is lower than 2 Mbps, and Chavarría (2012) stated that in Paraguay, companies that provide Internet service do not consider it profitable to expand bandwidth in remote rural areas, which will decrease the connectivity coefficient of small producers and the influence on their behavior intention.
The correlation of the behavior intention with the current behavior was also highly significant; on the contrary, the development intention (ID), which was 0 for all producers, shows their null intention to develop ICT. This corresponded to their current development intention (DA) = 0, where no producer is developing these technologies. This confirms that the behavior of people can be predicted by analyzing their attitude and their influence on intention (Ajzen, 2005). After calculating the correlations, the equations were designed to establish the assimilation coefficient (ASc) in the producers of protected agriculture in Guanajuato.
Establishment of the level of assimilation in producers of protected agriculture in Guanajuato
In stage 2 of the ICT assimilation, and according to the methodological proposal, the ASc of the producers were calculated, and the results are shown in table 2.
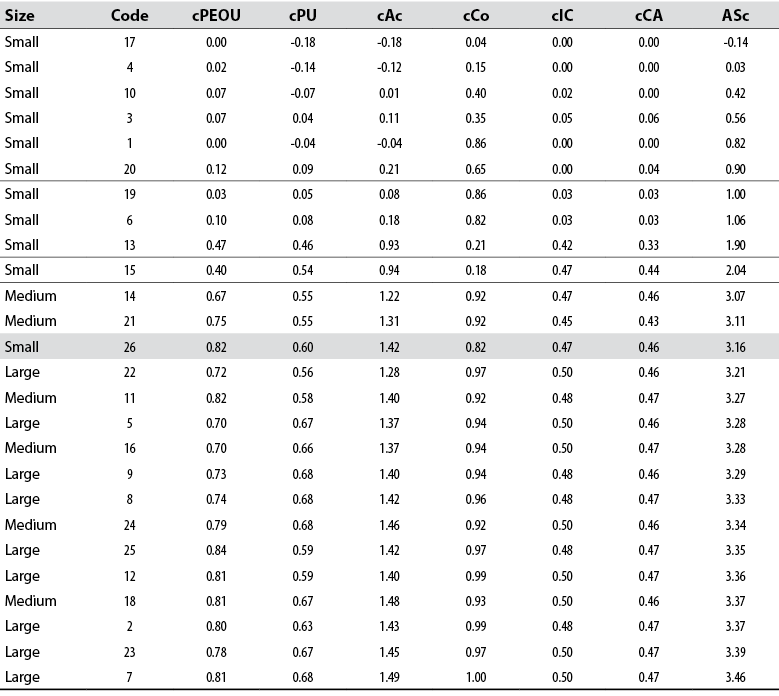
We can observe that the ASc for the small producer with code 17 is negative, and, in the small producers with codes 1, 3, 4, 10, and 20, it is less than 1. This corresponds to the negative attitude or close to 0 that they showed. Nonetheless, for the case of the small producer with code 26, as well as the medium and large producers, it is observed that their ASc was higher than 3, which indicates better assimilation of ICT; however, assimilation will increase as their interest in developing these technologies grows.
Subsequently, producers were grouped by their level of ICT assimilation, according to the T-Roque scale, as shown in figure 9, where six small producers obtained a level of ICT assimilation lower than 1, representing a low educational level (truncated primary) as an important factor.
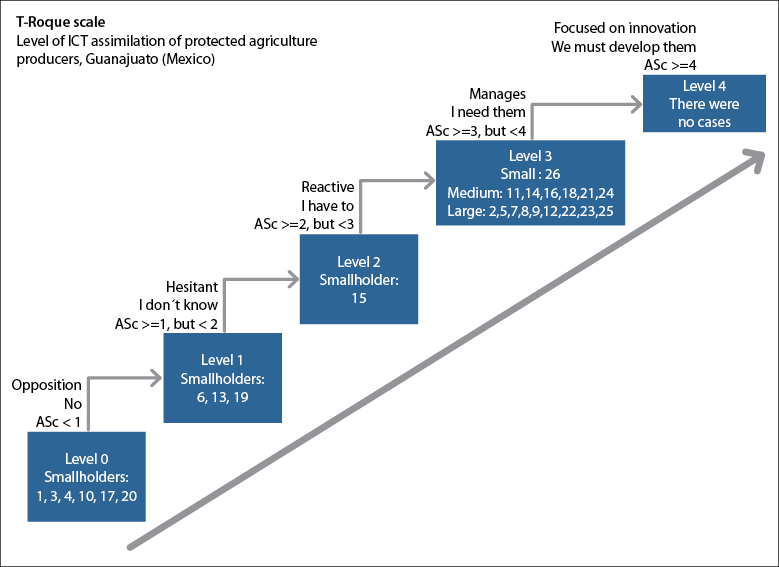
Source: Elaborated by the authors
Figure 9 Level of assimilation of ICT in producers of protected agriculture according to the T-Roque scale
The smallholder with code 15 shows a reactive level of assimilation when using ICT because he is an agricultural engineer by profession and uses ICT to manage his UP and to communicate with his clients as they ask him to do so. Due to space reasons, we show the summary of the CyC scale that was developed in stage 4 of the methodological model, and that contains the characteristics of UP and producers grouped according to the levels of competitiveness and assimilation of ICT in tables 3 and 4, respectively.
Table 3 Grouping UP characteristics according to their level of competitiveness
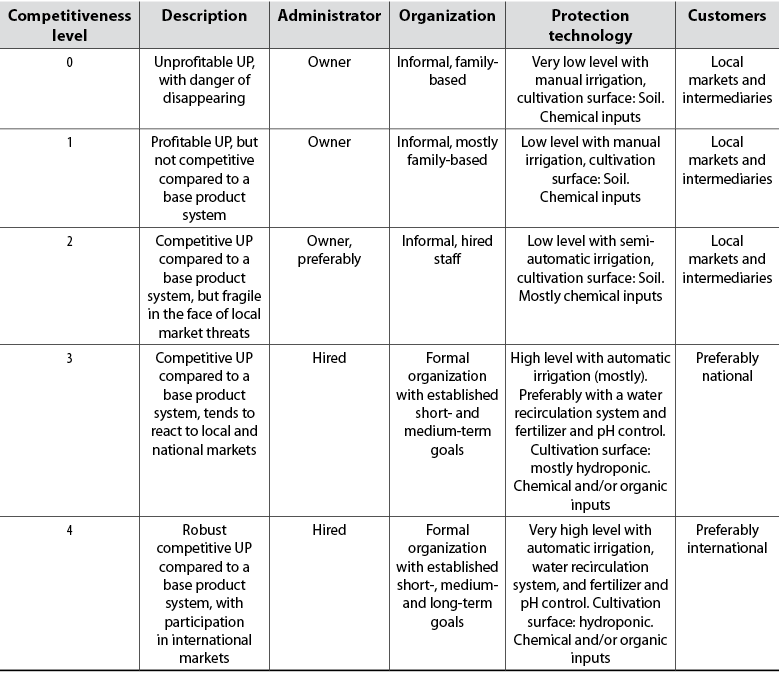
Source: Elaborated by the authors
Table 4 Grouping the characteristics of producers according to their level of ICT assimilation
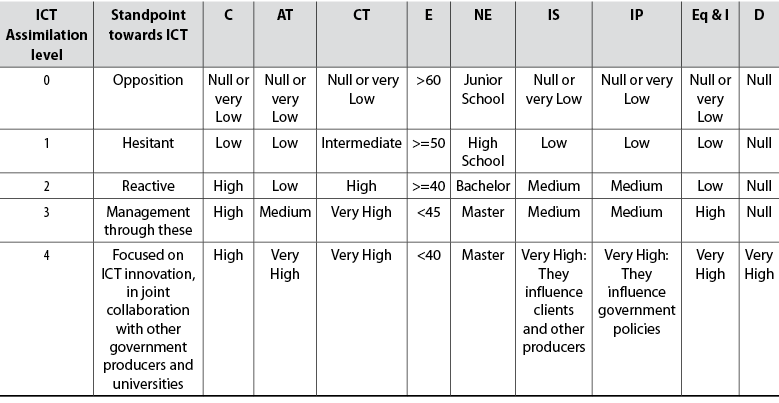
Source: Elaborated by the authors
The characteristics presented in tables 3 and 4 were obtained mainly from the analysis of the information provided by the surveyed producers. Since no producers with ICT assimilation Level of 4 were found, the characteristics presented were based on the concepts of innovation dissemination published by Fichman (2001) and Rogers (2003).
Correlation between the level of competitiveness and assimilation in producers of protected agriculture in Guanajuato
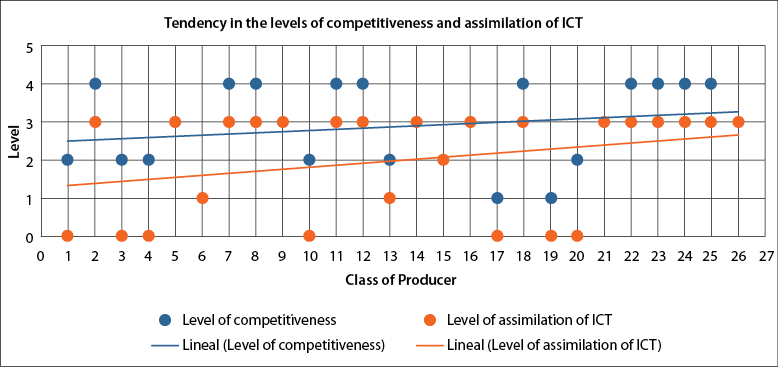
The Tau (τ) correlation between the level of competitiveness and ICT assimilation was then calculated, from which a significant relationship of 0.766 was obtained, which allows confirming the alternative hypothesis H1:
The assimilation of information technologies increases the competitiveness of small producers of protected agriculture in the state of Guanajuato.
The trend between the levels of ICT assimilation and the levels of competitiveness in producers of protected agriculture in Guanajuato is shown in figure 10.
Conclusions
The results obtained in the current research showed that the level of competitiveness is highly associated with the level of ICT assimilation, obtaining a significant correlation of 0.766, which shows that assimilation increases the competitiveness in smallholders of protected agriculture in the state of Guanajuato; therefore, the hypothesis was validated.
On the other hand, 10 of the 11 smallholders showed very low levels of ICT assimilation and, therefore, low levels of competitiveness, unlike the smallholder with code 26, who presented higher levels of ICT assimilation (3), as well as competitiveness (3). This shows that the research objective was achieved.
In smallholders with low levels of ICT assimilation and competitiveness, low levels of schooling were recorded, which resulted in a negative or very low attitude towards ICTs, as well as very little or no infrastructure and equipment.
Therefore, it is imperative to promote the improvement of ICT assimilation levels in smallholders of protected agriculture, starting with the process of adopting ICT through government programs that, besides, should contemplate agreements with companies that provide internet service to install efficient infrastructure. At the same time, collaborative links must be established between the government, producer associations, and educational institutions that provide training and extension agents that advise smallholders on the efficient use of these technologies. At the same time, ICT research and development (R&D) focused on the characteristics of small productive units of protected agriculture should be promoted to improve their competitiveness.

