


 text in
  English (pdf)
 Article in xml format
 Article references
 Send this article by e-mail
 Cited by SciELO
  Cited by Google
  Similars in
SciELO
Similars in
SciELO  Similars in Google
 Permalink
Introduction
Strawberry is a type of creeping plant whose name is derived from the Latin word fragrare, referring to its fragrance. This species belongs to the genus Fragaria, comprised of stoloniferous creeping plants of the Rosaceae family (Villaseñor, 2016). Strawberries grow in temperate climate regions with average annual temperatures between 12 °C and 20 °C, on fertile, well-drained, sandy-clayey soils, rich in organic matter and a pH of 5.5 to 6.5 (Aguilera & Chávez, 2011). It is a fruit rich in antioxidants and other bioactive compounds that reduce the risk of cancer and cardiovascular diseases. It is considered a fruit of great nutritional value with a pleasant smell and taste, so it has great demand in the national and international markets (Hannum, 2004).
The main components that determine the quality of ripe fruits are soluble solids and acidity. The soluble solids content (glucose, fructose, and sucrose) changes depending on the variety (Martínez- Bolaños et al., 2008; Ojeda-Real et al., 2008). Citric acid is the most abundant acid in strawberries, followed by malic, succinic, and ascorbic acids, and this is why the acidity results are usually expressed in the amount of citric acid (Ojeda-Real et al., 2008).
Although the strawberry plant can live for several years, it lasts two years in economic production. In older plantations, plants are weaker, show low yields, and lower quality fruits due to a higher incidence of pests and diseases (Altamirano, 2004).
In Mexico, strawberry is a crop that, although it does not stand out for the number of hectares planted or for the foreign currency generated from its export, it is an exceptional source of employment in the main producing areas. This is because it is not only a very labor-intensive product both in the agricultural and industrial phases, but it also generates much activity in the input production, marketing, and transport areas, among others (Echánove, 2001).
Strawberry was introduced to Mexico in the middle of the last century through the state of Guanajuato, with varieties from the Lyon region, France. At first, this incipient production was limited to meeting the needs of the domestic market; however, since 1950, its importance increased due to the growing demand from the United States that sought to complement its consumption during winter (Apoyos y Servicios a la Comercialización Agropecuaria, 1998).
It was precisely the export that made the cultivation spread to approximately 12 states of the country, and the installation of freezers and packers grew rapidly in the various strawberry-producing regions (Feder, 1981). In 2017, strawberry reached a central place in the national agricultural industry due to the generation of foreign exchange. Furthermore, 52.21 % of the national strawberry production is destined for the foreign market, and each year, this percentage has been growing, given the success of this product in international trade. In fact, Mexico is the third supplier of fresh strawberries in the international market, with 14.83 % of the world exports. Mexican exports accounted for 87.79 % of the strawberry imports in the US (Secretaría de Agricultura, Ganadería, Desarrollo Rural, Pesca y Alimentación, 2017).
Exports have grown in recent decades in absolute terms and with respect to national production (Servicio de Información Agroalimentaria y Pesquera [SIAP], 2017), and in 2014, they represented 59 % of the total national production. Strawberry prices have been a factor in the growth of exports; since mid-1980, the export price has been higher than that of the domestic market (Sistema Nacional de Información e Integración de Mercados, 2017).
Strawberry cultivation in Mexico is of great importance from a socio-economic point of view. According to data registered in the Agrifood and Fisheries Information Service (SIAP, for its acronym in Spanish), in 2010, Mexico reached a cultivated area of 6,282 ha with different strawberry varieties, which contributed to a production of 226,657 t with a value of more than 2,102 million pesos (Secretaría de Agricultura, Ganadería, Desarrollo Rural, Pesca y Alimentación, 2017). This crop has gained recognition in agro-industrial products and importance worldwide.
In Mexico, strawberry production has shown growth attributed to programs focused on promoting agriculture and applying production methods. The country produced 95,006 t in 1994 and 36,042.6 t in 2012; the leading strawberry producing states are Michoacán and Baja California, with more than 90 % of the total production (SIAP, 2015).
The value of strawberry production in Mexico was 369 million dollars in 2014 (SIAP, 2015), similar to the production of the state of Florida in the US (333 million dollars), which was only surpassed by the one obtained in California (Guan et al., 2015). Mexico is the main strawberry supplier to the US, with about 95 % of the total volume of its product imports (Hee et al., 2017). The geographical proximity between both countries, the limited production in the US during the winter (Arnade & Kuchler, 2015), the quality of the Mexican strawberry (Estrada-Chavira et al., 2017), and the lower production costs in Mexico (Wu et al., 2015), contribute to the increase in Mexican strawberry exports to the US.
In the productive context, of the 11,092 ha sown in 2016, 89.78 % of the surface is mechanized, 65.63 % has technology applied to plant health, and 87.14 % of the planted territory with this crop received technical assistance. On the other hand, 56.96 % of the total production is temporary, while, in irrigation modalities, 0.74 % uses drip irrigation, 3.54 % performs it through sprinkling, 2.98 % by gravity, 0.01 % by pumping, and the rest uses unspecified irrigation methods (SIAP, 2017).
Regarding the strawberry production worldwide, the US ranked first in 2012 with 1,366,850 t (40 %), Mexico ranked second with 360,426 t (10 %), Turkey ranked third with 353,173 t (10 %), and Spain ranked fourth with 289,900 t (8 %) (FAOSTAT, 2015). Table 1 shows the average harvested area, yield, and production from 1983 to 2013. During the last 31 years, the average world strawberry production was 4,229,072.29 t and had an average growth rate of 2 %.
Table 1 General indicators of world strawberry production (average), 1983-2013
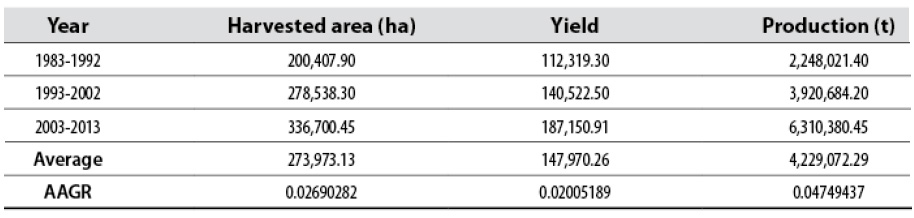
AAGR:average annual growth rate
Source: Elaborated by the authors based on FAOSTAT (2017)
From 2003 to 2013, production exceeded the total average from 1983 to 2013, with more than 6 million tons and average annual growth of 4 %. The main strawberry producing country worldwide during the period analyzed was the US, with an average of 837,164.97 t. In 2013, the US achieved a production of 1,382,096 t, and Mexico, in second place, obtained a production of 379,464 t (FAOSTAT, 2015).
Worldwide, strawberry exports averaged 457,703 t in the analyzed period. In 2013 there was an export of 839,151 t, i.e., 13,218 t less than in 2012, which was the most important year for strawberry export with 852,369 t in total. For 2013, a value of $2,330,136 was obtained, and between 1983 and 2013, the average was $971,262 (FAOSTAT, 2017).
In 2011, the leading strawberry exporters were Spain, the US, the Netherlands, Belgium, and Mexico; the latter exported 76,890 t that corresponded to $142,053. The main export destination was the US, which concentrated 96 % of the production to complement its demand. The data places Mexico in second place in strawberry production and in fifth place in world exports. The leading importing countries are Canada, the US, Germany, France, and the UK; Canada and France ranked first in terms of the value of their imports, with $319,463 and $267,669, respectively (FAOSTAT, 2015).
The average strawberry imports during the last 30 years corresponded to 464,649 t. The year 2012 was the most important for imports with 919,454 t corresponding to $2,502,883 on average. The main destinations for Mexican strawberry exports are the United States (99.92 %), Canada (0.02 %), the Netherlands (0.02 %), and Japan (0.02 %) (Hernández-Soto et al., 2011). The data reflect a concentration of exports to the US explained by comparative and competitive advantages (Ramírez- Padrón et al., 2016).
In 2016, the world strawberry market amounted to 9.2 million tons, 5 % higher than the previous year. Market volume experienced a substantial expansion in 2007-2016, with a positive annual composite rate of 5.0 % (IndexBox, 2020).
Among the leading consuming countries during 2016, Turkey is highlighted with a per capita consumption level of 5.2 kg/year, followed by Egypt with 4.9 kg/year, and the US with 4.5 kg/year. However, the highest annual growth in per capita consumption was recorded in Mexico, with an average annual rate of 11.3 % between 2007 and 2016 (IndexBox, 2020).
In 2016, the volume of world exports increased to 860,000 t and had a general upward trend in recent years. There has been a gradual increase during the 2007-2011 period, with 18 % in 2012 and recent slight fluctuations until 2016. The principal strawberry suppliers worldwide, with a combined share of 70 % of exports, were Spain (311,000 t), the US (134,000 t), Mexico (103,000 t), and the Netherlands (56,000 t) (Organización Mundial del Comercio, 2018).
It is necessary to analyze within international markets, exports and imports in an economic context, identifying the degree of competitiveness that one country exerts over another to establish the competitiveness in strawberry production between countries.
Contreras (2000) defines the competitiveness of a product as its ability to participate in the international market following existing market prices successfully. Therefore, a product or an activity can be competitive even when it does not have comparative advantages. Likewise, a product may have comparative advantages, but not be competitive.
Ávila-Arce and González-Milán (2012) conducted a study on the competitiveness of strawberries and their participation in the international market between 2000 and 2007, measured with the relative export advantage index (RXA) and the constant market share index (CMS). The results show that, although Mexican strawberry exports have increased since 2004, they have lost competitiveness.
Ramírez-Padrón et al. (2016) analyzed the competitiveness indices of the Mexican strawberry trade between 1994 and 2012 using the relative trade balance index (RTB), the traceability indicator (Tij), the trade dependency coefficient, and the degree of openness in exports. The results obtained reflected that the strawberry produced in Mexico is internationally competitive. Similarly, Pat-Fernández et al. (2016) calculated competitiveness indicators in the international market for the 1994-2010 period. Through the analysis of the RTB index, the Tij, and the commercial dependence coefficient (Glij), these authors verified that the strawberry crop is competitive at the national and international levels.
The competitiveness analysis requires variables such as the apparent national consumption, the RTB indicator, the procedure indicators —that allows following the evolution of a product in each of its stages—, the Glij, the export index, and the degree of opening to exports (Rojas & Sepúlveda, 1999).
Given the global importance of Mexican strawberry production and trade, the aim of this study is to determine its competitiveness in the US market compared to strawberries produced in Spain, its behavior within this market, and the identification of the moment when the Mexican strawberry is and ceases to be competitive during the 1992-2017 period. This analysis will allow corroborating the data analyzed by other authors and identifying if the country loses international competition for future decision-making.
Materials and methods
Various analyzes allow measuring the competitiveness and analyze the factors that affect it, to create indicators that measure the development of the economy and describe the competitiveness of important agri-food products for improving the agricultural sector in Mexico (Ávila-Arce & González- Milán, 2012).
Competitiveness is an important measurement factor for the export flows of a country in the international market. When talking about the flow of exports, it is crucial to analyze the competitiveness of the products that are marketed, since the flow is maintained or decreased depending on it. Competitiveness can be measured through indirect indicators such as the market share of the product or the relative export advantage index (RXA), estimated using trade data (Avendaño, 2008).
The Balassa index (1989) was used first to measure the competitiveness in the US market of strawberry in Mexico and Spain. This allows knowing the advantages that a country has in terms of total exports of certain products in a specific market (Hernández-Soto et al., 2011).
Equation 1 is used to measure the revealed comparative advantage:
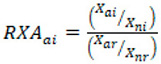 Equation 1
Where RXAai is the relative export advantage of product a in country i; Xaiis the export value of product a in country i; Xniis the total export value (minus product a) in country i; Xaris the value of exports of product a in the world (minus country i), and Xnris the value of total exports (minus product a) in the world (minus country i).
The following scales are recommended to understand this indicator:
Between +0.33 and +1, there is an advantage for the country.
Between -0.33 and -1, there is a disadvantage for the country.
Between -0.33 and +0.33, there is a trend towards intra-product trade.
This index can be calculated in particular cases with reference information from the analysis market (Balassa, 1989).
If the market share of a product is higher than the average, RXA is achieved. The higher the index, the higher the degree of specialization of a country in the product considered, and it will also have a higher degree of competitiveness (Balassa, 1989). Changes in the index show the competitiveness trend of a country's product; if the index has an increasing trend, the country becomes more competitive, and the opposite occurs if the index decreases. It should be noted that this theoretical model assumes the existence of only two countries and does not consider the distortions caused by government policies, which limits result interpretation (Avendaño, 2008).
The degree of openness in exports (GE) index was also used to measure the competitiveness of the strawberry produced in Mexico, which refers to the degree of freedom with respect to the trade and exports of a product. This index shows the share of exports of a product over apparent consumption and the degree of insertion in a specific market (Ministerio de Agricultura y Desarrollo Rural, 2002). Equation 2 is used to calculate this index.
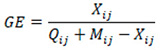 Equation 2
Where GE is the degree of openness in exports; Xij represents exports of product i from country j; Mij equals imports of product i from country j, and Qij is the domestic production of product i from country j.
This is how this indicator is interpreted. If EG is higher than 0, the sector is considered competitive within the country; but if GE is lower than 0, it is a non-competitive sector due to excess imports or demand that does not correspond to the national production. When the value of this index is higher, the product is more competitive. This indicator also shows a degree of apparent consumption (Ministerio de Agricultura y Desarrollo Rural, 2002).
Results and discussion
The US strawberry market is supplied mainly from the state of California; the rest of the demand is imported from Mexico and Spain, two of the largest strawberry exporting countries in the world. In this market, strawberries represent 5.5 % of the value of all fruits in the country, and this is why the US has an important share in world consumption of this product.
Exports of strawberries to the US produced by Mexico experienced a decrease in competitiveness during the last years compared to the early 1990s. Table 2 shows the RXA index for the last 30 years for Spain and Mexico. Overall, although Mexico is increasingly competitive, it is failing to position itself fully in the US strawberry market.
Table 2 Relative export advantage index (RXA) of strawberry from Mexico and Spain to the US market, 1992-2013
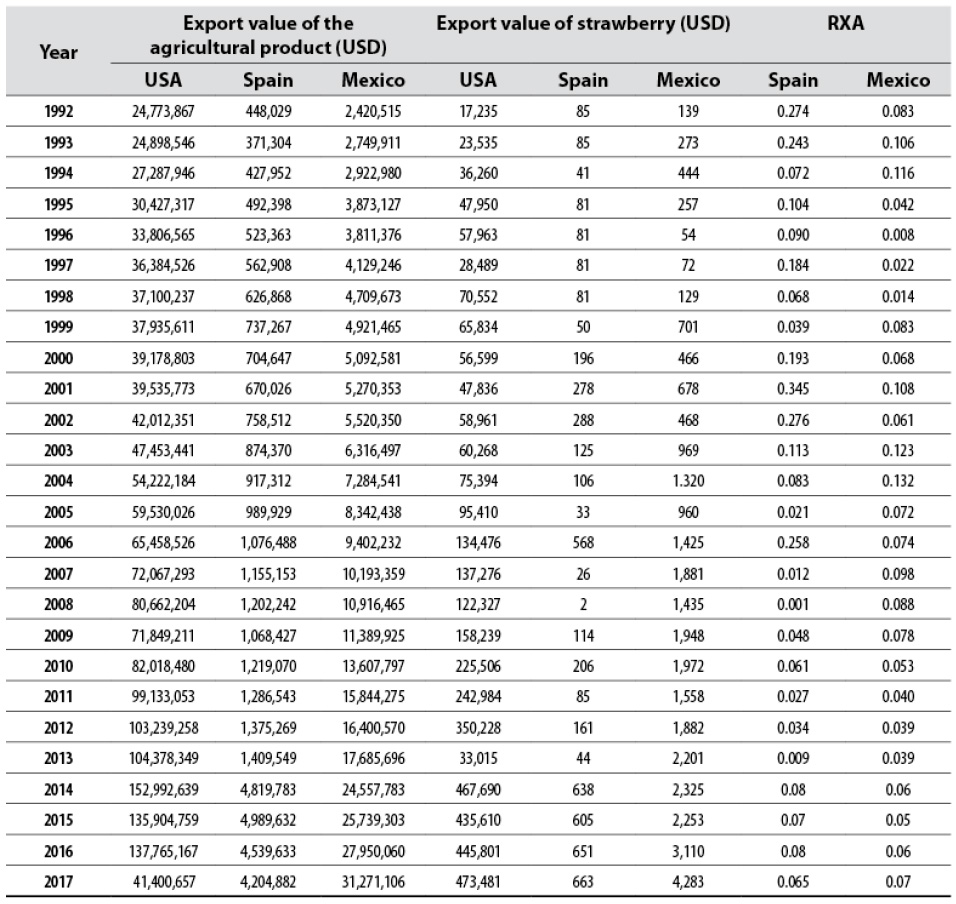
Source: Elaborated by the authors based on FAOSTAT (2017)
For strawberry production in Mexico, the RXA index showed positive results in all the years considered. However, in all cases, its value was less than the unit, indicating a non-significant lack of specialization in the product. The highest result was recorded in 2004, with a value of 0.132 and an average of 0.077 degrees of competitiveness (Fernández, 2011).
Similarly, throughout the period analyzed, Spain shows positive results, but less than the unit. However, it has been losing competitiveness since 2006, with a 40 % drop in degrees of competitiveness. Even so, it reaches an average higher than that of Mexico (0.116). One of the highest values is the one recorded in 2002 (0.276 degrees), followed by the one obtained in 2017 (0.07). Despite this, the competitiveness of both countries is similar for the last year analyzed.
The RXA shows a variation in competitiveness in Mexico and a constant drop in competitiveness in Spain throughout the period, ending with similar values in both countries. Spain's actions in the US market can be interpreted as having reduced its competitiveness, which may be due to a diversification of the market or an increase in exports from Mexico to the US.
Table 3 presents the data corresponding to the foreign trade of strawberries between 1993 and 2017. Substantial growth in exports is observed throughout this period; however, the same does not occur with the degree of openness in exports index, which has decreased due to an increase in production and imports. A number equal to or higher than the unit would indicate that the production of a country is sufficient to supply the domestic market and be competitive in the international market. The average during the analyzed period was 0.0031, and the highest result was reached in 2007, with a value of 0.0060 degrees of openness in exports.
Table 3 Degree of openness in exports (GE) index, 1992-2017
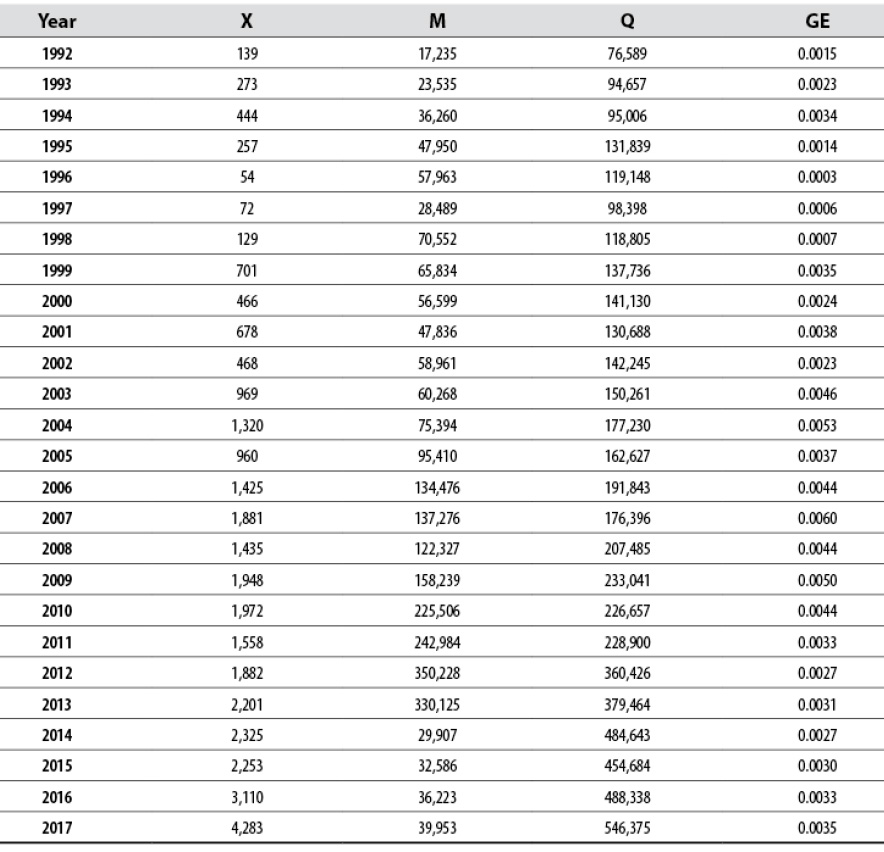
X:strawberry exports M: strawberry imports
Q:domestic strawberry production
Source: Elaborated by the authors based on FAOSTAT (2017)
Like the RXA index, in the 1990s, there was a lower degree of openness in exports (EG) and an increase in imports, with a maximum value of 70,552 t in 1998. After 1999, this index had a significant increase (0.0035) compared to the previous year, and the highest value was recorded in 2007 (0.0060). On average, starting in 2010, a positive GE is observed due to a reduction in imports, but not very significant. The index shows an increase in 2017 that has not occurred since 2007.
During the period analyzed, although the GE behaves positively, the growth of imports is very similar to that of exports. This allows interpreting that the Mexican strawberry production is dedicated to export, and part of the national market is supplied, to a certain extent, by imports, so that the domestic market is neglected.
These results agree with the findings of Avendaño (2008) and Ávila-Arce and González-Milán (2012). Even though Mexican strawberries are competitive in the US market, the results indicate that this sector is losing competitiveness, although it is one of the main suppliers of strawberries in the US. The RXA index shows a drop in competitiveness from 2004.
The competitiveness of Mexico and Spain varies throughout the period analyzed. After a drop from 2009 to 2013, in 2017, Mexico managed to match the degree of competitiveness of Spain. This country has lost competitiveness since 2006, and in 2017, it was surpassed by Mexico.
Conclusions
Mexico is an important producer and exporter of strawberries worldwide. Its main trading partners include the Netherlands, Canada, and the United States, the latter imports the highest amount of Mexican strawberries. The openness in exports of Mexico is close to zero throughout the analyzed period, which indicates that national production supplies the domestic market, and it is necessary to seek new commercial partners. Markets must be diversified, and imports reduced to obtain a higher degree of openness in exports; only in this way, will Mexico be able to compete with Spain and the United States in strawberry exports and will be able to take advantage of the opportunities that this product offers, not only in the US market, but also in other countries.

