


 text in
  English (pdf)
 Article in xml format
 Article references
 Send this article by e-mail
 Cited by SciELO
  Cited by Google
  Similars in
SciELO
Similars in
SciELO  Similars in Google
 Permalink
Introduction
The Castillo coffee variety is a development of the National Coffee Research Center (Cenicafé) marketed since 2005 and derives from the crossing between the Caturra and Híbrido de Timor varieties. It has good cup quality and is low-growing, highly productive, and, primarily, highly resistant to rust (Cortina et al., 2012; Sadeghian, 2017). However, successful coffee-growing depends on climate conditions and agronomic processes, positively influencing production quality and cost. In crop management, fertilization determines the phytosanitary condition by providing essential macro- and micronutrients for coffee growth and development (Holguín, 2018). In this process, nitrogen is directly responsible for generating chlorophyll (Pérez-Urria, 2015) and allows the multispectral identification of plant vigor, nutritional status, and phytosanitary condition.
In the traditional method, nitrogen deficiencies appear as discoloration of leaves (Sadeghian et al., 2014), but this visual characteristic appears late and involves high corrective costs. Vegetation indices allow early identification of the multispectral nitrogen footprint from chlorophyll reflectance using infrared data (Díaz García-Cervigón, 2015). Nevertheless, these data are obtained individually by taking random samples from the coffee crop with field or laboratory equipment, which are expensive and do not show the lot’s general condition.
As tools for precision agriculture, unmanned aerial vehicles (UAVs) or drones carry cameras or sensors that capture images to optimize the spatial and temporal variability management of the crop and its production factors. Multispectral cameras help identify, among others, nitrogen traces and, therefore, plant vigor (Planas, 2019). At present, coffee morphology poses a challenge for implementing this technology, given the overlapping distribution of leaves in the plant.
Nitrogen is evaluated utilizing vegetation indices. One of the most used is the normalized difference vegetation index (NDVI), which evaluates the fluctuation of infrared and near-infrared radiation with values between -1 and 1 (Díaz García-Cervigón, 2015). This index enhances the vegetation as a function of the spectral response and separates it from soil, water, lighting, or other footprints.
This research seeks to present the processing of images captured by a drone-borne multispectral camera to analyze the color degradation related to the coffee plantation’s photosynthetic behavior.
Materials and methods
Drone and camera
The coffee plantation was observed using a remotely piloted aircraft (DJI Phantom 4), which made scheduled flights over the lot from east to west to photograph the crop with a multispectral camera and reduce the effect of slope on the image (García, 2017; González et al., 2016; Vera, 2017).
The images were taken with the professional-grade MicaSense RedEdge™ 3 multispectral camera, which can simultaneously capture five spectral bands: blue, green, red, red edge, and near-infrared. The wavelength and width specifications for each band is shown in table 1. The band information is different because each light spectrum exposes the plants’ heterogeneous conditions or the environment, which generates a multispectral image that records precise quantitative information on crop vigor (MicaSense, Inc., 2015; Quak, 2016; Vera, 2017).
Table 1 MicaSense RedEdge™ 3 multispectral camera specifications
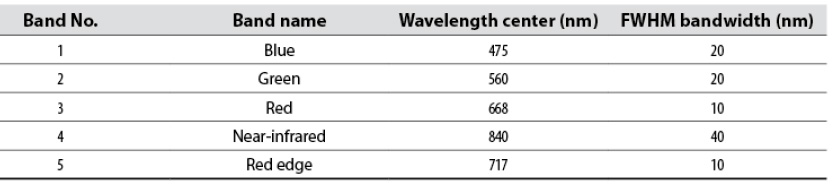
Source: Prepared based on MicaSense, Inc. (2015)
We designed a clamp to attach the multispectral camera to the drone and avoid obstructing the vehicle’s flight functions using a 3D printer that belongs to the Corporación Universitaria Comfacauca.
Global Positioning System (GPS)
For image processing and orthomosaic generation, we employed an eTrex Vista® CX GPS and guide points in the plots for the geographical location of lots in the crop, subplots, and coffee plants, as an anchor to correlate with NDVI data in flight and on the ground. Then, we stitched together the images in the information system to generate the orthomosaics (Bongiovanni et al., 2006; Ibarra, 2012).
Information system
We designed an information system for pre-processing the images obtained by the drone-borne multispectral camera. The images were calibrated, aligned, and stitched together to create an orthomosaic, which is the input to calculate the vegetation indices for each pixel in the image. Thus, we obtained the georeference per pixel and the information on the NDVI, the simple ratio (SR), and the soil-adjusted vegetation index (SAVI).
NDVI evaluation method in plots
The study was carried out in the Technology Park of Coffee Innovation and Coffee Growing (Tecnicafé), located in the village of La Venta, Cajibío, Cauca (figure 1), 13 km from Popayán down the Popayán-Cali Panamericana road (Colombia).
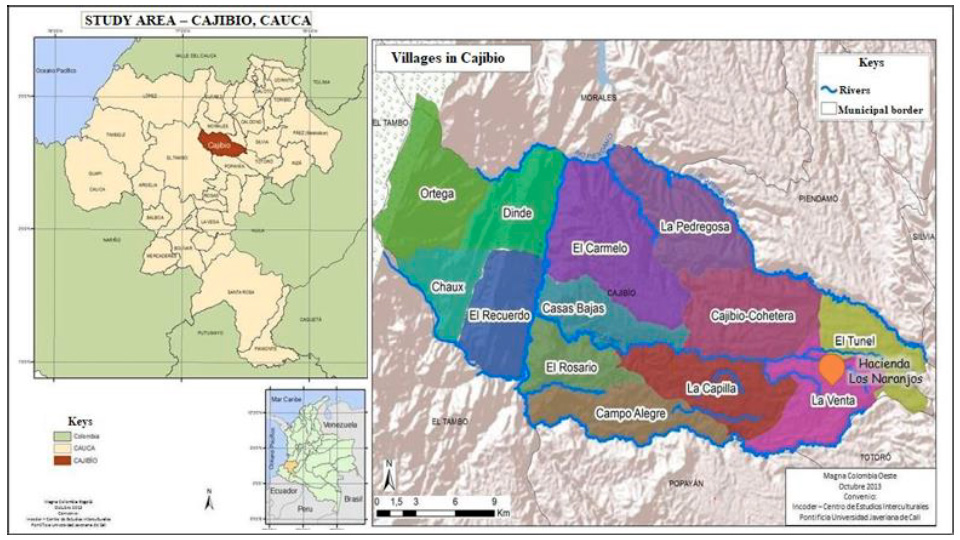
Source: Adapted from La Rota and Salcedo (2013)
Figure 1 Location of the Technology Park of Coffee Innovation and Coffee Growing in the Los Naranjos farm
The validation station of the Los Naranjos farm, owned by Supracafé in the so-called Lot 3 (Supracafé, 2015), has Castillo coffee crops under direct exposure, subdivided into three plots to carry out the procedures described below.
Suitability of coffee crops
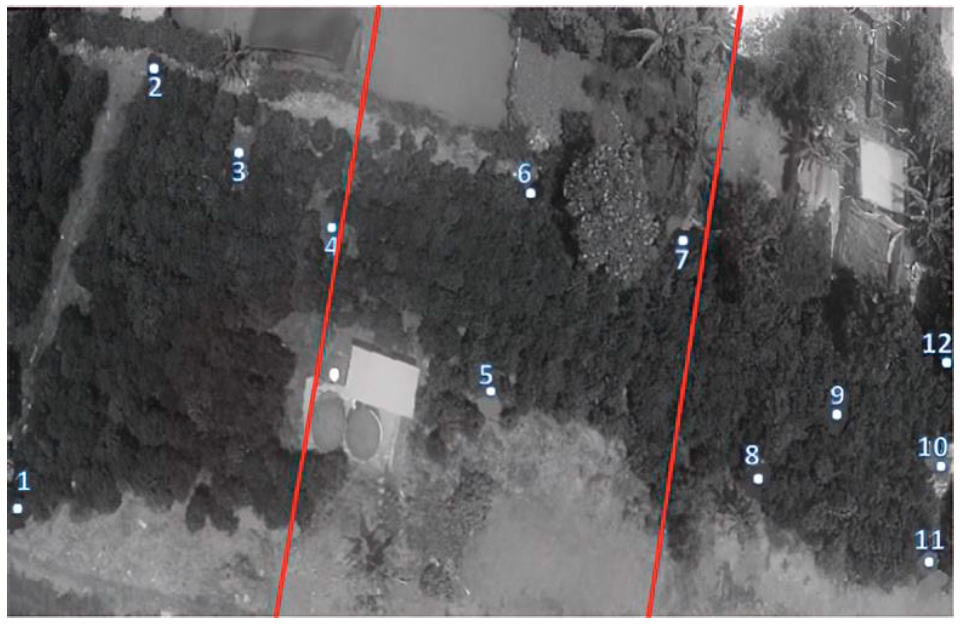
We subdivided Lot 3 of the Los Naranjos farm, as shown in figure 2. Three subplots were distributed from south to north with different soil fertilization conditions: Plot 1 contained a nitrogen surplus greater than 20 mg/m2 in the soil; Plot 2 had an optimal nitrogen level of 15 mg/m2, and Plot 3 had a nitrogen deficit with less than 10 mg/m2. In these plots, we established 12 anchor points to guide the flights; therefore, each plot had 285 Castillo coffee plants in the production stage under direct exposure and a sowing density of 3.5 plants/m2.
The flights over the crop were scheduled once a week at zenith during the six months of the lot’s production stage (flowering to harvest). The flights were made in a zigzag pattern from east to west (up and down) and 25 m high to reduce the effect of slope on light reflectance. We took approximately 600 images with a resolution of 1,280 × 960 pixels and georeferenced information per flight (González et al., 2016; López, 2014).
Orthomosaic processing and NDVI calculation
The images were processed using software developed in Matlab called the Georeferenced NDVI Image Processing and Viewing Information System, which balances the color and corrects the geometric distortion with an average spatial resolution of 10,200 × 1,320 pixels to create a continuous mosaic of the whole crop, maintaining the properties of the image. The photographs were processed to reduce the effect of sun exposure and the intensity of light levels in the environment, requiring a) radiometric calibration, b) image calibration, c) geometric calibration, and d) image alignment. Thus, we reduced the margin of error between bands (Marcovecchio et al., 2014) and generated two orthomosaics of the electromagnetic spectrum (figure 3).
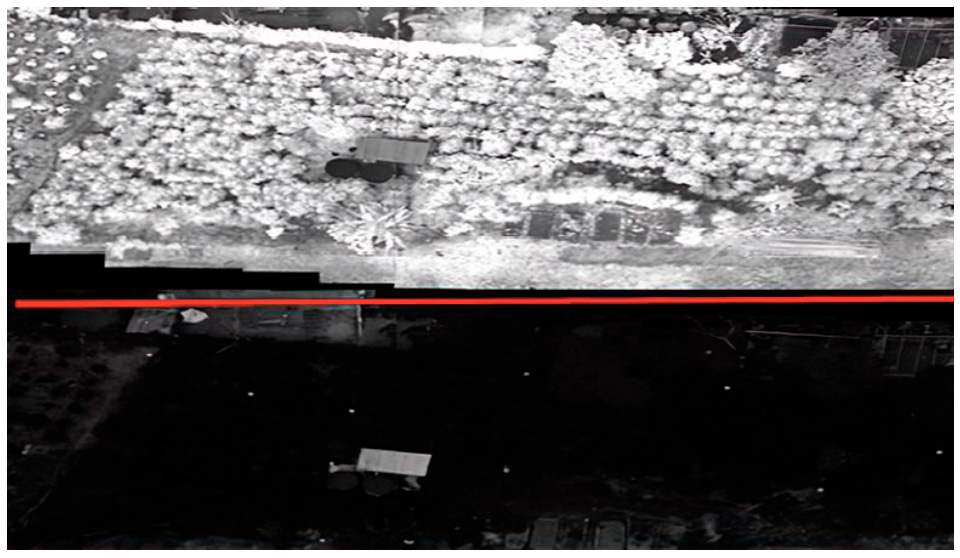
Source: Elaborated by the authors
Figure 3 Distribution of the cultivation lot for the experiment. At the top is the near-infrared (NIR) band and, at the bottom, the red band
Then, we combined the visible and infrared spectral bands from the multispectral camera with a mathematical operation between bands to graphically represent some plant characteristics, such as vigor and water stress. To calculate the NDVI, Equation 1 was used (Castro, 2013; Díaz García-Cervigón, 2015):
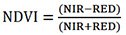 Equation 1
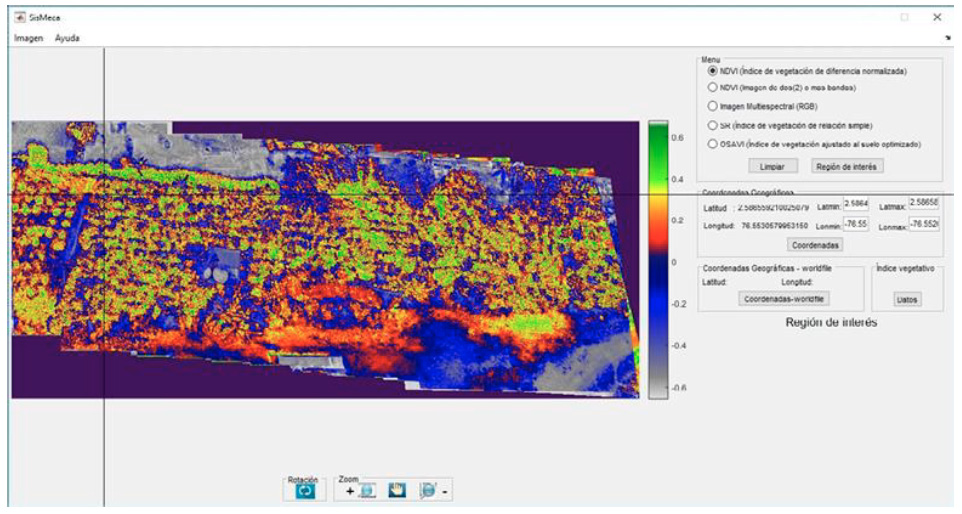
NIR symbolizes the infrared band pixel values, and RED represents the red band pixel value in the arithmetic calculations per pixel. The software maintains the georeference per pixel based on the geopositioning of the anchor points to view the NDVI and the georeference of the image at any point in the crop (figure 4).
Ground tracking for system validation
The plant NDVI in the subplots was monitored on the ground using a leaf spectrometer to evaluate the information system calculations. The plants sampled on the ground were selected with the Cinco de Oros method (Montoya-Bonilla et al., 2017) to take the four edges and the center of each plot (figure 5). Thus, we completed 19 groups of five plants each, for a total of 95 plants per subplot, representing 33 % of the total lot to maintain the study’s uniformity.
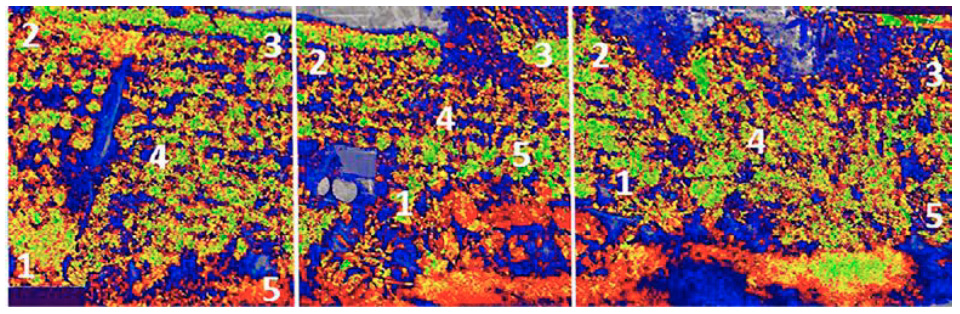
Source: Elaborated by the authors
Figure 5 Sampling distribution according to the Cinco de Oros method for ground and air data
We evaluated the selected plants with the NDVI with the GreenSeeker handheld leaf spectrometer, a portable sensor to measure crop vigor on the ground through a beam of light refracted at 30 and 500 cm above the plant (Botero, 2009; Del Valle et al., 2015). In the comparative analysis of the data collected on the ground and in the air, the Tukey test yielded an error range of 5 % with no significant differences in the index measurements between the plots and the ground and air data.
Results and discussion
Correlation of NDVI data
The NDVI of the soil crop (ground data) was measured with the leaf spectrometer to verify that the NDVI data obtained by the software were representative (air data). We classified the data obtained into two periods: the flowering months (M1) and the fruiting months (M2), both in flight (M1V, M2V) and on the ground (M1T, M2T) (table 2).
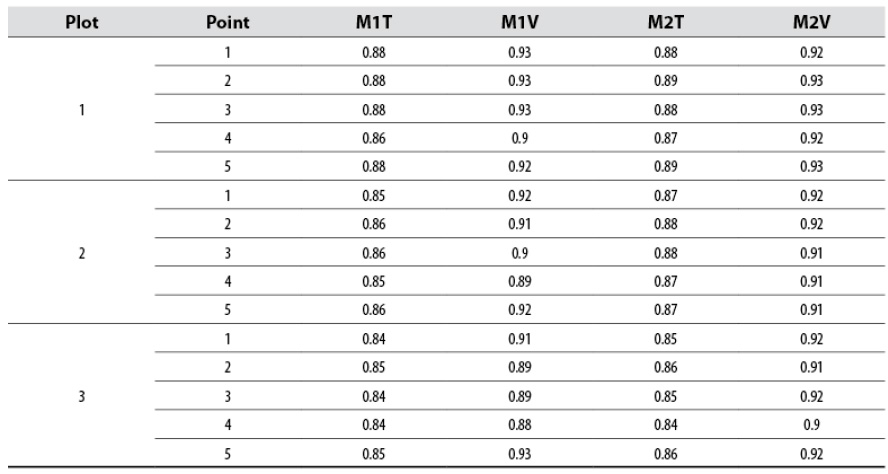
The comparison of results shows that the ground data recorded a vigor close to 0.85, representing the plants’ good nutritional status in the two phenological periods (Meneses-Tovar, 2011). Moreover, the in- flight data maintain the spatiotemporal behavior, although they report a higher vigor index with an average NDVI of 0.93 (figure 6).
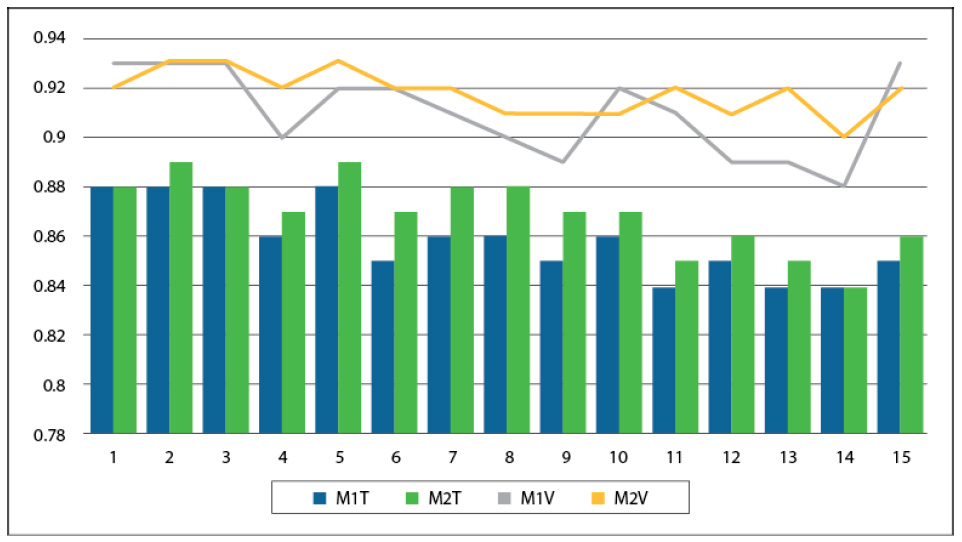
Source: Elaborated by the authors
Figure 6 Vigor data on the ground and in flight during the two periods studied
Tukey’s test indicated a 5 % significance (García-Villalpando et al., 2001; Silva & De Azevedo, 2016), showing that the nutritional difference in the soil either with the variations in nitrogen concentration or with the temporality represented by the phenological states (flowering and fruiting) did not cause significant spatiotemporal differences between plots. While we observed different nitrogen concentrations in the soil, this variation was not noticeable when measuring the NDVI with any method since the leave reflectance was evaluated and showed that vigor in adult plants was not affected (table 3).
Table 3 Average NDVI on the ground and in flight
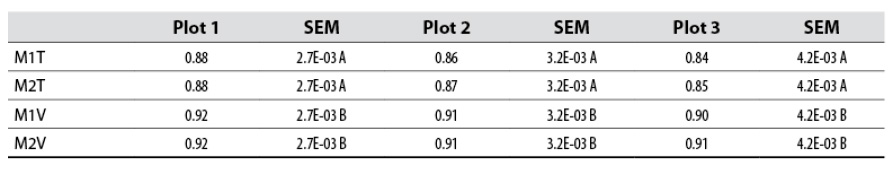
Means with the same letter are not significantly different (p = 0.05).
Source: Elaborated by the authors
The data taken by the drone, like the data collected on the ground, did not show significant differences between the plots and the flights made. However, differences between the ground and flight sampling methods were probably due to increased reflectivity units emitted by the ground and the variation in plant distance in relation to the spectrometer and the drone (Muñoz, 2013). To reduce these errors, it is essential to maintain uniformity in the sampling method and time and position the camera correctly so that the surrounding vegetation does not alter the amount of light.
The presence of different plant covers in the crop area increases the reflectance within the pixels, producing a perception of greater vigor in the multispectral image taken by the drone (Aristizábal, 2017). The difference in the slope of the ground line influences the reflectance of red and near-infrared bands. These factors must be considered when capturing the images with the multispectral camera to reduce variations in measurements (Castro, 2013).
Conclusions
UAVs or drones are a useful tool to optimize precision agriculture as they provide real information on the growing areas and reduce the time and effort required for monitoring. The multispectral imaging showed spectral traces of different crop characteristics, including plant vigor and vegetative state.
Multispectral sensors allowed NDVI analysis, and data processing in the information system made it possible to calculate the SR and SAVI. Likewise, the crop vigor was analyzed based on infrared reflectance by examining the plants, land conditions, and the environment.
The flowering and fruiting stages of Castillo coffee in crops under direct exposure did not show differences in the NDVI. The significant differences between the sampling methods reflect the need to carry out new studies or complementary processes that exclude reflectance errors given by the soil characteristics, slope, and plant cover associated with the crops.
Developing software in MATLAB to process the images allowed us to calculate the NDVI and obtain the georeference; however, further calibrations are recommended until obtaining better results. The multispectral image processing revealed a large amount of data related to the external factors that affect coffee plantations. The information system developed in the study facilitates the processing of these data and generates a view for their analysis. In general, the use of information systems based on multispectral imaging and geolocation establishes a more efficient production process focused on the early detection of phytosanitary problems.

