


 text in
  English (pdf)
 Article in xml format
 Article references
 Send this article by e-mail
 Cited by SciELO
  Cited by Google
  Similars in
SciELO
Similars in
SciELO  Similars in Google
 Permalink
Introduction
The field of genetically modified organisms (GMOs) in agriculture has been of great debate due to the new technologies that can be used to reduce agrochemicals and productivity problems and given the possibility they offer to fight hunger and poverty in the world (Sicard, 2000). However, the introduction of transgenic seeds has triggered different social, environmental, economic, and possibly public health challenges (Arrázola, 2014). One of the main problems identified by farmers and producers of these seeds is the loss of agricultural diversity, partly caused by horizontal genetic transfer (Sicard, 2000). According to a study by the Food and Agriculture Organization of the United Nations (2015), over the last 20 years, 75% of the agricultural diversity has been lost due to the Green Revolution.
In Colombia, the Andean, Caribbean, and Orinoquía regions are the areas with the most significant genetic erosion in the country, in which some indigenous and peasant communities have lost numerous varieties of basic crops such as maize or corn, beans, cassava, potato, banana, rice, yam, tomato, fruits, medicinal plants, and other tubers (Red Semillas Libres de Colombia and Grupo Semillas, 2015).
Another of the problems identified is the loss of fauna and the microbiota that inhabit the soil. Some arthropods, worms, and microorganisms provide benefits to the soil of the agricultural ecosystem as they mix the upper layers, redistributing nutrients and increasing soil infiltration (Secretaría del Convenio sobre la Diversidad Biológica, 2008). However, this characteristic is lost when modified crops cause the death of some insects that fulfill these functions (Peterson et al., 2011).
In addition to altering the fauna, the introduction of transgenic seeds affects the regulation of services, since, by modifying the water cycle, in some occasions, a greater demand for this resource is generated (Reyes et al., 2010). Additionally, it also modifies cultural services, since traditional fruits that function as aesthetic and religious values for indigenous communities are lost (Corporación Grupo Semillas, 2017). In 2017, Corporación Grupo Semillas submitted a report to the United Nations on the violation of human rights in indigenous peoples due to the use of GMOs. This report mentions that in Colombia, maize culture is strongly affected in indigenous cultural groups, such as the Kamëntsa, Nasa, Guambiano, Inga, Yanakona, Arhuaco, Kogui, Pasto, Embera Chamí, and Pijao (Corporación Grupo Semillas, 2017).
Monsanto (today Bayer) is one of the leading companies in the agricultural market. In Colombia, this company has commercialized herbicides and transgenic maize, soybean, rice, and cotton seeds in the departments of Córdoba, Huila, Valle del Cauca, Tolima, Nariño, and Meta (Ministerio de Agricultura, n. d.). Its impact on the agricultural sector has been such that, in Resolution 3168 of 2015 issued by the Colombian Agricultural Institute (ICA), it is prohibited to commercialize and exchange creole and native seeds and reserve the crop harvest, except in rice, soybeans, and cotton (Vélez, 2015). This measure was apparently implemented to protect the intellectual property of the company and prevent the mixing of traditional seeds with transgenic. However, there have been cases of genetic contamination due to the exchange of seeds, pollination, and the dispersal of pollen in air masses (Blanco, 2012).
In Colombia, some GMOs, such as cotton, wheat, soybeans, blue flower, potato, sorghum, tomato, sugar beet, maize, rice, and canola have been cultivated (Resolución 946, 2006). Of the 134 genetically modified crops that were requested to be cultivated, until 2017, 104 have been authorized, and 28 are undergoing authorization processed by Ministerio de Salud y Protección Social, Instituto Nacional de Vigilancia de Medicamentos y Alimentos (Invima), or Ministerio de Ambiente y Desarrollo Sostenible (Resolución 946, 2006), with the highest number of planted and harvested areas in the departments of Meta, Tolima, Vichada, and Córdoba.
In Córdoba, mainly in the municipalities of Tierralta, Montería, and Lorica, traditional maize is cultivated extensively, representing a natural ecological value with a regulatory impact on the ecosystem, and aesthetic and religious values for the communities that inhabit this territory. This is the third department with the highest cultivation of transgenics, a predominant activity in the municipalities of Montería, Ciénaga de Oro, and Cereté (Ministerio de Agricultura, n. d.). The departments in which both transgenic and traditional crops are grown are more susceptible to the loss of native species and have a higher risk of ecosystem alteration when the area planted with transgenics is significantly larger than traditional crops (Chaparro, 2009). In such cases, it is necessary to study the land involved to know the possible risks of these practices. Additionally, the transfer of genes to wild populations depends on several factors: there must be a transport mean, and wild species must be sexually compatible, grow together in the same place and flourish at the same time (Chaparro, 2009).
Gene flow risk depends on the crop as some do not receive the gene, either because of distance, different flowering times, or due to the difficulty in receiving genes not belonging to their genotype. Furthermore, in recipient plants, there is the possibility that the transgene is lost in subsequent generations (Chaparro, 2009). However, if gene flow occurs, it can generate risks associated with the evolution of aggressive invasive species and the extinction of native species.
The aim of this work was to determine the probable distances that a mass of transgenic maize pollen grains reaches according to the climatic conditions throughout the year in a plot cultivated in Tierralta, Córdoba, using the Hysplit® model. In this way, the areas exposed to this pollen mass can be established according to the time of the year. For the analysis of the results, the recommendations of Aylor et al. (2006) and Fonseca and Westgate (2005) on the maximum distance that pollen grains travel below the advective boundary layer, which is generally 1 km, was considered. Based on this, the current study focused on the transport that occurs on the surface of the atmosphere, i.e., 2.5-100 m above ground level, so the considerations that could result from their travel above the advective boundary layer are beyond the scope of this work.
Materials and methods
Location of the transgenic maize crop
Currently, in the department of Córdoba, rice and maize represent 9 % and 35 %, respectively, of the total planting between traditional and genetically modified (GM) crops. Likewise, the department has minimum percentages of beans, sesame, watermelon, tomato, pumpkin, sweet pepper, aubergine, and other vegetables (Portafolio, 2018). Regarding transgenic maize, the harvested area and production have shown slight changes between 2007 and 2017. The production showed an increase from 2012 to 2015, perhaps due to the implementation of the Free Trade Agreement with the United States in 2012, thanks to which several GM seed industries began to sell their products in Colombia. The area has also showed growth since 2012, although the changes have not been as significant as in production. This translates into higher production with less use area, possibly thanks to the efficiency of transgenics. In the department of Córdoba, more municipalities grow traditional maize (23) compared to those that cultivate transgenic maize (16). Despite this, the total area planted with GM maize among the 16 municipalities exceeds the area with traditional crops.
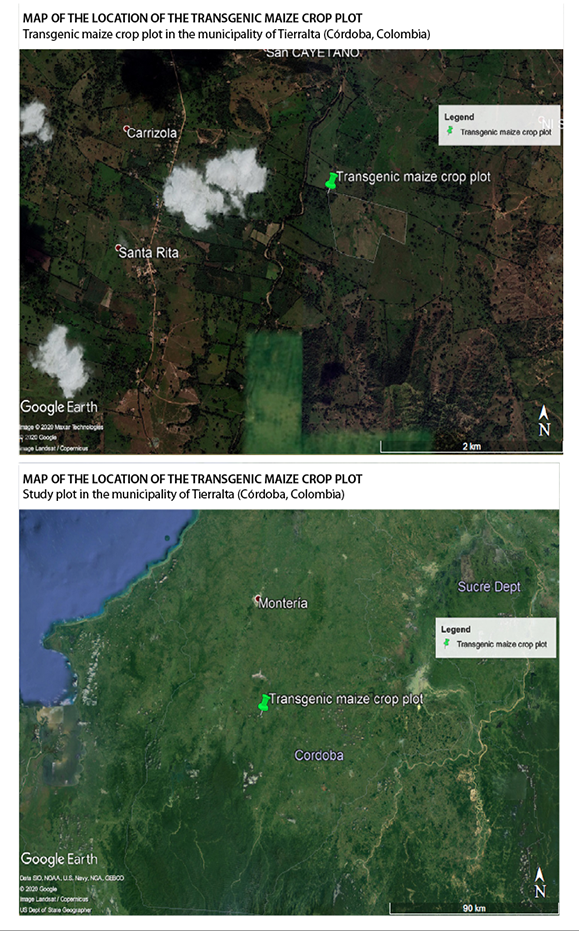
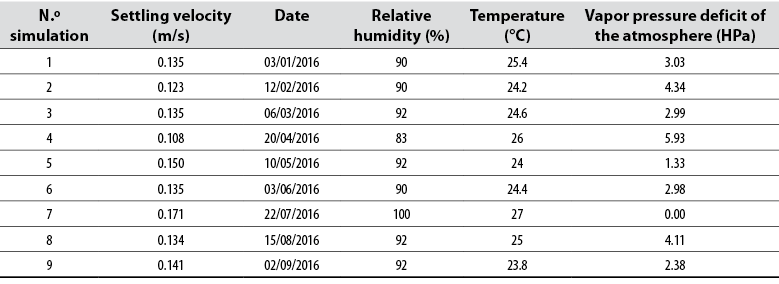
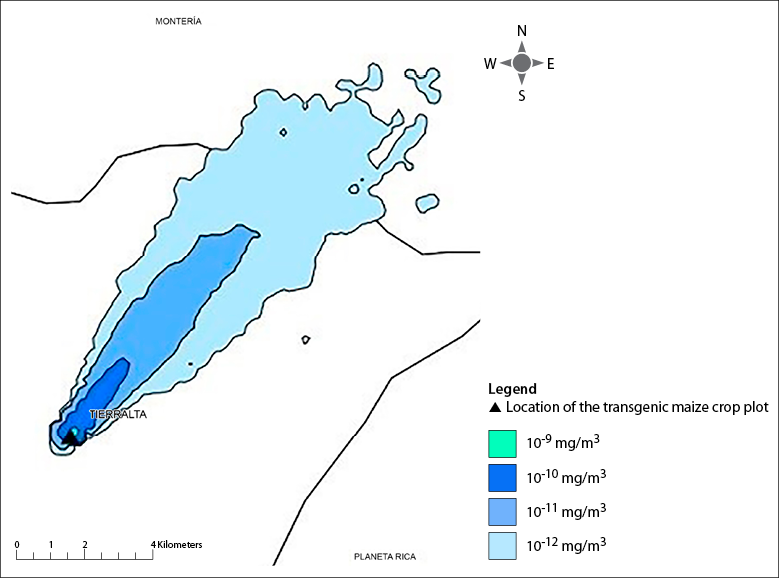
Due to the reserved information on the location of the crops provided by the different agencies in charge of the sale and supervision of transgenics, this study decided to use the information that Organización Nacional Indígena de Colombia [National Indigenous Organization of Colombia] (ONIC) presented in its reports on the location of transgenic and creole crops in Colombia (Semillas de Identidad, 2018). Thus, it was possible to establish a tentative polygon with modified maize in Tierralta, Córdoba, in 2015 (table 1, figure 1).
Table 1 Location of the transgenic maize crop plot in the municipality of Tierralta, Córdoba
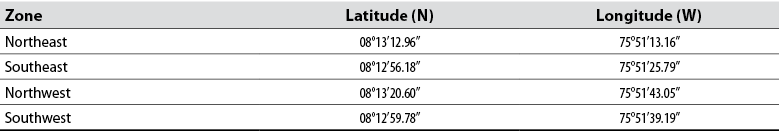
Source: Elaborated by the authors
Hysplit®
The Hysplit® (Hybrid Single Particle Lagrangian Integrated Trajectory) model was used to model the dispersion of particles by the wind depending on their weight, diameter, deposition velocity, and environmental conditions.
The Hysplit® model works in two ways: the first (backward) allows establishing whether the high levels of contamination in one place are caused by the transport of pollutants from another place, i.e., the routes of origin; the second (forward) is used to predict how an air mass behaves with respect to certain meteorological conditions, that is, the dispersal routes (National Oceanic and Atmospheric Administration, n.d.). The limitations of this model include the following: a) it does not consider complex terrain or structures such as buildings that can interfere with the dispersion, b) it does not take into account chemical reactions, c) it does not consider resuspension, and d) it assumes that the emission rate is constant.
Transfer feasibility
Viability is the ability of pollen grains to develop (Corazza et al., 2016). This quality decreases as the moisture content of the grain decreases; moisture loss, in turn, is determined by the vapor pressure deficit of the atmosphere: if the atmosphere is hot and dry, the deficit is greater, and the pollen grains lose moisture and viability. In cold and humid conditions, humidity retention produces higher viability (Viner & Arritt, 2010).
The vapor pressure deficit decreases with height, so pollen is more viable when it is at a height between 100 m and 1,000 m above the ground level. Moreover, the horizontal winds at this altitude are stronger, making transport more efficient. Maize pollen grains can rise to 1,000 m above the ground level, and if they exceed this height, pollen viability becomes unpredictable due to increased vapor pressure deficit, a slight increase in temperature, and constant wind velocity (Corazza et al., 2016; Viner & Arritt, 2010). Viner and Arritt (2010) recommended that if a pollen dispersal model is elaborated with only meteorological data, the most adequate is to consider the information below 150 m of altitude.
On the other hand, given that the dispersion of maize pollen varies according to meteorological characteristics, it is expected that its dispersion and viability will change throughout the day and year. According to Marceau et al. (2011), in France, the onset and peak of maize pollen emission start in the morning, but are delayed when the relative humidity is high, and the wind speed is low. Likewise, Martin et al. (2010) observed that in the United States, the dispersal of herbaceous pollen begins in the morning and reaches a maximum at noon, with minor peaks in the afternoon. This same behavior has the maize pollen according to the mathematical model of Viner et al. (2010). In Cuba, this is also the case, as the dispersal of the Poaceae family pollen begins in the morning, reaches a maximum concentration at noon, and decreases in the afternoon (Aira et al., 2018).
According to previous studies, on most days, pollen dispersal begins in the morning hours and reaches its peak at noon, with other peaks in the afternoon. This is because, as the day progresses, the temperature generally increases while the relative humidity decreases, causing the pollen grain to weigh less and travel more (Fonseca & Westgate, 2005).
Concerning viability, in maize pollen exposed to dry and hot field conditions, this quality decreases by 20% in one hour and 100% in two hours (Fonseca & Westgate, 2005). Viability also depends on the receptivity of the pistil, incompatibility reactions, and post-pollination development of the embryo (Fonseca & Westgate, 2005).
Maize pollen characteristics introduced into the Hysplit® model
Pollen characteristics such as weight, density, and deposition velocity depend on the pressure deficit; therefore, these values were modified for each simulation in the model, according to the relative humidity and temperature of the day considered.
Diameter
The diameter of maize pollen ranges from 80-125 μm. In this model, a diameter of 102.5 μm was used, assuming it has a regular sphere shape (Hofmann et al., 2014).
Weight
Its average weight is approximately 0.25 µg and increases or decreases according to the vapor pressure deficit (Baltazar et al., 2015). The regression that was used to determine the weight depending on the vapor pressure is presented later.
Study time
The models were elaborated at 7:00 hours local time (12:00 hours UTC), as between this time and 11:00 hours, the highest dispersion of maize pollen occurs (Daniel & Boffey, 2001, cited by Henry et al., 2003). Similarly, this time was ideal according to the meteorological information available for calculating the settling velocity.
The settling velocity of a particle varies throughout the day, depending on changes in temperature and relative humidity, and the deficit in vapor pressure. Hence, in the morning hours where the humidity is higher, the temperature is lower, and the deficit is low, the particle will increase its weight and settling velocity. This means that it will fall more quickly and reach shorter distances. However, as the day progresses, although the pollen dries and is transported further, it has lower viability, and the germination rate decreases (Chamecki et al., 2011).
Simulation time and season
The simulation was carried out for two hours since the particle loses viability after this time (Fonseca & Westgate, 2005). The maize anthesis months in the department of Córdoba were identified to insert the most probable dates of pollen dispersal in the model. According to Federación Nacional de Cultivadores de Cereales, Leguminosas y Soya [National Federation of Cereal, Legume and Soy Growers] (2018), the largest harvests in this department are carried out in August, September, and October, and to a lesser extent, in December, January, February, and March. Considering that anthesis occurs between 2.5 and 1.5 months before harvest (Ospina, 2015), the anthesis episode in this plot occurred between January and September. For this reason, no simulations were made for October, November, and December.
Study object
A maize plant can release between 5 and 50 million pollen grains per season, so if a density of 7 to 12 plants/m. is calculated, a 1 ha maize field releases about 1,011 to 1,013 pollen grains during the flowering season (Hofmann et al., 2014). According to the literature, an anther of a maize plant contains between 2,000 and 2,500 pollen grains (Ma et al., 2008). Therefore, it was decided that the total number of particles or puffs (according to the language of the model) to be entered into Hysplit® would be 2,500.
Vertical distance
A vertical distance of less than 2.5 m above ground level was chosen to be introduced into the Hysplit® model, corresponding to the height of the maize plant (bottom height), according to Ospina (2015) and a height greater than 100 m (top height), since at a higher height, the study object exceeds the boundary layer and the environmental conditions change drastically (Pasquet et al., 2008).
Settling velocity
The settling velocity of maize pollen ranges from 0.15 m/s to 0.4 m/s with an average of 0.2 m/s. That is, when calculating an average height between 2.5 m and 3.5 m, the pollen will be deposited in 10-20 seconds with calm air (Hofmann et al., 2014). The change in the settling velocity depends on the density of the particle, and the density and viscosity of the air, factors that depend, in turn, on the relative humidity and temperature.
Meteorological information
The Hysplit® model contains a database called the Global Data Assimilation System (GDAS), which runs four times a day and uses an analysis and forecast time of 3, 6, and 9 hours. This program works with three types of grids: 1° × 1°, 0.5° × 0.5°, and 0.25° × 0.25°, which define the resolution of the meteorological data (National Oceanic and Atmospheric Administration, n.d.), i.e., the higher the grid size, the lower the resolution. The 0.25° × 0.25° scale is useful for long-distance dispersion results (Draxler, n. d.). In this investigation, we worked with the 0.5° × 0.5° grid.
Conversely, the data bank of Instituto de Hidrología, Meteorología y Estudios Ambientales [Institute of Hydrology, Meteorology and Environmental Studies] (Ideam, 2016) was used to consult the values of temperature, relative humidity, and wind speed and direction recorded at 7:00 hours (local time) in Tierralta during the 2016 dates considered in the study. This allowed establishing the local environmental parameters that affect the dispersion in the air. The information corresponds to the Caramelo station [13060030] of Ideam located in Tierralta, Córdoba, located 13 km to the northwest of the plot with the transgenic crops. Complementary information from the Maracayo station [13065010] located 20 km to the northwest was also used.
Settling velocity calculation
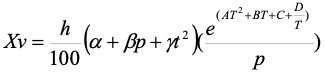
One of the parameters requested by the Hysplit® model is the settling velocity (Vs) of the particle, which depends on the relative humidity and the environmental temperature. This variable indicates the distance that the particle travels and the concentration of the study object in the air mass. Equation 1 was applied each morning (7:00 hours local time) to calculate the settling velocity.
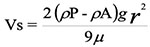 Equation 1
Where ρP corresponds to the density of the particle, ρA to the density of the air, g to the gravity, r to the radius of the particle, and μ to the dynamic viscosity of the air.
Air density (kg/m3)
The air density (ρA) must be calculated first according to relative humidity and temperature, and then insert the corresponding values into equation 2 (LMNO Engineering, Research and Software, n.d.).
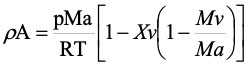 Equation 2
Where p is the atmospheric pressure in pascals (Pa), Ma is the molar mass of the dry air (0,02896 kg/mol), R is the universal gas constant 8.3145 J/kmol, T is the temperature in kelvin, Xv is the mole fraction of the water vapor and Mv is the molar mass of the water vapor (0.0180 kg/mol). To calculate Xv, equation 3 was used.
 Equation 3
Where h is the relative humidity, t is the temperature in centigrades, and constants A, B, C, D, α, β and γ are shown below:
α = 1.0062
β = 3.14 * 10-8
γ = 5.6 * 10-7
A = 1.24 * 10-5
B = 1.91 * 10-2
C = 3.939
D = -6.34 * 10-3
Particle density
The particle density was also calculated by changing the weight according to the relative humidity, temperature, and vapor pressure deficit. The diameter of the particle remains constant, since, as indicated by Bunderson and Leventin (2014), although the particle gains weight when there is higher relative humidity because it absorbs a greater amount of water vapor, the diameter does not change significantly. The amount of mass gained by the particle changes according to the vapor pressure deficit, which depends, in turn, on the humidity and temperature of the environment. The methodology proposed by Gómez and Cadena (2017) was used to calculate the vapor pressure deficit:
1. Saturation vapor pressure at maximum air temperature e0 Tmax (Kpa):
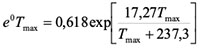 Equation 4
Where Tmax is the maximum air temperature according to the data from the Ideam station.
2. Saturation vapor pressure at minimum air temperature e0 Tmin (Kpa):
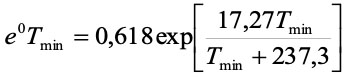 Equation 5
3. Mean saturation vapor pressure (es):
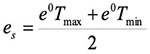 Equation 6
4. Saturation vapor pressure at average air temperature e0 Taverage (Kpa):
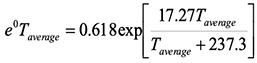 Equation 7
Where Taverage is the air temperature at the time the measurement was carried out (7:00 hours).
5. Real vapor pressure ea (Kpa):
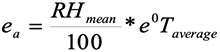 Equation 8
Where RHmean is the humidity at the moment when the measurement was taken (7:00 hours).
6. Deficit E (Kpa):
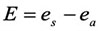 Equation 9
The particle mass (Mp) changes with respect to the deficit, according to the logarithmic relationship of equation 10 (Bunderson & Levetin, 2014).
 Equation 10
This equation was applied for the different study days from January to September at 7:00 hours to find the density of the particle and, subsequently, the settling velocity per day.
Dynamic viscosity of the air
Equation 11 was used to calculate air viscosity (LMNO Engineering, Research and Software, n. d.).
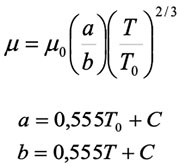 Equation 11
Where μ0 is the reference viscosity in centipoise at the reference temperature T0; this reference temperature is in degrees Rankine, T is the inlet temperature in degrees Rankine, and C is Sutherland's constant. The constants have the following values for air:
Reference temperature (T0) = 524.0 R°
Sutherland’s constant (C) = 120
Reference viscosity T0 (μ0) = 0.01827 cP
With these three variables, it is possible to calculate the settling velocity of the particle with respect to the relative humidity, the temperature of the days, and the time in which the measurement was made in the study. Likewise, the deposition velocity must be considered, which depends on the settling velocity and other aerodynamic factors of the air (Sportisse, 2010). In this work, the deposition velocity was calculated by the model from the settling velocity and the meteorological conditions of the study day.
Results and discussion
To model scenarios, a monthly sample of 21 days was selected, with a reliability of 90% and a sampling error of 10%, which generated a total of 189 simulations for the first nine months of the year. With these simulations, the distances traveled by the maize pollen were measured, and a monthly average was made for the study months. Monthly simulations whose result is close to the monthly average of the distance traveled by the pollen are shown in table 2; these nine simulations are presented as maps that illustrate pollen dispersal in each study day (figures 2 to 10).
Table 2 Settling velocity close to the mean calculated from the meteorological information obtained at 7:00 hours in the municipality of Tierralta
Source: Elaborated by the authors
Source: Elaborated by the authors
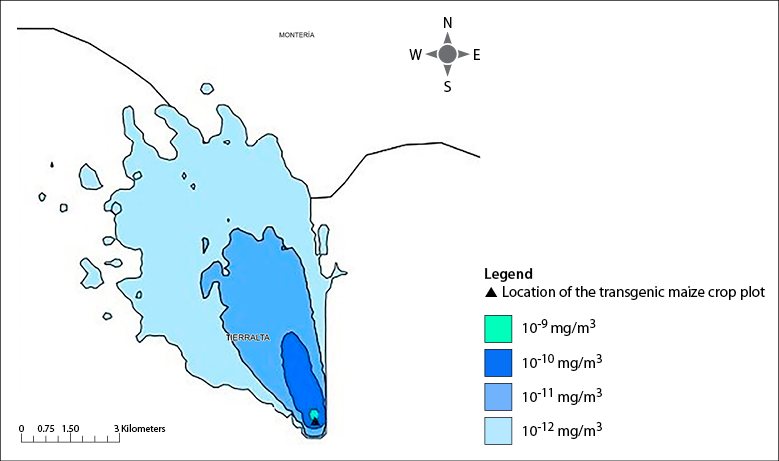
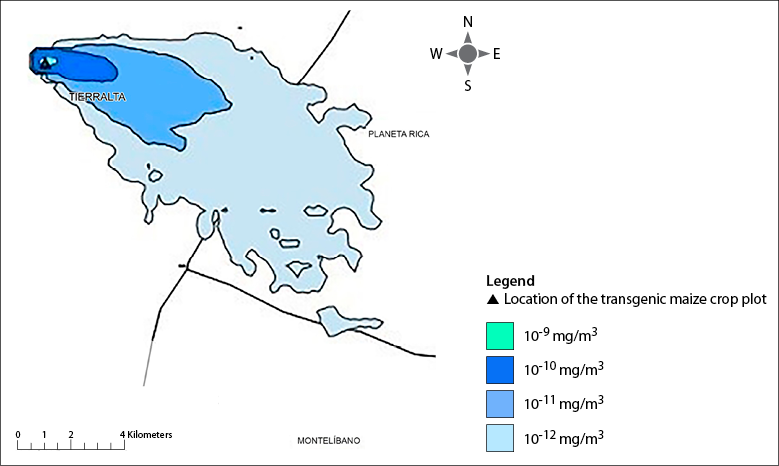
Figure 2 Simulation No. 1 represents the distance close to the mean reached by the maize pollen in January. Simulation day: 03/01/2016
Source: Elaborated by the authors
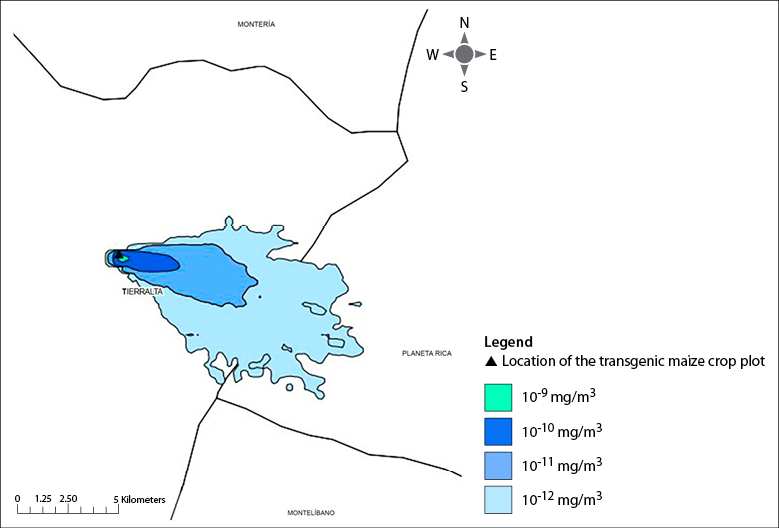
Figure 3 Simulation No. 2 represents the distance close to the mean reached by the maize pollen in February. Simulation day: 02/12/2016
Source: Elaborated by the authors
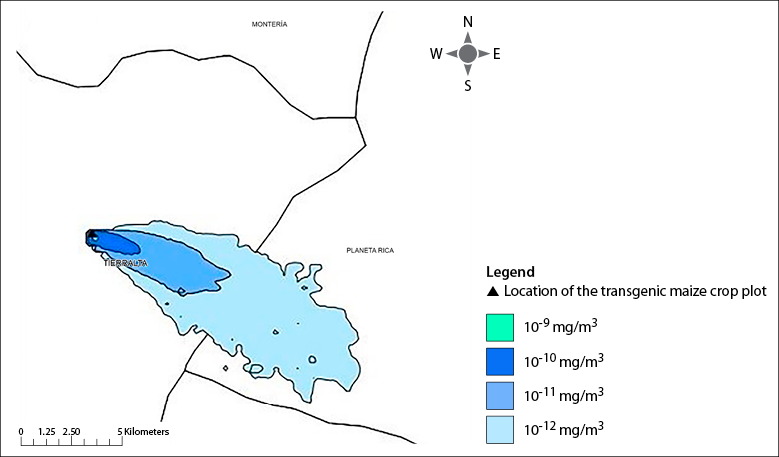
Figure 4 Simulation No. 3 represents the distance close to the mean reached by the maize pollen in March. Simulation day: 03/06/2016
Source: Elaborated by the authors
Figure 5 Simulation No. 4 represents the distance close to the mean reached by the maize pollen in April. Simulation day: 04/20/2016
Source: Elaborated by the authors
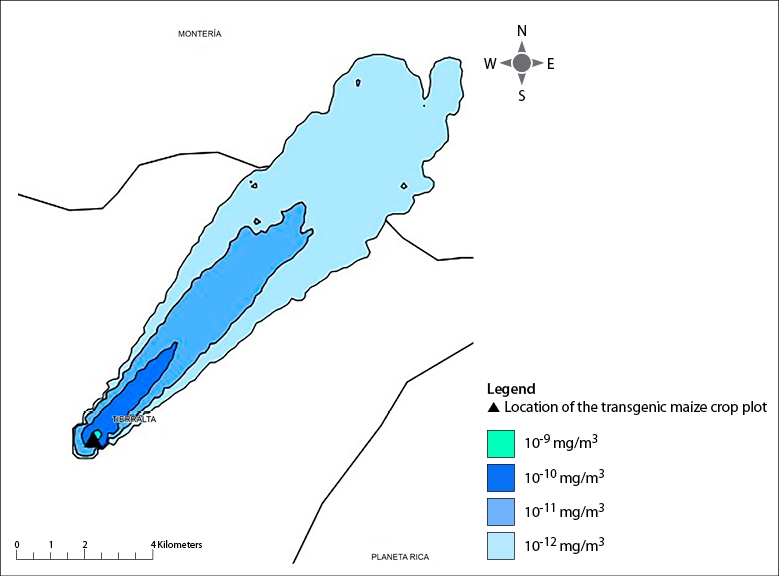
Figure 6 Simulation No. 5 represents the distance close to the mean reached by the maize pollen in May. Simulation day: 05/10/2016
Source: Elaborated by the authors
Figure 7 Simulation No. 6 represents the distance close to the mean reached by the maize pollen in June. Simulation day: 06/03/2016
Source: Elaborated by the authors
Figure 8 Simulation No. 7 represents the distance close to the mean reached by the maize pollen in July. Simulation day: 07/22/2016
Source: Elaborated by the authors
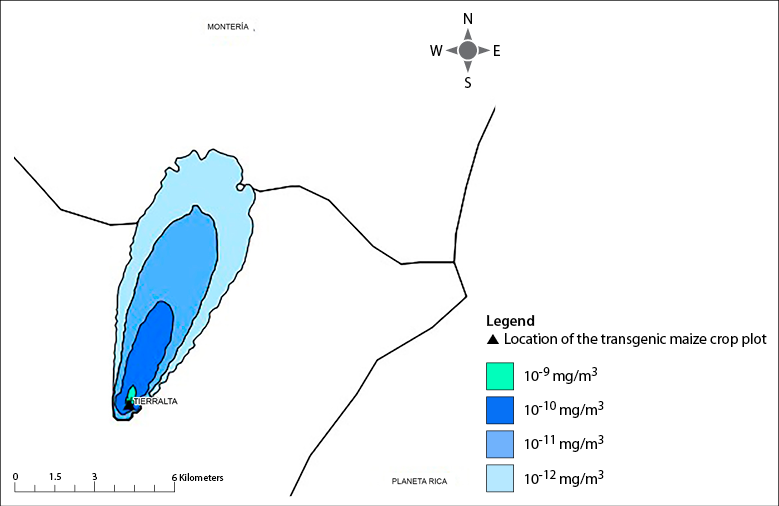
Figure 9 Simulation No. 8 represents the distance close to the mean reached by the maize pollen in August. Simulation day: 08/15/2016
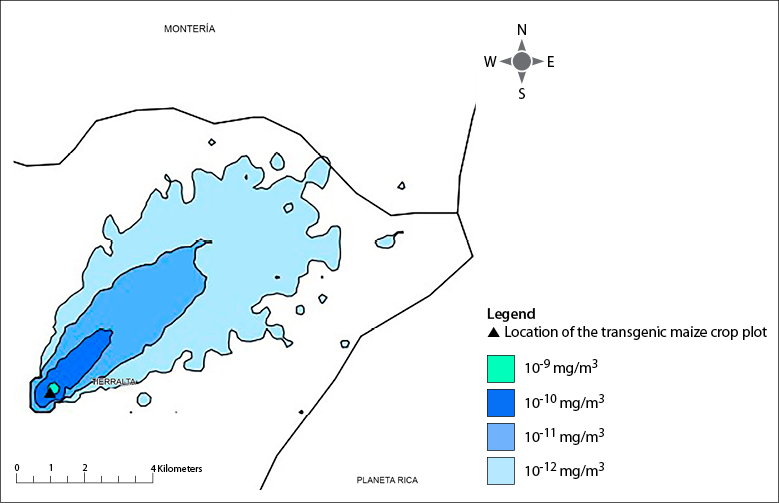
Source: Elaborated by the authors
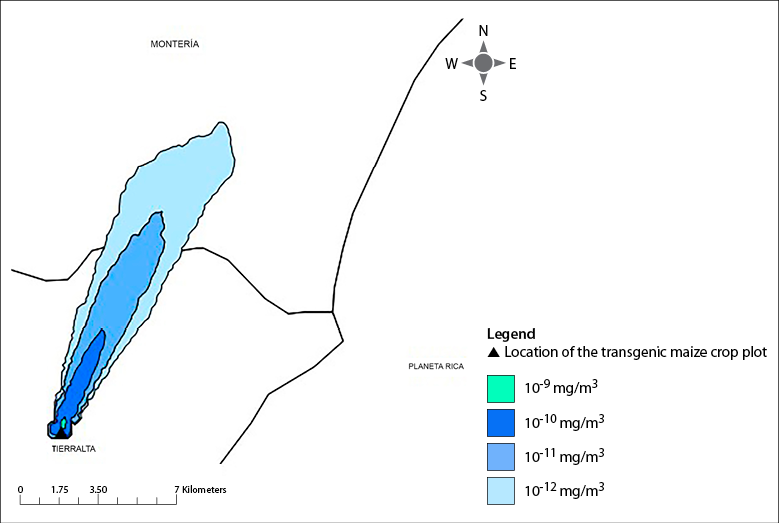
Figure 10 Simulation No. 9 represents the distance close to the mean reached by the maize pollen in September. Simulation day: 09/02/2016
The maps show the different areas affected by pollen dispersal: east-southeast, with a predominance of the northeast direction. Table 3 was prepared with the maps of each study day, indicating the monthly average of the distance traveled by the maize pollen particles from the source, for a mass concentration of 10-9mg/m3.
It is important to note that for this work, a distinction between the settling velocity, which corresponds to a characteristic of the particle, and the deposition velocity, which considers turbulence, direction, and wind speed phenomena, was made (Sportisse, 2010). Thus, it is not expected that during the days when the sedimentation velocity was higher, the distance that the particles traveled would be less, since pollen deposition also depends on the force and the direction of the flows of the mass of air on a specific day. Consequently, for the analysis of the results, no correlation was established between the distance reached by the particle and its settling velocity.
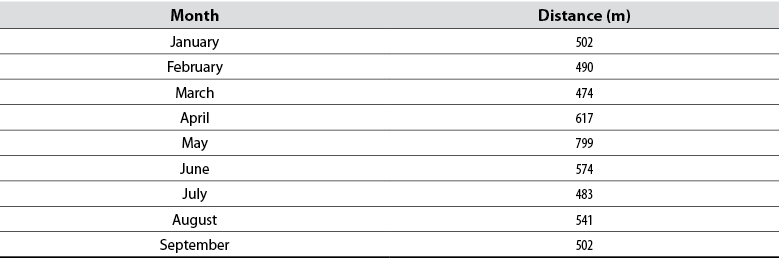
Table 3 Monthly average of the distance traveled by the maize pollen particles from the source, for a mass concentration of 10-9 mg/m3
Source: Elaborated by the authors
Fonseca and Westgate (2005) recommended that, for the advective route, the pollen study must be less than 1 km if it is carried out only with meteorological information. At greater distances, it can be inaccurate since entering the boundary layer, it travels more. Likewise, Viner and Arritt (2010) advised that, if meteorological information is used only at the source, the most appropriate thing is carrying out short-distance studies. If the pollen crosses the boundary layer, this meteorological information could not be extrapolated. For their part, Chaparro-Giraldo et al. (2015) did not record transgenic pollen travel beyond 500 m in the department of Tolima. For this reason, although the model shows greater distances than 1 km, it will only show what happens at shorter distances because the model does not consider the parameters of pollen viability or the entry of grains into the boundary layer according to the variable entered in the "vertical distance" section.
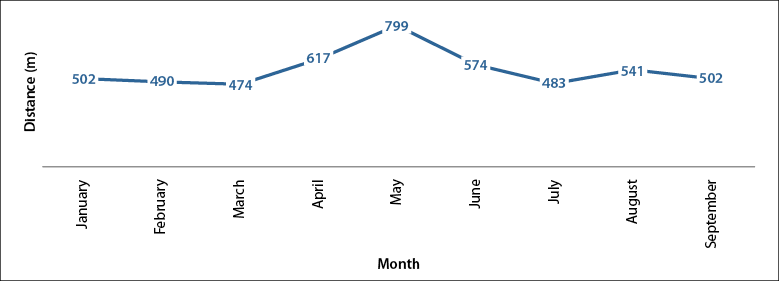
The annual average and minimum values of the distance traveled by maize pollen particles from the source, for a pollen mass concentration of 10-9 mg/m3 is presented in table 4. Subsequently, the monthly average is illustrated in figure 11.
Table 4 Minimum and annual average values of the distance traveled by maize pollen particles from the source, for a mass pollen concentration of 10-9 mg/m3

Source: Elaborated by the authors
Source: Elaborated by the authors
Figure 11 Monthly average of the distance traveled by maize pollen particles from the source, for a mass pollen concentration of 10-9 mg/m3
As can be observed, the annual average of the distance traveled was 584 m, the minimum was 20 m, and the maximum was 1,000 m in all months. The highest average distance was recorded in May with 799 m, and the lowest in March, with 474 m. This may be because the multi-year average wind speed in May is 3 km/h, a high value compared to other months. However, based on meteorological information from other years and considering that May is the month with the highest rainfall and relative humidity (60% on average) (Weather Spark, 2017), it can be inferred that the pollen concentration of maize in the air decreases and, therefore, its dispersion by air also diminishes (Asmae et al., 2017).
Although the highest multi-year wind speeds were recorded in March and April with values between 2.5-3.5 km/h, in the first half of 2016, the El Niño phenomenon was in its last stage, which caused a weakening of the surface winds from January to April of that year (Ideam, 2016). Hence, although a greater distance traveled was expected in the first months of the year, short distances were recorded, and from May, the trend of the pollen path was adjusted to the one of the wind speed throughout the year. If the La Niña phenomenon occurs, rainfall in the Andean, Pacific, and Caribbean regions would significantly increase, and easterly winds in the tropical Pacific would strengthen, according to the record of this phenomenon in 2010 and 2011 in Colombia (Euscátegui & Hurtado, 2011).
The maximum distances were obtained in January and between April and June, which can be explained because in 2016, the maximum wind speed and, hence, the highest wind force –according to its quadratic relationship between speed and force– were reached starting in the second quarter (April and May) when the El Niño phenomenon was in its final stage, with a range between 2-3 km/h and a wind direction coming from the west (Weather Spark, 2017).
Given that the model was applied for a period of two hours, i.e., the time range in which the pollen particle loses 100% viability (Fonseca & Westgate, 2005), it is unlikely that these pollen particles reach such long distances if its settling velocity is relatively high regarding other particulate matter. Moreover, if they reach distances greater than 1 km, the probability of gene transfer is low due to decreased viability in their two travel hours.
The dispersion of maize pollen is a difficult variable to predict because it depends on environmental conditions that differ according to place and season. This means that the theory and model applied in a particular place must be carefully reproduced due to geographical differences.
Conclusions and recommendations
With these results, it is possible to conclude that, for the study area and the simulations carried out, in the first months of the year, the distance reached by the maize pollen particles by dispersion is greater, given that favorable climatic conditions such as low rainfall, high temperatures, strong winds, and low relative humidity occur. However, the dispersion at other times of the year should not be underestimated.
Similarly, the predominant direction of the winds is from southwest to northeast. Thus, dates can be scheduled, and particular places can be established to cultivate transgenics that guarantee non-contamination by pollen of the creole maize fields. However, this measure does not contemplate dispersal by the action of pollinators, which can transport seeds 50 m away if they are frugivores (Franco-Quimbay & Rojas-Robles, 2015), and spread pollen up to 1,500 m if they are nectarivores (Vásquez et al., 2006). This solution does not respond to the social and economic challenges that arise from sowing GMOs, being proposed as a last resort. Climate change and its effects on rainfall and temperature (Mayorga et al., 2011) should be considered to generate greater uncertainty about the displacement of transgenic pollen particles.
A rigorous analysis of the different sources of information is recommended. In this work, data on crops in Colombia were collected from different authors, but the differences between these made it difficult to analyze. Therefore, information from government entities was used. For investigations that require meteorological information, it is recommended to use the Ideam database; if some parameters are not available, international bases can also be used.
For future studies with pollen models in the air, it is recommended to carry out a subsequent validation in the field to obtain more reliable results. Although this calibration was not performed in this work, the results could be used for future research in which pollen samples are collected and verification to know whether they correspond to transgenic maize pollen from the study plot should be carried out.
There is a discrepancy in theories about the distance that pollen particles travel. The results obtained by Hofmann et al. (2014) in Germany, Belgium, and Switzerland with long-term studies to define displacement cannot be extrapolated to Colombia due to climatic differences. For this reason, it is recommended to carry out more studies on the distance that spores and pollen travel in the atmosphere to obtain an indication of their path, their potential effect on creole crops, and their repercussions on other socio-environmental aspects.

