


 text in
  English (pdf)
 Article in xml format
 Article references
 Send this article by e-mail
 Cited by SciELO
  Cited by Google
  Similars in
SciELO
Similars in
SciELO  Similars in Google
 Permalink
Introduction
Papaya (Carica papaya L.) belongs to the Caricaceae family and is native to tropical America, from southern Mexico to Costa Rica. Currently, this fruit is cultivated in the tropical and subtropical regions of the world (Umaña et al., 2011). In Ecuador, the crop is grown in the coastal and Amazon regions, and in 2018, Instituto Nacional de Estadística y Censos (INEC, 2018) reported that at the national level, there were 83,897 scattered papaya trees with a production of 3,893 t. On the other hand, in 2019, Corporación de Promoción de Exportaciones e Inversiones (Corpei) reported that papaya is located in the exotic category, but its demand is lower when compared with pineapple and mango (Granja, 2019).
An increasing number of papaya varieties are cultivated around the world; different cultivars exhibit diverse reproductive morphology, and many have been grown from varieties that are abundant in other regions of the world. The best-known cultivars are the following: a) those with a pear-shaped fruit, greenish-yellow peel, and sweet taste, and b) those with orange-red pulp, high sugar content, and desirable flavor (Nafiu et al., 2019). In commercial papaya plantations, the population density is 1,500 and 2,500 plants per hectare, and the yield is 50-136 t/ha/year (Cruz & Portal, 2010; Rodríguez et al., 2014). However, the productivity of a papaya cultivar is measured when it produces 15-20 kg of fruits (45-50 fruits per plant) in the first year (Alonso, Tornet, Ramos et al., 2008; Vázquez et al., 2010).
In Ecuador, papayas of the varieties Maradol, Tainung, Hawaiian type (Solo, Sunrise, Gram, and Betty), and Criolla (Instituto de Promoción de Exportaciones e Inversiones, 2015) are cultivated. Fruits weighing between 0.2 and 2.0 kg are exported throughout the year (Instituto Ecuatoriano de Normalización [INEN], 2013); the fruits of the Criolla variety weigh 1-3 kg with red-yellow pulp and soluble solids content of 10-11 °Bx. In the Solo or Hawaiana types, the fruits are characterized by being small in size and weighing between 0.4 and 0.6 kg (Gonçalves de Oliveira & Vitória, 2011). Sunset, Sunrise, and Golden Solo cultivars have fruits of 0.5-0.7 kg with soluble solids content of 12-17 °Bx; the Maradol cultivar produces fruits of 1.5-2.6 kg, salmon-red pulp, and a soluble solids content of 12 °Bx. The Formosa (Tainung) cultivar produces 0.90 kg of fruits with soluble solids content from 8-10 °Bx (Ministerio de Agricultura, Ganadería, Acuacultura y Pesca & Agencia Ecuatoriana de Aseguramiento de la Calidad del Agro, 2015).
In the north of the Ecuadorian Amazon, papaya is part of the agroforestry systems of cacao, coffee, and pastures. In these systems, a tree can produce 15 to 50 fruits per plant (5-18 kg/plant); in other words, it has good agronomic traits to become a sustainable crop (Instituto de Promoción de Exportaciones e Inversiones, 2015; Vargas Tierras et al., 2018). However, the size, shape, soluble solids content, and color of the pulp are a limitation for its commercialization; besides, in some plantations, half of their plants have been found to be unproductive.
The study of papaya genotypes in the Ecuadorian Amazon is an alternative for the sustainable production of this fruit, since genes that help increase production, improve fruit quality, withstand environmental changes, and resist/tolerate pest attacks can be found. Currently, consumers prefer small fruits of 500-800 g, elongated, with soluble solids above 11.5 °Bx and orange pulp; for their part, large fruits with an average weight of 801-1,800 g are highly appreciated by the agroindustry (Alonso, Tornet, Aranguren, et al., 2008; Honoré et al., 2019). Therefore, the aim of this study was to compare fruit quality traits of the papaya genotypes adapted to the conditions of the Amazon, to identify potential candidates for subsequent genetic improvement programmes.
Materials and methods
Location and characterization of the experimental site
The study was carried out at Estación Experimental Central de la Amazonía (EECA) of Instituto Nacional de Investigaciones Agropecuarias (Iniap), located in the San Carlos parish of the La Joya de los Sachas canton, Orellana province (Ecuador), at 29°10′13.0″ N, 99°60′33.05″ W, and an altitude of 282 m a.s.l. The climate is mega-thermal (A '), rainy (A), and mostly without lack of water (r); it is characterized by having a humidity index higher than 100 %, average potential evapotranspiration of 135.38 mm, a monthly average temperature of 26.6 °C, and average annual precipitation of 2,955 mm, with a higher humidity period in August and a dry one in May (Poma-Copa & Usca-Tiuquinga, 2020).
Plant material
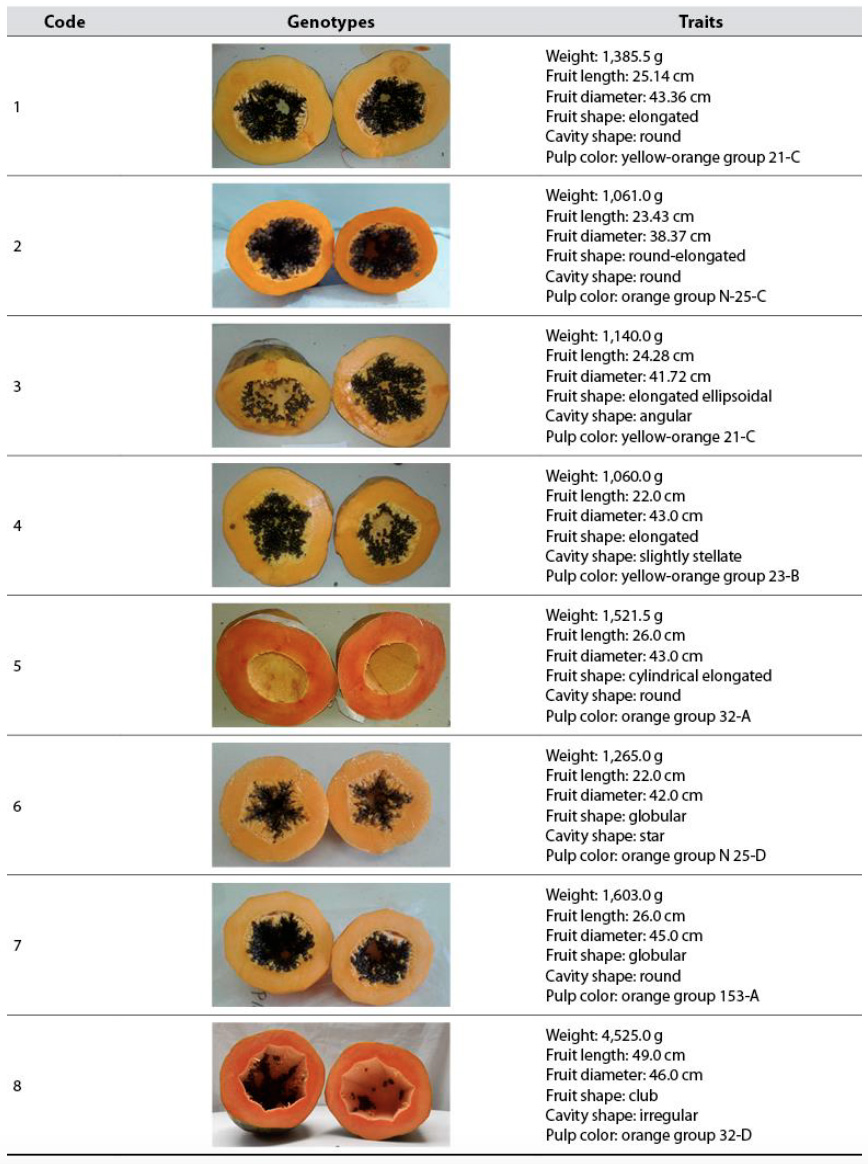
Eight papaya genotypes grown in the agricultural production systems of two cantons of the Ecuadorian Amazon, Shushufindi and La Joya de los Sachas, were collected (table 1, figure 1). Plants with outstanding traits (architecture and yield) were selected, planted in EECA, and, once they reached their harvest stage, the fruits were collected for analysis. Three physiologically mature fruits were harvested from each individual per genotype; subsequently, weight, length, and diameter were recorded. Using the descriptors of the International Board for Plant Genetic Resources (1988), the shape of the fruit and its internal cavity were determined. The pulp color was identified with the 2015 Royal Horticultural Society color table. Each fruit was placed in a plastic bag, labeled with information on its origin and GPS coordinate (table 2), and taken to the EECA Food Quality Laboratory.
Table 1 Collection sites for papaya genotypes in two provinces of the Ecuadorian Amazon
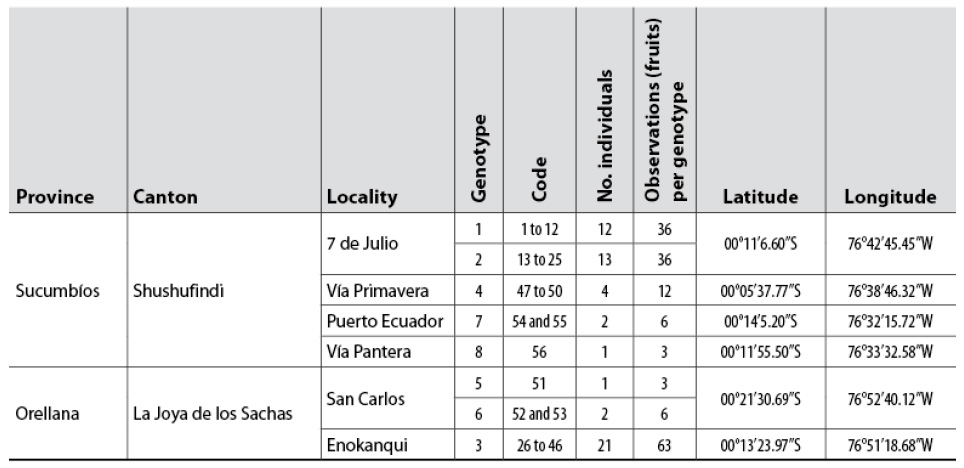
Source: Elaborated by the authors
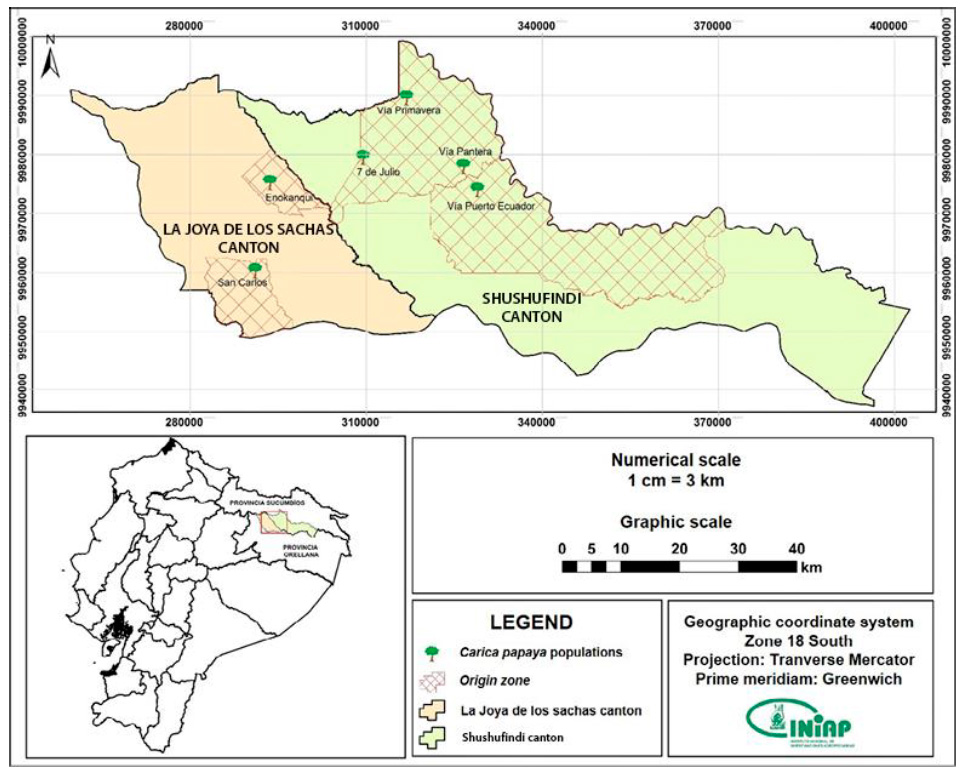
Source: Prepared by Carlos Danilo Congo Yépez
Figure 1 Location of the areas of origin of papaya genotypes in the cantons Shushufindi and La Joya de los Sachas
Specific management of the experiment
The seeds of the collected fruits were extracted, and with these, the segregating population for each genotype was formed. The seeds were planted in black polyethylene bags of 8 cm wide × 15 cm long. Transplantation was carried out after 50 days, for which 30 × 30 × 30 cm holes were made, and the plants were sown at a distance of 2 m between rows and 2 m between plants. The individuals of each genotype were cultivated systematically, and for the analysis, three fruits were harvested per individual of each genotype. The fertilization applied to the field plot was 141 g/plant of phosphorus, 222 g/plant of nitrogen, and 226 g/plant of potassium. Commercial formulas of 12-52-0, 33-0-0, and 0-0-60 divided monthly were used (Mora & Bogantes, 2004).
Eight days after transplantation, preventive controls for fungal diseases were carried out by foliar applications with chlorothalonil 720 g/l and two subsequent applications every 30 days. Thirty days after transplantation, the shoots were removed from the base of the stem and the leaf axils. Between the eighth and the twelfth-week post-transplantation, when the flower bud was 0.5 cm in diameter, sexing was performed (Bogantes et al., n.d.). The harvest began in January and lasted until September, during which the total number of fruits per individual of each genotype was recorded. In the third month of harvest, three fruits were selected per individual for analysis. These fruits showed homogeneous traits, were free of diseases or mechanical damage, and were transferred in a plastic thermos to the Food Quality Laboratory of EECA for the corresponding analyzes.
Study variables
The quantitative variables evaluated were the following: fruit weight (kg), fruit diameter (cm), fruit length (cm), pulp thickness (cm), fruit firmness (kg-f), pulp weight (kg), peel weight (kg), pH, total soluble solids (°Bx), titratable acidity, and flavor ratio. The qualitative variables were: shape of the fruit base, central cavity, pulp, and peel color. The number of fruits per individual in each genotype was also counted to have complementary production data; however, this variable was not considered for the statistical analysis because there were genotypes with only one individual; therefore, only average data were reported.
Quantitative variables
In the Food Quality Laboratory of EECA, the variables fruit diameter, fruit length, and pulp thickness were evaluated with a Mitutoyo digital caliper model CD-6” CS. Fruit firmness was measured with a manual Force Gauge penetrometer model GY-4, with a 7.50 mm diameter point. Then, two readings in the equatorial part of the fruit were done, and the results were expressed in kilogram-force (kg-f) (Sotomayor Correa et al., 2019). Subsequently, the pulp was separated from the endocarp (peel), and the two components were weighed separately; for this, a Citizen Scale digital scale model CG 4102C with a precision of 0.01 g (Sotomayor Correa et al., 2019) was used, and the results were recorded in kilograms. The sample of the three fruits was homogenized, employing a conventional blender to measure soluble solids, pH, and acidity.
Total soluble solids (°Bx) were measured using a digital refractometer (Hanna Instruments brand) model Hi 96801; pH was determined using a model PT-380 potentiometer, and titratable acidity was established by titration with 0.1 % N sodium hydroxide (Sotomayor Correa et al., 2019) until the pH reached 8.1. The value obtained was expressed in grams of citric acid 10/0 cm3. The flavor ratio was obtained through the relationship between the content of total soluble solids (°Bx) and the titratable acidity of the fruit. The previous variables were established with the official analysis methodology of the Association of Official Analytical Chemists (Latimer, 2012).
Qualitative variables
The shape of the fruit base and the central cavity were characterized according to the International Board for Plant Genetic Resources (1988). The color of the peel and pulp were determined using the 2015 Royal Horticultural Society color table, which has four shades: yellow to red, red-purple to blue, blue-green to yellow-green, and grayish. Hence, part of the fruit and the pulp were placed in the central hole and compared with the indicated shade. The selected color was labeled with a number and a letter.
Statistical analyses
A completely randomized design was used with a different number of observations according to the number of individuals for each genotype. Three fruits were harvested per individual of each genotype, so the number of observations varied from three (genotypes 5 and 8) to 63 observations (genotype 3). Consequently, the treatments were comprised of different genotypes. The analysis of variance was performed using the generalized linear model (GLM) and Pearson's bivariate correlations (correlation coefficient ≥ 0.6). Subsequently, Tukey’s means test (p ≤ 0.05) of the eight genotypes was performed.
Likewise, a principal component analysis (PC) was performed and constructed with the correlation matrix, and the factors were selected with Kaiser’s rule until the percentage of the variance explained was ≥ 80 % accumulated. Biplot graphs were constructed to visualize the correlations of the individuals with the variables. For groupings, a cluster analysis was performed using Euclidean distances. Similarly, Bootstrap values were calculated for the larger groups formed in the dendrogram, to reduce bias in the analysis and approximate the variance through random resampling of the initial sample and not of the population. Additionally, Tukey's mean test (p ≤ 0.05) was applied to the grouped individuals. All analyzes were carried out with the SPSS Statistics software (International Business Machines Corporation, 2020).
Results and discussion
Average number of fruits per individual
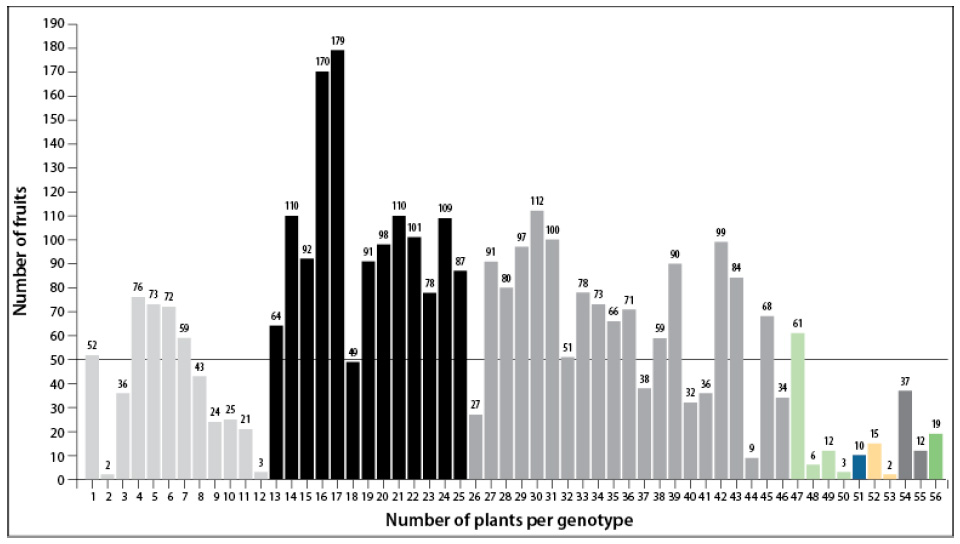
The number of fruits per individual was recorded for each genotype, and although this variable was not included in the statistical analysis, the average results are presented in figure 2. Individual 17 of genotype 2 stood out with 179 fruits/plant, followed by 31 individuals that exceeded 50 fruits/plant.
The number of fruits per individual observed in this study is higher than those reported for the Red Maradol variety grown in Cuba and Mexico with 41 and 11 fruits/plant, respectively (Rodríguez et al., 2014), Red Lady 786 with 25 fruits/plant (Kaur & Kaur, 2017), Golden with 69 fruits/plant (De Souza et al., 2017), Coimbatore with 75-80 fruits/plant (Nafiu et al., 2019), Tainung with 29-38 fruits/plant (Marmolejo et al., 2019), and the variety described by Vargas Tierras et al. (2018) with 15 to 50 fruits/plant.
Analysis of variance
The analysis of variance detected statistically significant differences between the papaya genotypes (p ≤ 0.05) for the quantitative variables (table 3).
Table 3 Means for the variables under study of the papaya genotypes from Shushufindi and La Joya de los Sachas

a, b, cMeans with the same letters in the row do not differ statistically (Tukey 0.05). FW: fruit weight (kg); FD: fruit diameter (cm); FL: fruit length (cm); PT: pulp thickness (cm); FF: fruit firmness (N); PW: pulp weight (kg); PEW: peel weight (kg); TSS: total soluble solids (°Bx); TA: titratable acidity; FFR: fruit flavor ratio. The experimental error for each variable is indicated.
Source: Elaborated by the authors
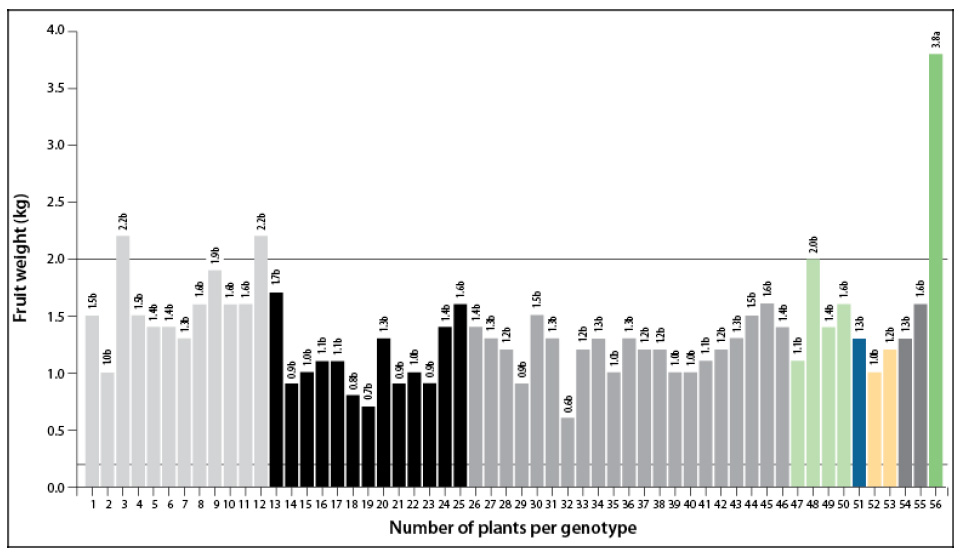
The average weight of papaya fruits showed high variability. Significant differences (p < 0.05) were found between genotypes 1, 2, 3, 4, 5, 6, and 7 with weights of 1.10 to 1.61 kg, and genotype 8 with 3.78 kg (table 3). According to this trait, individuals should stand out for their high weight; however, they were less heavy than the Maradol Roja cultivar (2.25 kg) (Alonso et al., 2009). On the other hand, individual 56 of genotype 8 was highlighted for presenting the highest fruit weight (3.78 kg) and showing significant differences compared to the other individuals; this value exceeded the ones found in cultivar Maradol Roja and hybrid T1XZM from Costa Rica (Mora & Bogantes, 2004).
Fruit weight is correlated with its size, and the demand depends on consumer requirements. The fruit weight of the different genotypes under study is within the ranges reported by the Ecuadorian Technical Standard for papaya Codex Stan 183-1993 (INEN, 2013) for export fruits (0.2 to ≥ 2.0 kg) (figure 3). In Latin America and Asia, consumers prefer large fruits of 1.0-1.5 kg (Alonso et al., 2009; Mora & Bogantes, 2004), while other markets prefer fruits of the Solo group (0.46-0.69 kg) due to the high costs of the fruit, and the possible waste generated (Rodríguez et al., 2014).
Source: Elaborated by the authors
Figure 3 Fruit weight in individuals belonging to eight papaya genotypes from the Shushufindi and La Joya de los Sachas cantonsNote: The dotted line (gray) distinguishes papaya individuals that show fruit weight in accordance with the Codex Stan 183-1993 standard for export fruits (0.2 to ≥ 2.0 kg).
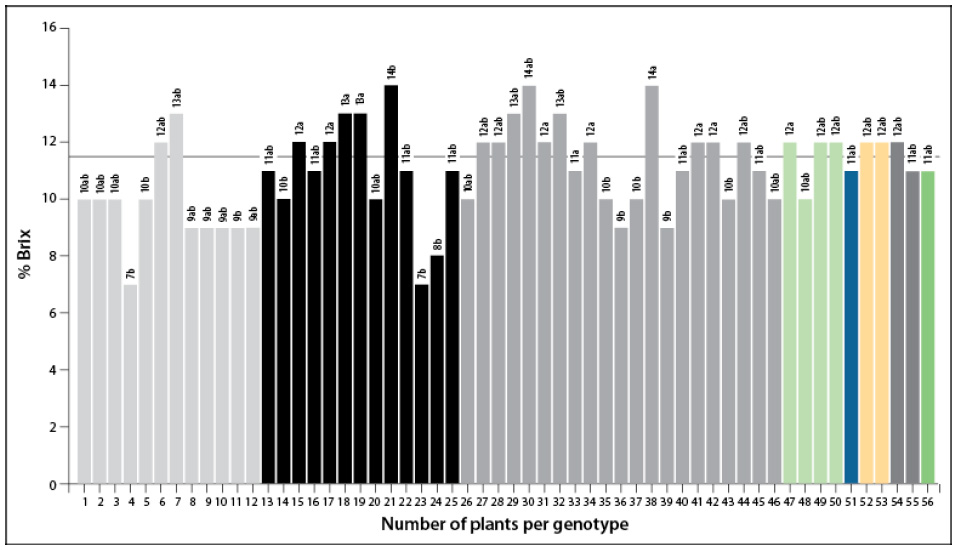
The total soluble solids content did not show statistically significant differences (p > 0.05); however, the highest average value was 12.10 °Bx, which corresponds to genotype 6 (table 3). The concentration of sugars in the individuals of the eight genotypes ranged from 6.80 to 13.60 °Bx (figure 5). The fruits of individual 4 (genotype 1) had the lowest concentration of soluble solids (6.80 °Bx), while the highest concentration of sugars (> 13 °Bx) was recorded in individuals 21 (genotype 2), 30, 31, and 38 (genotype 3) (figure 2). These last values were considered as high since the export market recommends that the concentration of sugars in papaya fruits must reach 11.5 °Bx in varieties of the Solo group (Alcántara et al., 2010; Rodríguez et al., 2014). In this context, 24 of the 56 individuals of genotypes 1, 2, 3, 4, 6, and 7, overcame this condition (figure 4). However, Ecuador is exporting fruits with 8-17 °Bx (Ministerio de Agricultura, Ganadería, Acuacultura y Pesca & Agencia Ecuatoriana de Aseguramiento de la Calidad del Agro, 2015).
Source: Elaborated by the authors
Figure 4 Content of soluble solids in the individuals belonging to eight papaya genotypes from the Shushufindi and La Joya de los Sachas cantonsNote: The dotted line (gray) distinguishes individuals with contents higher than 11.5 °Bx. The significance of the individuals is based on the statistical differences obtained in the formation of groups from the cluster analysis.
Principal components
The first three principal components (PC) explained 84.32 % of the total variation of the genotypes under study (table 3). The traits associated with PC1 were peel, pulp, and fruit weight and pH, with a cumulative variance of 46 %. In PC2, pulp thickness and fruit diameter contributed significantly to the variation (15.83 %). In PC3, the titratable acidity and the flavor ratio contributed to the variation, while in PC4, total soluble solids and fruit firmness were significant (table 4).
Table 4 Eigenvectors eigenvalues and proportion of the explained variation of the first four principal components of the variables under study
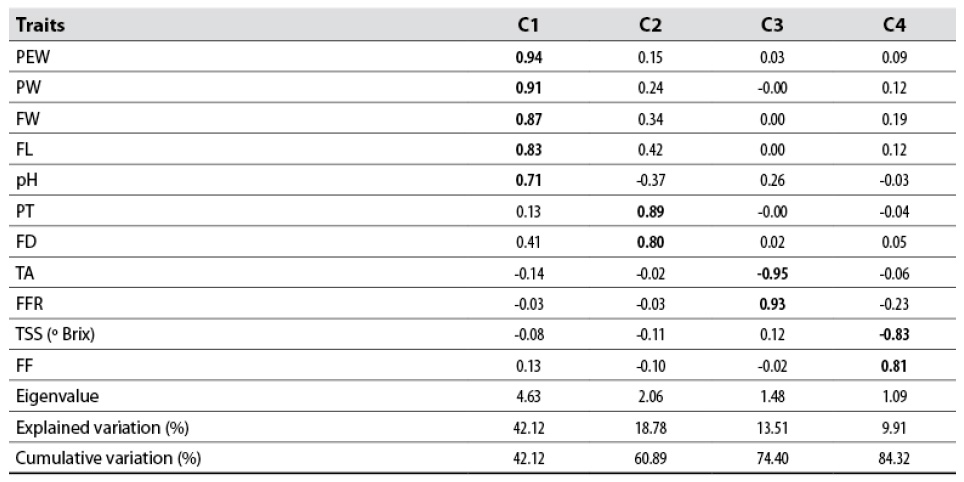
Rotation method:Varimax with Kaiser’s normalization. FW: fruit weight (kg); FD: fruit diameter (cm); FL: fruit length (cm); PT: pulp thickness (cm); FF: fruit firmness (N); PW: pulp weight (kg); PEW: peel weight (kg); TSS: total soluble solids (° Brix); TA: titratable acidity; FFR: fruit flavor ratio.
Source: Elaborated by the authors
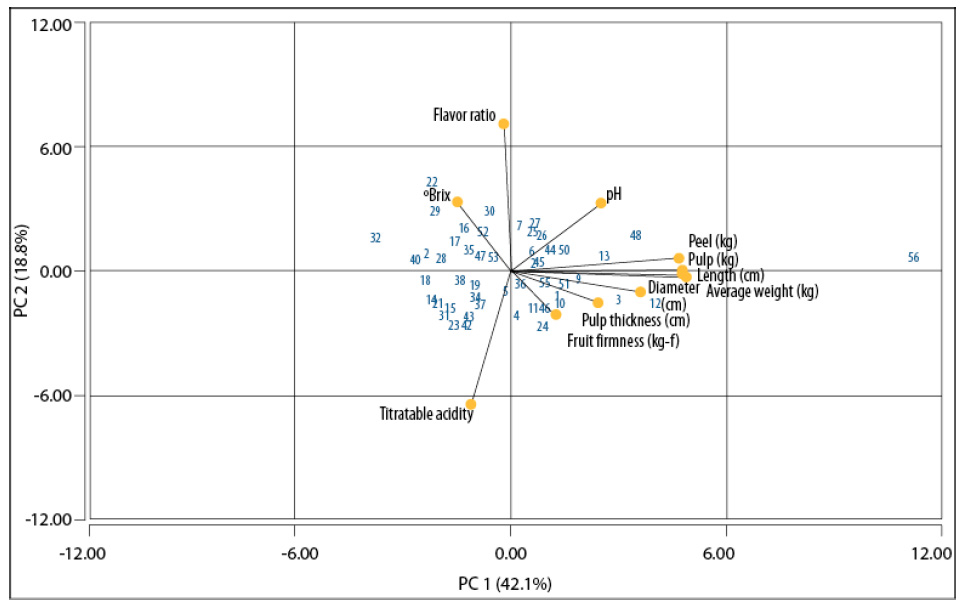
Individual 56 (genotype 8) obtained the best results for the variables fruit weight (3.78 kg), fruit length (45.74 cm), pulp weight (3.74 kg), and peel weight (0, 66 kg). Similarly, individuals 3 and 12 (genotype 1) stood out considering the variables fruit length (18.63 cm), and pulp thickness (4.59 cm) (figure 5).
Source: Elaborated by the authors
Figure 5 Biplot of 56 individuals of the eight papaya genotypes with the first two principal components of the variables under study
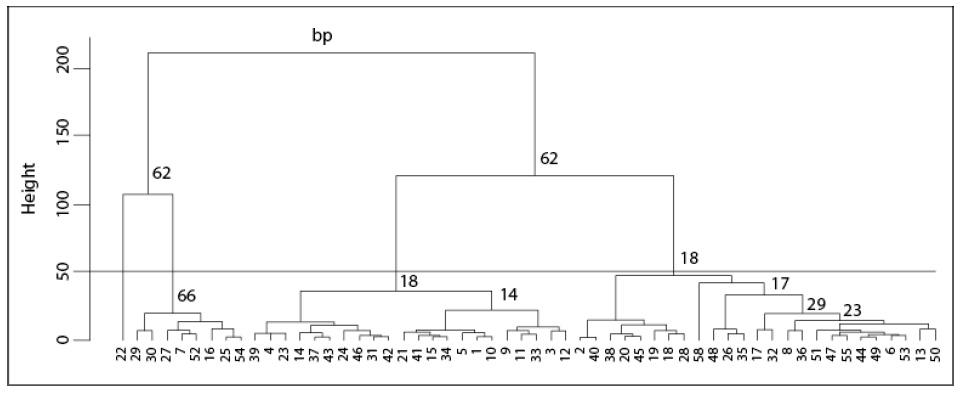
The cluster analysis utilizing the variables under study allows identifying the four groups represented in the dendrogram based on the midpoint of the Euclidean distance (Di Rienzo et al., 2008).
The resampling technique called Bootstrapping is used in statistics when successive samples are drawn from the study sample and not from the original population. The procedure follows a series of repetitive steps to obtain the desired statistic and is used as a population estimator (Hesterberg et al., 2003). In the current study, the Bootstrap value ranged from 18.0 % to 66.0 % of certainty in group formation (figure 6).
The first group included only individual 22 of genotype 2, and it differed from the other four groups because the fruits were smaller. The second group was formed with eight individuals: number 7 of genotype 1; 16 and 25 of genotype 2; 27, 29, and 30 of genotype 3; 52 of genotype 6, and 54 of genotype 7, which recorded the highest concentration of soluble solids (> 11.5 °Bx). The third group was comprised of 22 individuals: 1, 3, 4, 5, 9, 10, 11, and 12 of genotype 1; 14, 15, 21, 23, and 24 of genotype 2, and 31, 33, 34, 37, 39, 41, 42, 43, and 46 of genotype 3, which presented higher fruit firmness. Group four included 25 individuals: 2, 6, and 8 of genotype 1; 13, 17, 18, 19, and 20 of genotype 2; 26, 28, 32, 35, 36, 38, 40, 44, and 45 of genotype 3; 47, 48, 49, and 50 of genotype 4; 51 of genotype 5; 53 of genotype 6; 55 of genotype 7, and 56 of genotype 8. These individuals were highlighted for having a higher pulp weight (table 5).
Source: Elaborated by the authors
Figure 6 Classification dendrogram of 56 individuals belonging to eight papaya genotypes based on the variables studied using Ward's minimum variance algorithm and the Euclidean metric distanceThe bp values in the branches of the larger groups indicate the result of the Bootstrapping
Table 5 Means of the quantitative variables and discriminant analysis of the groups formed by the individuals belonging to eight papaya genotypes
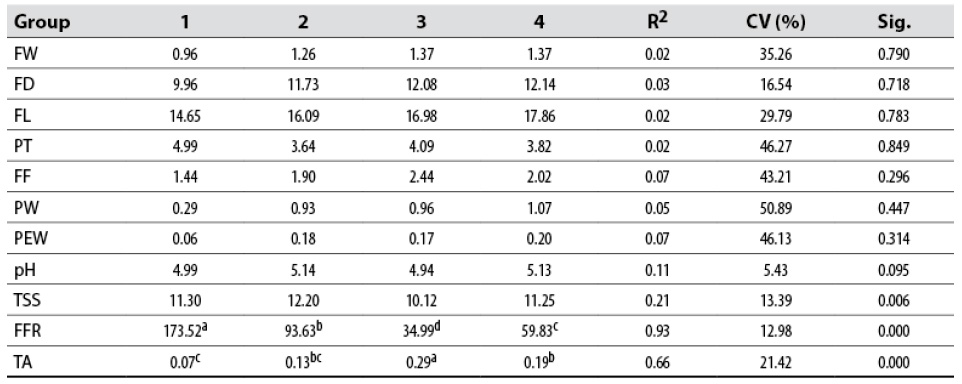
a, bMeans with the same letters in the column do not differ statistically (Tukey 0.05). FW: fruit weight (kg); FD: fruit diameter (cm); FL: fruit length (cm); PT: pulp thickness (cm); FF: fruit firmness (N); PW: pulp weight (kg); PEW: shell weight (kg); TSS: total soluble solids (° Brix); TA: titratable acidity; FFR: fruit flavor ratio.
Source: Elaborated by the authors
The discriminant analysis was carried out, and a differentiated effect in the four groups of papaya formed according to the variables evaluated was verified (Wilks’ Lambda = 0.008; p = 0.000) to determine the variables that were most important in group formation and that contributed to the differentiation of individuals, (table 5).
The variables flavor ratio and titratable acidity (p ≤ 0.000) were highly significant, and total soluble solids (p = 0.002) was significant to differentiate the groups of individuals that were formed from the eight genotypes. These findings coincide with those reported by Hernández-Salinas et al. (2019).
When analyzing the qualitative variables, group 1 consisted only of individual 22 of genotype 2, who presented fruits with a depressed base shape and a stellate cavity. Group 2 was formed by eight individuals of genotypes 1, 2, 3, and 7, whose fruits had a depressed base shape in 88 % and inflated in 12 % of the cases. Furthermore, in this group, the shape of the central cavity of the fruit was round (38 %), stellate (37 %), and slightly stellate (25 %). The fruits of group 3, composed of individuals of genotypes 1, 2, and 3, showed a depressed base (46 %), flattened (36 %), and pointed and inflated (18 %). In this group, 32 % of the fruits showed a slightly stellate cavity, 32 % a circular or rounded cavity, 22 % an angular cavity, and 14 % a stellate central cavity.
Group 4 included individuals of genotypes 1, 2, 3, 4, 5, 6, 7, and 8 that produced fruits with a depressed (68 %), flattened (16 %), and inflated (16 %) shape. The fruits of these individuals showed cavities of circular shape (40 %), slightly stellate (20 %), angular (20 %), and various shapes such as stellate and irregular (20 %). The circular shape, which prevailed in all groups, is the one most appreciated by consumers and the agroindustry because it facilitates seed extraction, generates less pulp loss, and reduces the operating costs of the process (Mora & Bogantes, 2004; Rodríguez et al., 2014).
Peel and pulp color in the fruits of the four papaya groups were classified in the orange group N-25, C, and D (orange) category. The intensity of the pulp and peel color is related to the accumulation of carotene, an important attribute in consumer perception. Rodríguez et al. (2014) reported that color is the factor that determines fruit acceptance in national and international markets, and consumers prefer fruits with dark orange pulp. However, yellow pulp cultivars are also accepted in the national and international markets (Rodríguez et al., 2014).
Conclusions
The results of the study allowed the identification of ten elite individuals (6, 15, 19, 27, 28, 29, 32, 34, 38, and 42) that showed a high content of total soluble solids (12-13 °Bx) and 51-97 fruits/plant. These individuals should be conserved in a germplasm bank and multiplied to study their morpho-agronomic potential and their resistance/tolerance to pests in surrounding cultivation areas facilitating their in situ conservation. The selected individuals will allow generating breeding programmes for this fruit tree that has good nationwide demand.

