


 text in
  English (pdf)
 Article in xml format
 Article references
 Send this article by e-mail
 Cited by SciELO
  Cited by Google
  Similars in
SciELO
Similars in
SciELO  Similars in Google
 Permalink
Introduction
The wide variation in local environmental conditions strongly influences agricultural production throughout the world, producing significant economic uncertainty due to unstable yields of different crops year after year (Dehghani et al., 2016). Semi-arid regions are vulnerable to climatic variations because they have an irregular distribution of rainfall that is concentrated in a few months of the year and varies between and within years. Agricultural production systems must adapt to climatic variations to efficiently take advantage of water resources (Ramos et al., 2016). In Argentina, the semi-arid regions have annual rainfall averages that do not reflect their reality of occurrence; wet and dry years alternate in an unforeseeable way (Brendel et al., 2017). The central region of Argentina presents a distinct water deficit in the winter months that, added to the edaphic limitations of livestock environments, justify the search for species adapted to such conditions (Jauregui et al., 2017).
It is important to consider that, in addition to the climatic fluctuations typical of semi-arid environments, the phenotypic evaluation of field crops is complex since quantitative traits strongly influenced by the environment are always analyzed. Multi-environmental assays (MEA) play an essential role in the genetic improvement of agronomic crops due to their usefulness to interpret the genotype × environment (GxE) interaction. The experimental design and statistical analyses of the MEA trials allow eliminating the variability in the data due to causes that cannot be explained (Crossa, 1990). The GGE biplot methodology was developed to analyze the databases generated by the MEAs (Yan et al., 2000).
The acronym GGE refers to the effect of the different genotypes (G) on the production data, plus the effect corresponding to the genotype × environment (GxE) interaction. On the other hand, analyzes using the additive main effects and multiplicative interaction (AMMI) model allow describing the adaptive response of genotypes through different environments (Gauch et al., 2008).
Tall fescue, Festuca arundinaceaSchreber (Poaceae), is a hexaploid forage species, with 2n = 6x = 42 chromosomes, perennial, cross-breeding, and anemophilous pollination (Hand et al., 2010). Previous studies affirm that the broad geographic distribution of tall fescue is a consequence of its excellent adaptability, conferred by favorable agronomic characteristics, such as resistance to grazing, tolerance to diseases and insects (Petigrosso et al., 2019), and abiotic stresses, such as drought (Dehghani et al., 2016). For these reasons, it occupies a significant place in meat and milk production systems worldwide due to its performance in places with environmental and edaphic restrictions (Cougnon et al., 2018).
The perennial forage species F. arundinacea is naturalized in different environments of the semi-arid sub- humid central region of Argentina (Scheneiter et al., 2016). The chair of genetics belonging to the Department of Agricultural Biology of the Faculty of Agronomy and Veterinary Medicine of Universidad Nacional de Río Cuarto began a breeding program for the improvement of tall fescue through the collection of naturalized adult plants in the region. From this collection, ten populations were formed and are studied for breeding purposes. These were characterized in the field by their vegetative and reproductive traits (Vega et al., 2018). The aim of this study was to evaluate the phenotypic performance of ten naturalized tall fescue populations in the semi-arid sub-humid central region of Argentina.
Materials and methods
Plant material and growing conditions
The study was developed in the Experimental Field of the Faculty of Agronomy and Veterinary Medicine of Universidad Nacional de Río Cuarto (33°06′22 ″S, 64°17′52″ W, 443 m a.s.l.), located in the south of the province of Córdoba, Argentina, during 2014, 2015, and 2016. The experimental field soil is a typical Haplustol with an average organic matter content of 1.6 %, 27 ppm of nitrates, and 24 ppm of phosphorus in the first 20 cm of soil. The climate of the region is sub-humid semi-arid, with an average annual rainfall of 800 mm, and 80 % of these are concentrated in the warmest semester, from October to March. The area has an annual mean temperature of 16.5 °C, an annual mean maximum temperature of 22.8 °C, and an annual mean minimum temperature of 10.2 °C (1981-2010). From 2014 to 2016, there were monthly mean temperature values similar to the values of the 1981-2010 period, but rainfall showed a higher variability compared to that period (figure 1).
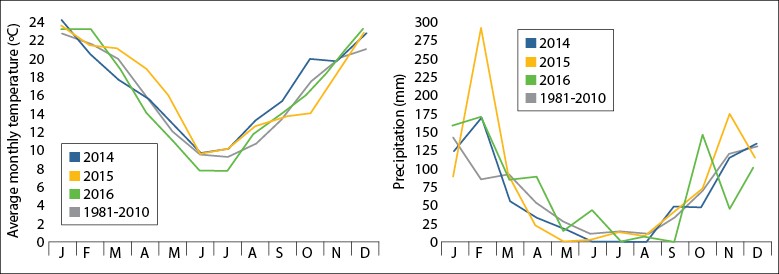
Source: Elaborated by the authors
Figure 1. Average monthly temperatures (left) and rainfall (right) recorded during 2014, 2015, 2016, and the 1981-2010 series in Río Cuarto, Córdoba, Argentina.
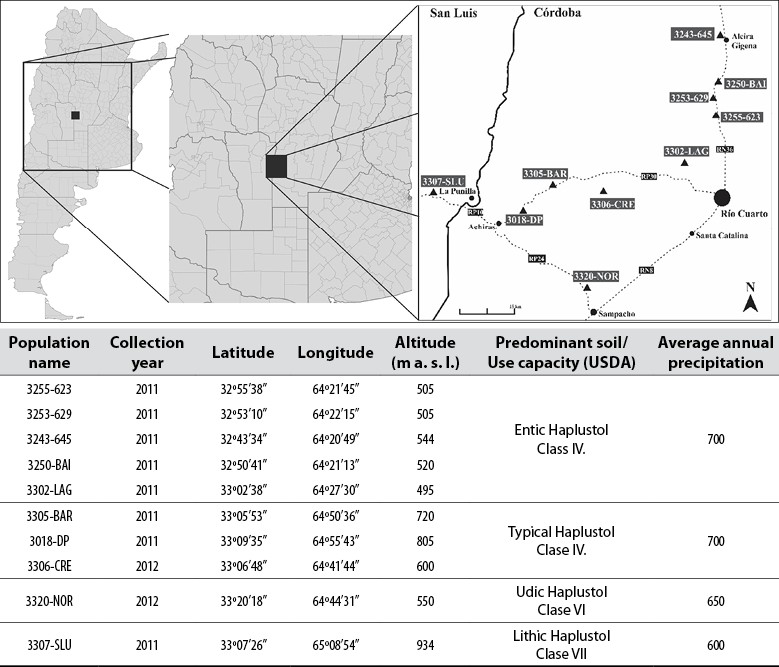
The plant material consisted of ten naturalized populations collected in the south of the province of Córdoba and north of San Luis, Argentina (figure 2), along the roads and routes, as well as in pastures that have undergone long periods of grazing. In addition, two commercial cultivars were used: Pergamino El Palenque MAG (Palenque-INTA), a widely used cultivar well adapted to the region, and Balerón- Forratec (Balerón-Forr), a new cultivar with promising yields, and two collections (017 and 509) of differential behavior in terms of biomass accumulation from the Germplasm Bank of Instituto Nacional de Tecnología Agropecuaria, located in the Pergamino Experimental Station (Rosso et al., 2007). The field trial was implemented in March 2014, under rain-fed conditions and without the application of fertilizers at any time during the cycle. Weed control was carried out manually, and trimming cuts were performed at the end of each cultivation cycle. A randomized complete block design was used. Besides, the plants of each population were cloned to form four repetitions, where each population was randomly arranged within each block, in plots with 24 plants each. Each plot consisted of three rows spaced by 25 cm, with eight plants per row spaced by 50 cm between plants.
Phenotypic traits
The traits were estimated through successive forage cuts. The thermal time of leaf senescence (every 550 °C days) and a base temperature of 5 °C were considered to distance them during the growth cycle (Chapman & Lemaire, 1993). Three cuts were made in 2014 and four in 2015 and 2016, in the months of March (first cut), April-May (second cut), July-August (third cut), and October-November (fourth cut). The phenotypic traits considered in each cut per plant were plant height (PH), crown diameter (CD), number of tillers (NT), and average dry biomass production per cut and per plant (DBC). In addition, the total dry biomass produced in the year was calculated by adding the cuts (DBT). The PH was measured before each cut and the CD afterward, in centimeters (cm) with a graduated ruler without modifying the plant structure (non-destructive measurements). The cutting of the aerial biomass per plant was carried out with a mechanical scissor, leaving a height of 5 cm of remaining stubble. The green biomass was used to determine the NT in number of tillers per plant. Then, it was weighed and dried in a forced-air oven until a constant weight was obtained to establish the DBC in g/plant (destructive measurements).
Statistical analysis
The phenotypic traits were studied through an analysis of variance (ANOVA), using the following model: Υ𝑖𝑗𝑘𝑙 = 𝜇 + 𝛼𝑖 + 𝛽𝑗 + 𝛾𝑘 + 𝛿𝑙 + 𝛼𝑖 × 𝛿𝑙 + 𝜀𝑖𝑗𝑘𝑙, where 𝛶ijkl is the average value of the population i, on repetition j, in cut k, and in the year l; µ is the general mean of the trial; αi, βj, γk, and δl are the main effects due to population, repetition, cut, and year, respectively; αi × δl corresponds to the effect of the population × year interaction (GA), and εijkl is the term of the error (Ospina et al., 2012). The population (G), the year (A), and the population × year interaction (GA) were considered as fixed effects, while the repetition and cut variables were considered random. The linear correlation between traits was analyzed using Pearson's correlation coefficients (Pearson, 1920).
A principal component analysis (PCA) was performed, including the three evaluation years. The phenotypic traits were also analyzed using the site regression model (SREG) with GGE biplot graphs. The GGE biplots were generated from the singular value decomposition (SVD) technique of the residual matrix of the following model: Υ𝑖𝑗 − Υ𝑗 = 𝜆1 𝜉𝑖1𝜂𝑗1 + 𝜆2𝜉𝑖2𝜂𝑗2 + 𝜀𝑖𝑗, where Υij is the average yield of the population i in the year j; Υj is the population mean in the year j; λ1 and λ2 are the eigenvalues for PC1 and PC2, respectively; ξi1 and ξi2 are the scores in the population i on principal components PC1 and PC2, respectively; ηj1 and ηj2 are the scores of the year j on PC1 and PC2, respectively, and εij is the residual term associated with the average observation of the population i in the year j centered by the effect of year j.
The DBC trait was analyzed using the additive main effects and multiplicative interaction model (AMMI): Υ𝑖𝑗𝑟 = 𝜇 + 𝛼𝑖 + 𝛽𝑗 + ∑ 𝜆𝑛 𝛾𝑖𝑛 𝛿𝑗𝑛 + 𝜀𝑖𝑗𝑟 where Υijr is the population yield i in the year j, for repetition r. The additive parameters are μ (general mean of the combined trial), αi and βj are the main effects due to population and year, respectively, while λn corresponds to the eigenvalue for axis n of the PCA; γin, is the eigenvector of the populations for axis n; δjn, is the eigenvector of years, and finally, εijr is the term of the error (Gauch et al., 2008). The methodology was based on adjusting the additive effects of the model (population and year) utilizing an ANOVA, from which the residuals containing only the interaction effects (population × year) were obtained. Then, this residue matrix was analyzed through a PCA. The first principal component (PC1) of the PCA was used to generate the results graph of the AMMI1 model. The statistical software Infostat (Di Rienzo et al., 2018) and its link with R (R Core Team, 2017) and Infogen (Balzarini & Di Rienzo, 2017) were used.
Results and discussion
The ANOVA revealed that the populations differed significantly and that the GA interaction (p < 0.05) was found in all traits. The interaction can be explained by the inconsistent behavior of the populations in the face of the different environmental conditions that occurred during the three years of evaluation (figure 1). Previous studies carried out on the same plant material in one year of evaluation confirm the presence of differences between populations (Vega et al., 2018). Chtourou-Ghorbel et al. (2011), as in the present study, report the existence of statistically significant differences between populations and the GA interaction, significant in average dry biomass production per cut over a group of 35 populations of tall fescue collected in different environments of Tunisia, where a high variability of edaphoclimatic characteristics is also observed.
The average values of each cut for the three years of evaluation are summarized in table 1. The CD trait presented average values that ranged between 13.09 ± 0.15 cm and 15.34 ± 0.15 cm in the different cuts made. In Isfahan, Iran, a region where annual rainfall is 140 mm, Ebrahimiyan et al. (2012) observed average values lower than those found in the present study (10 ± 1.8 cm) under rainfed conditions, while under irrigation, the values (13.70 ± 1.4) were similar to those reported in the current study, i.e., rainfall was around 800 mm per year under rainfed conditions.
Table 1. Average value and standard error (SE) of the phenotypic traits measured in each forage cut in the 2014-2016 period, and F and p values of the population × year interaction (GA) of the analysis of variance of the Festuca arundinacea populations evaluated in Río Cuarto, Cordoba, Argentina
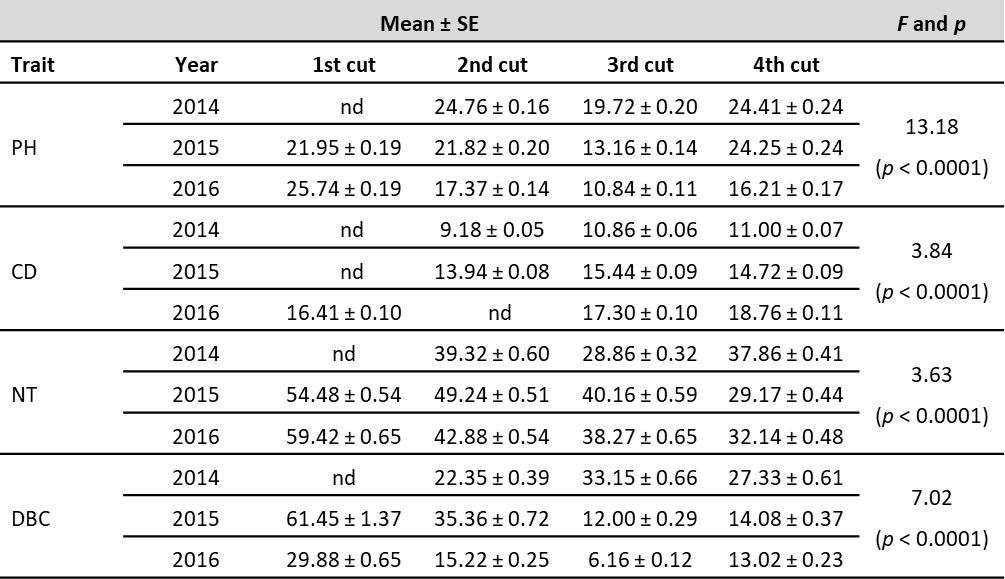
On the other hand, the average number of tillers per plant (NT) in the current work ranged between 38.45 ± 0.62 in the 3250-BAI population and 46.46 ± 0.69 in the 3243-645 population (averages of all the cuts and years of evaluation). These values are lower than those found by Ebrahimiyan et al. (2012), who reported average values of 63.40 ± 10.3 tillers per plant under irrigation, and 51.60 ± 13 under rainfed conditions. These differences may be due, at least in part, to the use of more tillering genotypes in Isfahan, Iran. Furthermore, given that annual rainfall represents only 17 % (140 mm per year) in relation to values that occur in the semi-arid sub-humid central region of Argentina (800 mm per year), the plants probably resort to the strategy of producing a higher number of tillers in detriment of its size, to ensure a greater horizontal exploration of the soil in search of water.
Regarding the dry biomass per plant (DBC), in 2015, it was higher than the second cut of 2014 and the first and second of 2016 (table 1). This fact can be explained by the abundant rainfall that occurred during February 2015 (figure 2). The DBC of the 3rd and 4th cut was higher in 2014 (table 1), probably attributable to higher than average temperatures, which occurred during the second half of the year, and to the occurrence of higher rainfall during September (50 % higher than the historical average for the region) (figure 1).
The total dry biomass produced per plant per year (DBT) presented average values of 82.36 ± 1.38 g in 2014, 122.13 ± 2.47 g in 2015, and 63.91 ± 1.06 g in 2016. The trait exhibited higher standard errors in 2014 and 2015, which could be associated with the higher variation in temperature and rainfall, respectively (figure 1).
Pirnajmedin et al. (2016) in Isfahan, Iran, found that the range of biomass production ranged between 30.58 g and 248.58 g in a trial mentioned above. On the other hand, the trial values discussed are among those observed in the previous trial (from 74.81 ± 2.59 g in the 3307-SLU population to 101.06 ± 4.74 g in the 3250-BAI population). The elevated DBT values found by Pirnajmedin et al. (2016) are probably due to annual fertilizations carried out in the trial with phosphorus and nitrogen; however, the more benign edaphoclimatic conditions of Río Cuarto would have allowed obtaining more stable yields than in Isfahan, Iran, even with the phenotypic differences between the populations evaluated in the present work.
Correlation between phenotypic traits and agronomic behavior of tall fescue populations
This approach can provide vital information to improve tall fescue forage performance (Ebrahimiyan et al., 2012). Positive correlation values were found between several estimated traits (table 2). The highest and most significant values occurred between NT vs. CD, PH vs. DBT, and PH vs. DBC. These correlations suggest that the plant height trait (PH) may be useful to select higher plants in biomass production (DBC and DBT). This could be because PH has a high positive direct correlation with DBC; there is a decrease in the direct positive correlation effect between NT and DBC. Other studies also report the presence of positive correlations between dry biomass production and plant height (Chtourou- Ghorbel et al., 2011), as well as between the number of tillers (NT) and crown diameter (CD) (Pirnajmedin et al., 2016).
Table 2. Pearson's correlation coefficients between the phenotypic traits measured in the set of eleven forage cuts of Festuca arundinacea during the years 2014, 2015, and 2016. Río Cuarto, Córdoba, Argentina
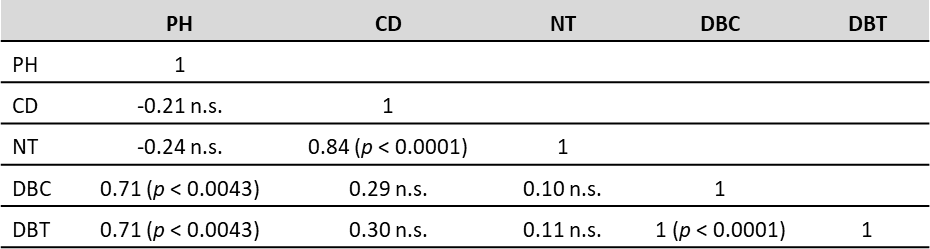
Note.p: probability value; PH: plant height (cm); CD: diameter of the crown (cm); NT: number of tillers (tillers/plant); DBC: average dry biomass production per cut (g/plant); DBT: total dry biomass produced per year (g/plant); n.s.: not significant.
Source: Elaborated by the authors
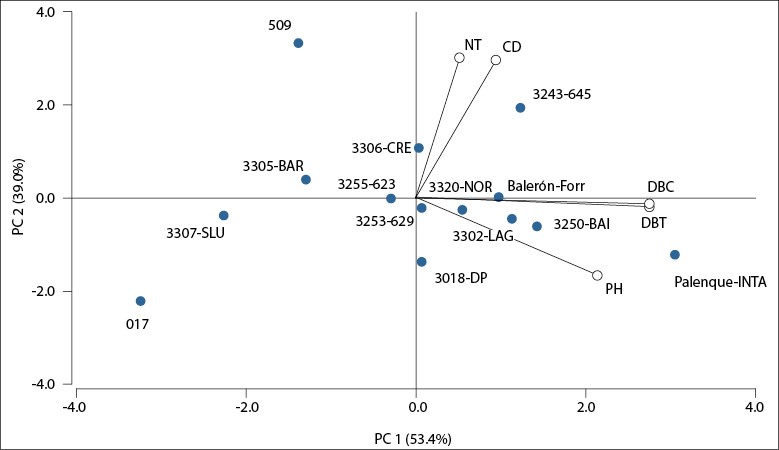
The PCA provides a graphical summary of the set of traits measured, the relationship between them, and the populations' behavior in relation to them. The biplot presented in figure 3 shows that PC1 and PC2 explained 92.4 % of the variability between populations, collections, and cultivars (cophenetic correlation: 0.994). The populations 3202-LAG, 3250-BAI, and the commercial cultivars Palenque-INTA and Balerón-Forr were the ones that were best associated with the PH, DBC, and DBT traits. On the other hand, population 3243-645 and collection 509 were positively associated with NT and CD.
Source: Elaborated by the authors
Figure 3. Biplot of the principal component analysis for the five traits measured in the ten naturalized populations, two commercial cultivars, and two collections of Festuca arundinacea in Río Cuarto, Córdoba, Argentina. 2014-2016. PH: plant height (cm); CD: crown diameter (cm); NT: number of tillers (tillers/plant); DBC: dry biomass produced per cut (g/plant); DBT: total dry biomass produced per year (g/plant).
Study of the population × year interaction
The graphs resulting from the GGE model applied to the different traits measured are shown in figure 4. The GGE model for the PH, CD, and NT traits explained, respectively, 93 %, 98 %, and 95 % of the variation due to the combined effects of populations and population × year interaction. In the PH biplot, it is observed that five mega-environments were formed (delimited by dotted lines) and that the three years were included within the same mega-environment. The cultivar Palenque-INTA was located at the vertex of the polygon, i.e., it showed the best performance in PH in the three evaluation years. Other outstanding populations in this trait were 3302-LAG, 3018-DP, 3320-NOR, and 3250-BAI, together with the Balerón-Forr cultivar.
Population 3243-645 and collection 509 stood out in the CD and NT biplots in 2015 and 2016. Population 3306-CRE presented superior behavior in NT in 2014, indicated by the location at the end of the mega-environment polygon that includes this year. The GGE biplot of the DBC trait explained 94 % of the variability, in which Palenque-INTA and population 3302-LAG (located at the vertices of the polygon), together with four populations (3250-BAI, 3243-645, 3306-CRE, 3253-629, and 3320- NOR), stood out in 2014, and 2015.
The GGE biplot of the phenotypic traits determined that the effect of the different populations (G) is higher than the effect of the population × year interaction (GA), since in all the graphs, five to six mega- environments were defined, and the different evaluation years were included in only one or two mega- environments (figure 4).
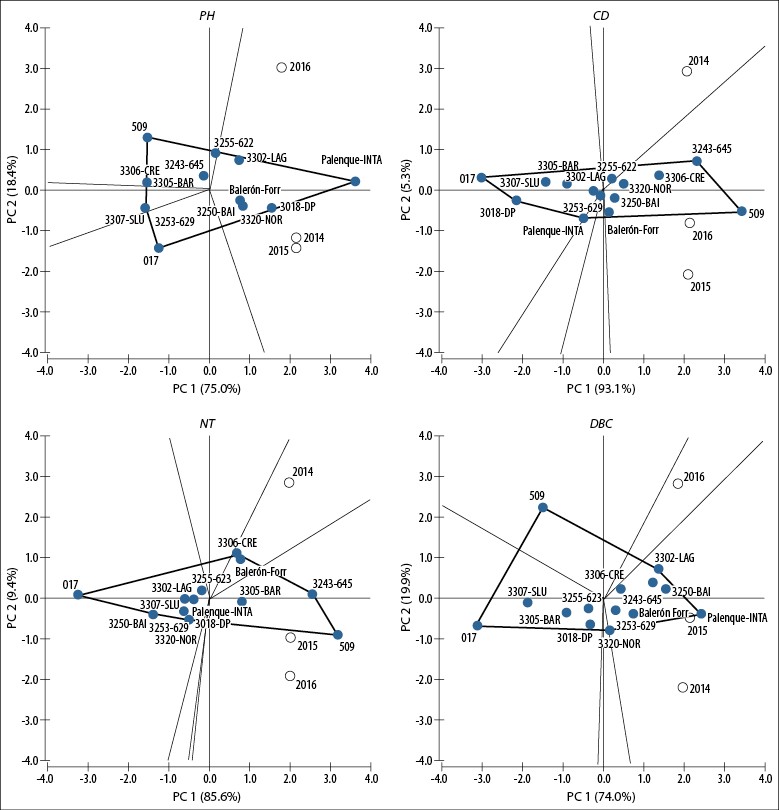
Figure 4. Biplots revealed by the GGE model for the traits estimated in the populations, collections and cultivars of Festuca arundinacea in Río Cuarto, Córdoba, Argentina. 2014-2016. PH: plant height (cm); CD: crown diameter (cm); NT: number of tillers (tillers/plant); DBC: dry biomass produced under cutting conditions (g /plant).
Dehghani et al. (2015) analyzed the behavior of 24 tall fescue genotypes in 14 different environments in field trials conducted in Iran. Through biplot graphs derived from the GGE model, the researchers were able to define mega-environments and genotypes with better behavior in each mega-environment. In this case, the GGE biplot explained 75 % of the variation between the genotypes evaluated for biomass production. In contrast, the GGE of DBC of the current study explained higher variability between the evaluated populations, managing to identify superior populations in certain mega-environments with a higher degree of confidence.
Stability and adaptability of tall fescue populations
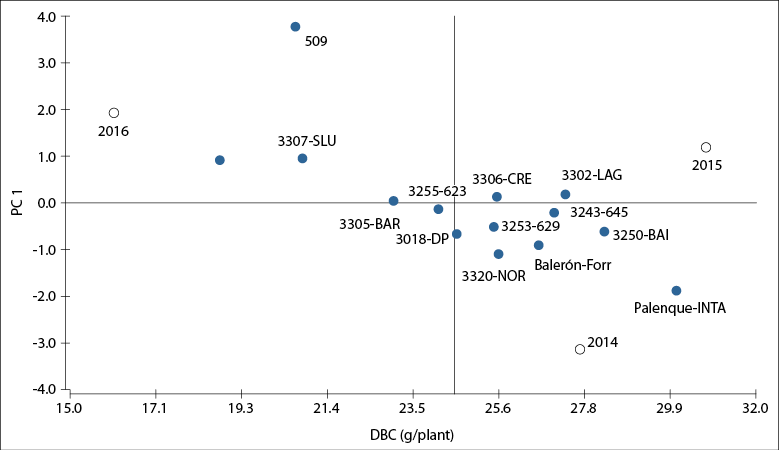
The AMMI1 model is functional to interpret the stability of populations in different years and their adaptability (Gauch et al., 2008). The AMMI1 biplot, where PC1, which indicates the stability of the populations (Y-axis), explains 58 % of the A interaction (figure 5). For its part, the X-axis indicates its adaptability through the average DBC of cuts in three evaluation years. The cultivar Palenque-INTA presented the highest DBC relative to the rest of cultivars, collections, and populations, although with the least stability through the evaluation years, while collections 017, 509, and population 3307-SLU recorded the lowest average DBC. These also showed high instability.
Source: Elaborated by the authors
Figure 5. AMMI1 biplot showing the naturalized populations, collections, and commercial cultivars of Festuca arundinacea (filled circles) and the evaluation years 2014, 2015, and 2016 (unfilled circles). DBC: the general mean value of the average dry biomass production per cut (DBC): 24.54 g/plant. Río Cuarto, Córdoba, Argentina.
Populations 3306-CRE, 3253-629, 3243-645, 3302-LAG, and 3250-BAI presented average DBC values higher than the general average (24.5 g/plant) and were stable throughout the years (they showed values close to zero in PC1, figure 5). Dehghani et al. (2016), in their study on 72 tall fescue genotypes evaluated in 16 environments, reported that the AMMI1 model explains 48 % of the GA interaction; meanwhile, in the present work, it was possible to explain a higher percentage of GA interaction (58 %), suggesting that the methodology used managed to capture a higher amount of variability between the populations evaluated during the three years of the trial and, therefore, improves confidence in the identification of superior populations.
Conclusions
Current study results suggest that there is high phenotypic variability among the ten populations of tall fescue naturalized in the semi-arid sub-humid central region of Argentina. The correlation analyzes showed that the plant height trait (PH) could be useful to indirectly select higher plants in biomass production (DBC and DBT). With the GGE, AMMI1, and PCA analyses, populations 3243-645 and 3250-BAI stood out in the evaluated traits, also presenting adequate adaptability and stability in biomass production throughout the years. Even though no superior populations were found compared to the cultivars included in the trial, it was possible to identify populations that surpassed them in biomass production stability. On the other hand, the wide phenotypic variability found can be used to continue the breeding program and find superior genotypes compared to the cultivars.

