


 English (pdf)
 Article in xml format
 Article references
 Send this article by e-mail
 Cited by SciELO
  Cited by Google
  Similars in
SciELO
Similars in
SciELO  Similars in Google
 Permalink
Introduction
Pea, Pisum sativum L., is a diploid (2n = 14), self-pollinating annual species of the Fabaceae family. It is the world’s second most cultivated legume, with a global production of 16,205 million tons in 2017 (Food and Agriculture Organization of the United Nations [FAO], 2017). Peas, more specifically the yellow or green cotyledon varieties, are known as dry peas or field peas and grown around the world for human and animal consumption (Dahl et al., 2012). They have long been recognized as an inexpensive, readily available source of proteins, complex carbohydrates, vitamins, and minerals (Parihar et al., 2016). Their high nutrient density makes them a valuable food commodity capable of meeting undernourished individuals’ dietary needs worldwide (Parihar et al., 2016). In some parts of the world, peas are the primary protein source for humans, with protein content ranging from 19 to 30%, equal to the protein contents of meat (18%-25%), but lack sulfur amino acids. Besides, peas provide the fifteen essential minerals required by man, although some at lower concentrations than in meat (Dahl et al., 2012).
Whole pea seeds, split peas, and pea ingredients are globally utilized in food, pet, and feed industries in several forms. Depending on the value proposition and applied technologies, they can exhibit variable functionalities (Tulbek et al., 2017). Pea flours can be used as an ingredient in baked goods (Sozer et al., 2017), pasta (Padalino et al., 2014), snacks, and extruded products (Maskus & Arntfield, 2015). Their starch has an application in making films for the food packaging industry (Saberi et al., 2016) and in the processed meat industry (Pietrasik & Janz, 2010); and their protein can be used in bean curd, meat products, and milk alternatives, generating beverages with equivalent nutritional quality to milk (Boye et al., 2010).
Physicochemical data are related to seeds’ nutritional value and functional properties and provides essential information to researchers and industry. Peas are high in protein, starch, and fiber contents (Dahl et al., 2012), but chemical content can vary due to genetic and environmental factors, as well as technological treatments. An assessment of genetic diversity is necessary to characterize different materials, detect accessions with favorable alleles, and select appropriate parents in breeding programs. New cultivars of pea are being developed and marketed, with a focus on increasing yield and productivity. It is crucial to identify if these accessions have valuable physicochemical traits to deliver genetic progress in line with this objective.
The starting seed’s protein content and composition influence pea protein-based products’ technological and functional properties (Barac et al., 2010). Pea proteins can be classified into two major classes: salt- soluble globulins and water-soluble albumins (Tzitzikas et al., 2006). Globulins are the major storage proteins and have been subdivided into two major groups based on their sedimentation coefficients: the 11S fraction (legumin) and the 7S fraction (vicilin, convicilin) (Tzitzikas et al., 2006). Pea legumin is a hexamer with a molecular weight (MW) that varies between 320 and 380 kDa (Tzitzikas et al., 2006). Variation in the subunit composition is because precursors originated from several gene families and can experience different post-translational processing (Tzitzikas et al., 2006). On the other hand, vicilin is a trimeric protein of ~170 kDa, which varies primarily because of post-translation processing (Tzitzikas et al., 2006). Convicilin is a protein of 71 kDa that can form a trimer of 210 kDa (Tzitzikas et al., 2006).
Due to their differences in structure and MW, globulins can vary considerably in their nutritional and functional properties (Barac et al., 2010). Legumin contains more sulfur-containing amino acids than vicilin per unit of protein and is more interesting from a nutritional point of view (Barac et al., 2010). Vicilin has a significantly higher foaming capacity than legumin and a slightly lower emulsifying capacity (Tzitzikas et al., 2006). Various legumin and vicilin concentrations, alone or in mixtures, can form good gels, depending on the conditions used (Tzitzikas et al., 2006). On the contrary, convicilin can hinder pea isolate gel formation (Tzitzikas et al., 2006). Therefore, peas with a specific globulin composition, for instance, legumin- and vicilin-enriched or lacking convicilin, would be desirable as a raw material for the food industry (Tzitzikas et al., 2006).
Physical properties, such as size, weight, and seed coat appearance, impact the nutritional qualities and physical properties of end products (Wang & Castonguay, 2014). Peas are generally soaked before cooking to ensure the uniform expansion of the seed coat and cotyledon and their tenderness (Wang et al., 2010), so the ability of seeds to hydrate needs to be characterized for practical applications. These physical properties have been reported to affect cooking time and quality (Sharma et al., 2015).
Seed color tones are essential for pea seed quality. According to Atak et al. (2008), the darker green seeds of a dry green pea had better seedling vigor and germination ability. Significant color and chlorophyll losses occur to green vegetables during storage, caused chiefly by enzymatic reactions and the release of organic acids from disrupted tissue. The extent of color loss during storage can be understood by accelerated aging (AA); this technique takes advantage of the fact that the seed aging process is determined by seed moisture level and temperature. Jatoi et al. (2001) standardized the AA test procedure for pea and observed differences in varietal deterioration for germination rate, speed of germination, shoot and root length, and shoot and root dry weight.
Although pea has long been recognized as a valuable, nutritious food, this crop’s genetic breeding has been mainly centered on developing varieties with high yielding ability. Basic information such as variation between genotypes in nutritional composition and processing properties must include nutritional objectives in breeding programs, which would add resources that help achieve a substantial improvement in disseminating these nutritious pulses. This research aims to study the genetic and phenotypic diversity of different physicochemical traits in 16 pea accessions with good agronomic performance.
Material and methods
Plant material
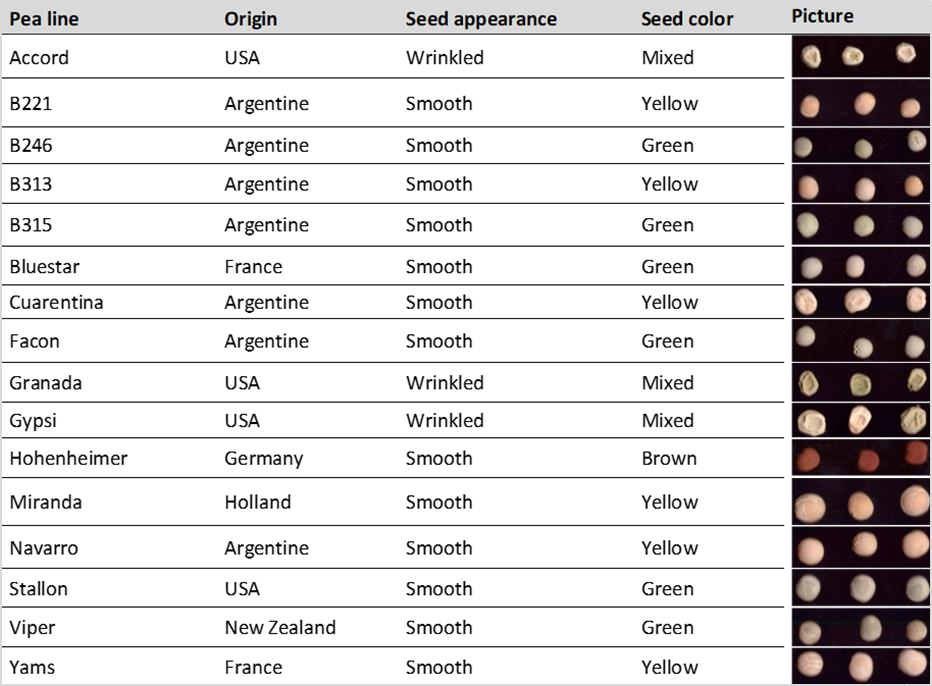
We analyzed mature pea seeds from 16 pea, Pisum sativum L. (Fabaceae), lines belonging to the germplasm collection of the Faculty of Agricultural Sciences, National University of Rosario, Zavalla, Argentina (table 1). Twelve of them were commercial varieties, and the other four were local breeding lines. Thirteen lines have round seeds of various colors (green, yellow, and brown) and three lines wrinkled seeds. For some analyses, we ground seed samples using a grain mill to pass a 0.25 mm sieve and obtain fine flour.
Analyses
Physicochemical characteristics
We determined seed weight (SW) by counting 100 seeds and weighing them and water hydration capacity (WHC) according to Wang et al. (2010). One hundred-SW samples were soaked in 100 ml of deionized water at room temperature for 24 h. After the water was drained, the soaked seeds were blotted dry with a paper towel and weighed. WCH was expressed as the amount of water absorbed per kg of seeds (g H2O/kg seeds) after soaking for 16 h.
We also ascertained soluble-solid loss (SSL) by drying the residual water at 100 °C and weighing the solid material dissolved in it, the mean diameter (MD) of pea seeds using a vernier caliper before and after the samples were soaked in water, and percentage of change in diameter (CD). For moisture content (MC), we employed AOAC Method 925.10 (1990). Each flour sample was weighed (5 g) and dried at 100 °C for 24 h; MC was expressed as a gram of water per 100 g of flour (% of moisture). The pH was measured using a HANNA HI 2211 pH/ORP Meter. We established titratable acidity (TA) with NaOH 0.1N and phenolphthalein as an indicator, calculating it as a gram of citric acid per kg of a wet sample (g citric acid/kg flour), since citric acid is the primary organic acid of peas (Periago et al., 1995). Finally, firmness (F) was measured with an adapted zenith penetrometer on individual pea seeds.
Protein analyses
We extracted proteins from 50 mg of pea flour for 120 min at room temperature with 1 ml of pH 8.0 Tris-HCl buffer. The samples were centrifuged at 17,000 × g for 15 min, measuring the protein content (PC) in the supernatant by the Qubit Protein Assay (Invitrogen).
SDS-PAGE determined protein composition on a MINI Protein II system (Biorad). We performed electrophoresis in denaturant and reducing conditions using 4.5% W/V stacking and 12% W/V resolving gel. The protein extract was diluted 1:1 V/V with sample buffer (62.5 mM pH 6.8 Tris-HCl, SDS 2% W/V, glycerol 25%, β-mercaptoethanol 0.1% W/V, bromophenol blue 0.01% W/V), heated at 95 °C for 10 min and cooled at room temperature. We loaded a volume of the sample containing 1 µg of protein per well. Gels were run at 20 mA per gel using Laemmli as running buffer (Tris 0.3% W/V, glycine 1.44% W/V, SDS 0.1% W/V). Gels were fixed, stained with Coomassie Blue R-250 1% W/V in ethanol:acetic acid:water (50:10:40) for 30 min, and destained by boiling in water. We estimated the MW of the polypeptides using PageRuler Prestained Protein Ladder (Thermo Scientific) and thus identified the polypeptides as vicilin or legumin subunits.
The photographs of the gels were analyzed by Gel analyzer, calculating the proportion of the different subunits from the sum of their total areas. We excluded the convicilin band from the legumin/vicilin ratio calculation. Each pattern was analyzed in duplicate.
Color analyses
We measured color traits were on 600-dpi two-dimensional digital images of samples of 50 seeds per repetition taken by a Samsung CLX 3300 scanner and analyzed using Tomato Analyzer (TA) software (Rodríguez et al., 2010). The colorimeter was calibrated using a standard color palette, expressing values as L, A, and B Hunter color parameters.
The color values of peas were measured before and after seed AA to investigate the effect of storage on the extent of color change. AA was conducted by exposing 50 seeds to approximately 100% relative humidity created in a chamber at 42°C for 96 h. If the difference in germination between samples before and after seed AA was higher than 75%, the method was considered efficient. It has been established that pea seed must have 75% minimum germination to maintain physical and genetic purity (Mahawar et al., 2018). All analyses were conducted in duplicate.
Statistical analysis
We used Infostat for the calculations. A Shapiro–Wilk test verified the normal distribution of the data. Normal data were subjected to analysis of variance (ANOVA), employing the Duncan’s multiple range test to separate means at a significance level of p < 0.05. Non-normal data were subjected to the Kruskal– Wallis test.
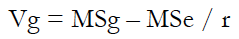
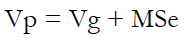
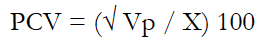
Genetic parameters such as genetic and phenotypic variances (Vg and Vp), genetic and phenotypic coefficients of variation (GCV and PCV, respectively), and broad-sense heritability (H2) were estimated using equations (1) to (5).
 Equation 1
 Equation 2
 Equation 3
 Equation 4
 Equation 5
Where:
MSg is the mean squares of the genotype.
MSe is the mean squares of error.
r is the number of replications.
X is the mean for the phenotypic traits.
Differences between genotypes in protein composition were assessed through the Duncan’s test, and correlations between legumin/vicilin ratio and protein content were evaluated through the Pearson coefficient.
Euclidean distances were calculated to analyze color, and the distance matrix was subjected to cluster analysis by the weighted average linkage method, then building a dendrogram. We evaluated color changes due to AA for each of the clusters separately. Mean values before and after AA were compared through Student’s t-test. Changes in color for the L, A, and B values were calculated, evaluating normality for these new variables. We performed the ANOVA to examine differences between varieties in color changes, and the Duncan’s test was performed to separate means at a significance level of p < 0.05.
The different parameters were correlated using the Pearson coefficient for normal data and the Spearman coefficient for non-normal data. We carried out the principal component analysis (PCA) using normal data to obtain a graphical representation of the relationship between the 16 varieties, considering the quality traits analyzed.
Results and discussion
Peas, appealing in color, texture, shape, and taste, are the second most important pulse after common bean. The intake of pea in daily meals has been reported to be effective in lowering the risks of type-2 diabetes, colon cancer, and heart diseases (Dahl et al., 2012). Their nutrient composition, carbohydrates, protein, vitamins, minerals, and phenolic compounds depend on cultivars, growing conditions, and seasons.
Commercial varieties and local breeding lines of peas were selected in this study, considering agronomic traits, such as yield, components, height, and earliness, to evaluate the genetic variation at the physicochemical level of materials that could become new varieties or be used in hybridization programs. A wide range of physicochemical composition profiles was observed among the accessions tested. Most of the traits showed significant differences related to morphological and physiological properties, such as seed surface or color.
Information regarding physical properties, such as weight and size, is vital to optimizing harvesting, transport, cleaning, separating, packaging, and storage equipment design, and analyzing the product behavior in different processing operations (Ganjloo et al., 2018). In this research, SW and MD showed a normal distribution, with a mean value of 23.26 g and 0.53 cm, respectively (table 2). ANOVA determined statistically significant differences between varieties (table 2); yellow varieties exhibited higher weight and larger diameter than green ones (table 3), with Miranda having the highest values.
Table 2. Mean values, standard deviation (SD), Shapiro-Wilk coefficient (W), analysis of variance and genetic parameters for traits with normal distribution and Kruskal-Wallis test for traits with non-normal distribution observed for pea lines evaluated
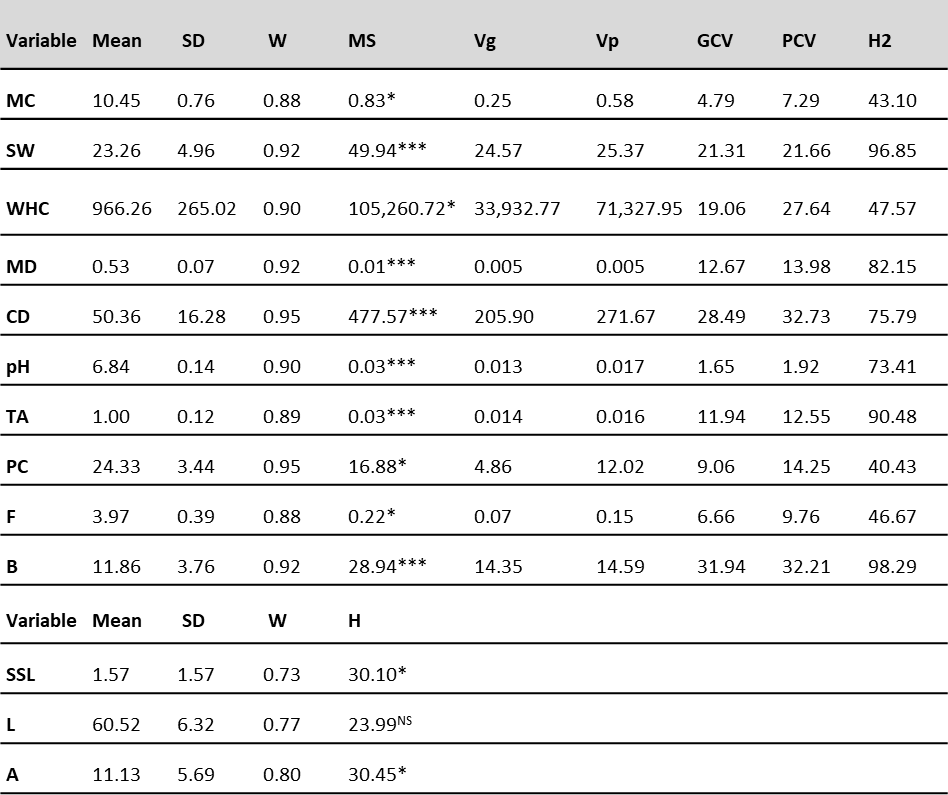
Note.MC: moisture content; SW: seed weight; WHC: water hydration capacity; MD: mean diameter of pea seeds; CD: change in diameter; TA: titratable acidity; PC: protein content; F: firmness; SSL: soluble- solid loss; L, A, and B: Hunter color parameters; MS: mean squares; H: Kruskal-Wallis test; NS: non- significant differences; *: significant at p < 0.05; **: significant at p < 0.01; ***: significant at p < 0.001; Vg and Vp: genetic and phenotypic variances; GCV and PCV: genetic and phenotypic coefficients of variation; H2: broad-sense heritability.
Source: Elaborated by the authors
MC showed a normal distribution, with a mean value of 10.45% (table 2). ANOVA determined differences between varieties were statistically significant (table 2). The MC of pea seed should be in the range from 10 to 16% for a long storage period (Yacin et al., 2007), according to the data observed for smooth varieties (table 3). Wrinkled varieties exhibited low values (table 3), as observed by Kosson et al. (1994).
Table 3. Mean of different lines for the evaluated traits
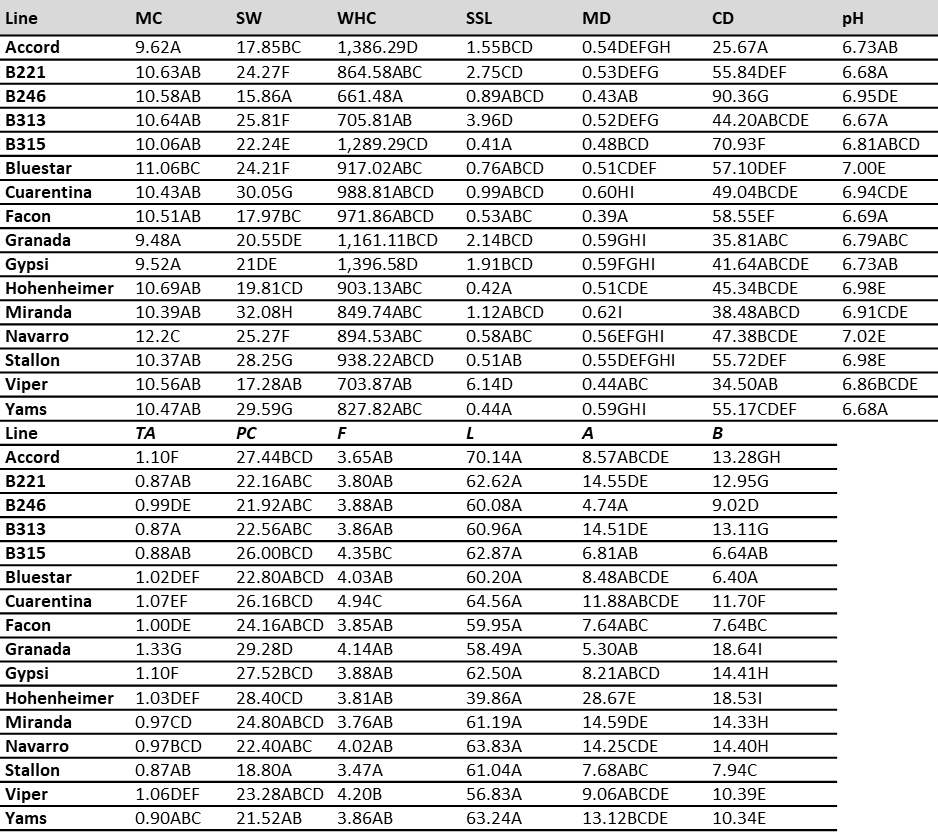
Note.MC: moisture content; SW: seed weight; WHC: water hydration capacity; SSL: soluble-solid loss; MD: mean diameter of pea seeds; CD: change in diameter; TA: titratable acidity; PC: protein content; F: firmness; L, A and B: Hunter color parameters. According to the Duncan’s test, different letters mean significant differences (p < 0.05).
Source: Elaborated by the authors
TA measures the total acid concentration, which influences flavor, color, and microbial stability in food. It is a better predictor of acid impact on flavor than pH (Sadler & Murphy, 2010). The values of the evaluated genotypes varied between 0.87 and 1.33 g citric acid/kg flour (table 3), below the values reported by Periago et al. (1995) (1.92-4.34 g/kg).
Seed firmness is a critical quality attribute related to seed coat permeability and overall texture and quality. F is affected by water uptake, affecting legumes’ cookability (Joshi et al., 2010). The mean value observed was 3.97 kg (table 2). The force to break the samples was greater for Cuarentina and B315 (table 3). These materials were more resistant and firmer, making them more suitable for canning purposes because peas that are too soft can dissolve in can liquids during processing.
Legumes are generally soaked before cooking to reduce cooking time, bring about the uniform expansion of the seed coat and cotyledon, and soften the seed (Singh et al., 2010). Throughout the immersion, water spreads slowly into the seeds and eventually reaches a constant MC level (Shafaei et al., 2016). This final value is affected by several factors, namely, seed coat thickness, seed volume, and color. The chemical constituents of seed coats, such as cellulose, hemicellulose, and lignin, play an essential role in water imbibition (Hradilová et al., 2017). ANOVA determined that differences in the grains’ WHC as a function of the genotype were statistically significant (table 2).
Peas with high WHC would be more suitable for canning because they could hydrate to a larger size (Wang et al., 2003). Besides, varieties with high WHC require less cooking time and hence are preferred by the consumer. In this study, wrinkled varieties showed higher WHC (table 3), but they are not usually employed in the canning industry because of cultural reasons. Also, they can be consumed fresh and frozen, with a value exceeding that of the canned product. B315 is a smooth variety with the highest WHC (1289.29 g H2O/kg seeds), even higher than the ones observed in Wang et al. (2010) (1183.6 g H2O/kg seeds). Furthermore, significant diameter changes were observed for green varieties, except for Viper (table 3).
Besides its primary role in shortening legumes’ cooking times, soaking has been reported to significantly reduce legumes’ vitamin and mineral content (Annor et al., 2014). So, it is essential to determine the solids lost during this process. In our study, SSL values varied between 0.412 and 6.135 (table 3) with a mean value of 1.57% (table 2).
PC was 24.33% on average (table 2), in accordance with the values previously reported in the literature for peas (Coyne et al., 2005; Nikolopoulou et al., 2007). The values for smooth seeds were lower than the ones for wrinkled seeds (table 3). Coyne et al. (2005) evaluated 477 accessions from USDA germplasm and found that mean seed protein concentration of round seeds was 20.62%, while the mean for wrinkled seed was higher (23.76%).
Understanding genetic variability among genotypes is vital for selecting lines with an excellent nutritional profile. The values for a phenotypic variance were higher than those for the genotypic variance regarding WHC, PC, F, CD, and MC but similar for the rest of the traits. The highest PCV and GCV observed for SW, WHC, and CD imply that promising parental lines for breeding these traits can be selected. Moreover, the low PCV and GCV values observed for pH and MC revealed insufficient variability to initiate a breeding program for these traits. The slight differences between PCV and GCV for SW, MD, pH, and TA traits indicate that variability was predominately due to genotypic differences.
The heritability estimates provide background genetic information on the progenies inheriting their parents’ traits and the amount of genetic progress that can be made in selecting a trait or traits of interest (Gerrano, 2017). The high value of heritability for SW, MD, pH, and TA traits suggests that they are under less environmental influence. However, note that the total genotypic variance comprises additive genetic variance and non-additive or non-fixable variance (Sarker et al., 2016).
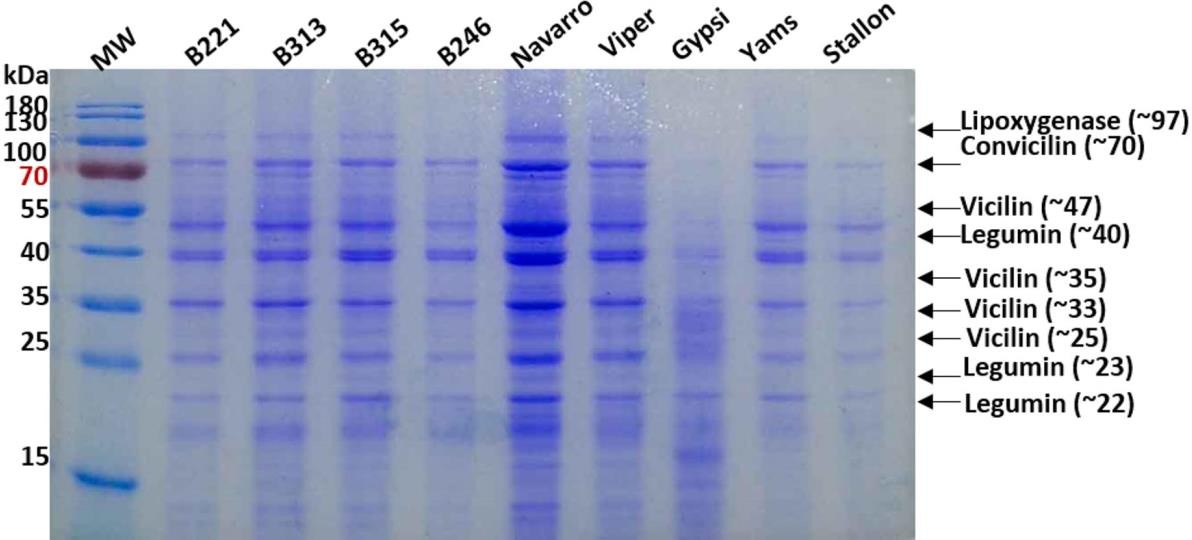
Differences in the composition of extracted protein were recorded, affecting the nutritional profile, functionality, and applications of peas in the food industry. SDS-PAGE showed the presence of four subunits of vicilin (47.3, 35.0, 33.0, and 25 kDa), one subunit of convicilin (70.0 kDa), three subunits of legumin (40.0, 23.0, and 22.0 kDa), and minor bands of lipoxygenase and protease inhibitor (97.0 and 11.0 kDa) (figure 1). Subunits of vicilin (47.0 kDa) and legumin (40.0 kDa) were dominant in all genotypes’ extracts (table 4). Gypsi contains more legumin than the other genotypes, which is more beneficial from a nutritional point and contains less convicilin, making it suitable for the food industry (Barac et al., 2010; Tzitzikas et al., 2006).
Source: Elaborated by the authors
Figure 1. Electrophoretic patterns of pea protein extracts in reducing conditions. The MW of standard bands is on the left and the subunit estimated with each band on the right. The names of the lines evaluated are on the top.
Table 4. Protein composition of pea lines
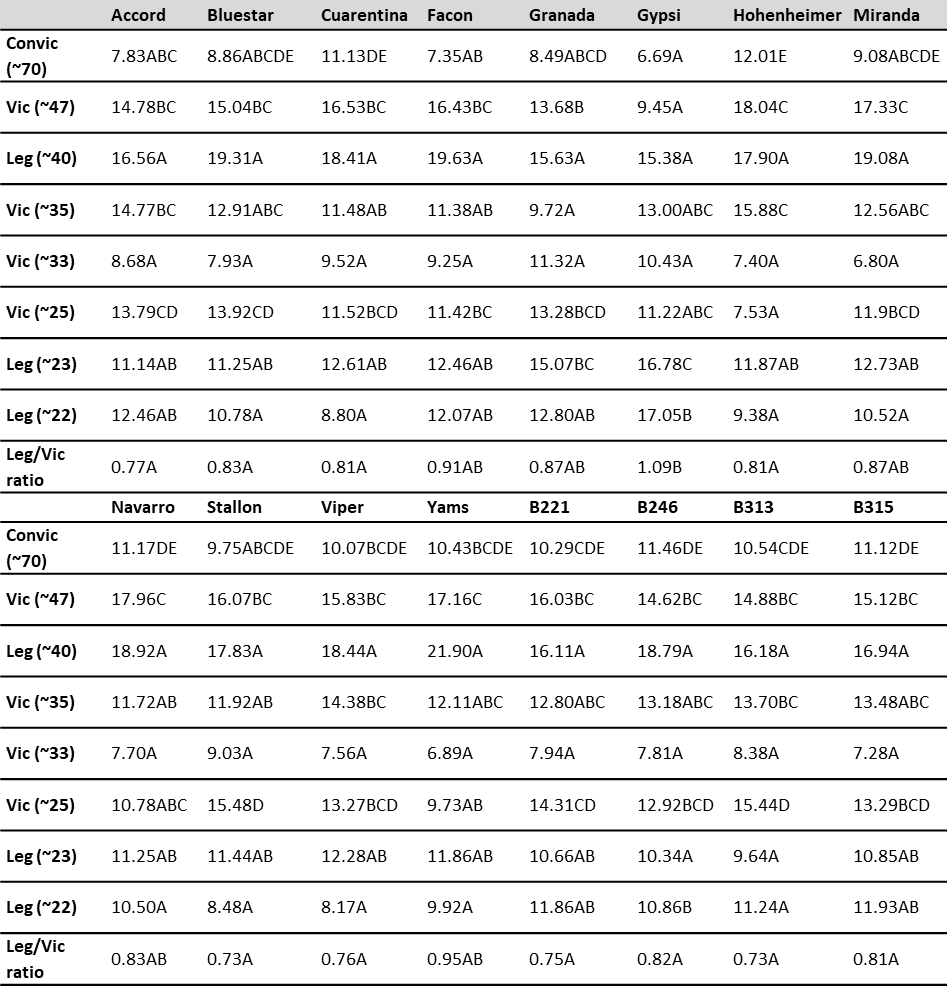
Note.Vic: vicilin; Leg: legumin; Convic: convicilin; Leg/Vic ratio: legumin to vicilin ratio. According to the Duncan’s test, different letters mean significant differences (p < 0.05).
Source: Elaborated by the authors
The legumin/vicilin ratio varied between 0.73 and 1.09 (table 4), which agrees with the literature’s values (Lam et al., 2018). The ratio was similar for the smooth and wrinkled groups, which is not consistent with Gueguen and Barbot’s (1988), who showed that wrinkled genotypes had lower legumin proportions.
The present study supports the existence of a positive relationship between PC and legumin/vicilin ratio for peas (r = 0.36, p < 0.05), as observed in Mertens et al. (2011).
The appearance of uniform pea color is the most critical quality criterion in international markets. Color values of peas were expressed as Hunter color values. B values showed a normal distribution, while L and A values did not (table 2). ANOVA for B determined that differences between varieties were statistically significant, with low values for green varieties (tables 1 and 2). The Kruskal-Wallis test found no significant differences between varieties for L and significant differences for A, with lower values for green varieties, as expected (tables 1 and 2). Cluster analysis based on Hunter color values L, B, and A revealed four principal clusters. Group 3 contained the six green lines; Group 4 consisted of the six yellow lines and two wrinkled ones, Gypsi and Accord. Group 1 and Group 2 included only one line, Hohenheimer and Granada, respectively. There was a variation in color in wrinkled genotypes since they have not been selected for color, and there was a mixture of seed coat color in the evaluated samples.
Seed color loss within a pea genotype is attributable primarily to either chlorophyll disappearance or bleaching. Chlorophyll disappearance may occur during growth and development, harvest, and storage. However, bleaching occurs mainly due to adverse environmental conditions during maturation (Atak et al., 2008). AA was performed to study color loss during storage.
Under the unfavorable conditions studied, all the genotypes experienced color changes. For Group 1 (Hohenheimer), we observed changes for L and A values according to a Student’s t-test; seeds became darker and less green. Meanwhile, for Group 2 (Granada), there were changes only for A values, with seeds becoming less green (table 5).
Table 5. Mean values before and after AA for different groups of seeds clustered by color Mean values and analysis of variance between lines for color change
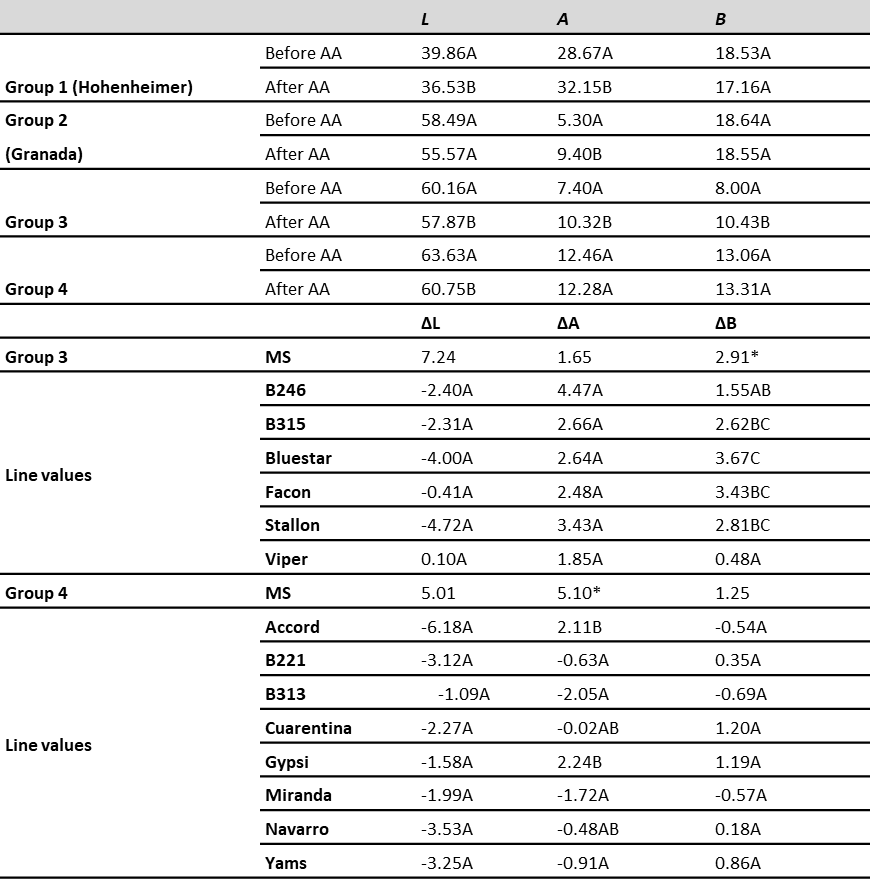
Note.L, A, and B: Hunter color parameters; ΔL, ΔA, and ΔB: changes in Hunter color parameters after applying AA; MS: mean squares; *: significant at p < 0.05. According to the Duncan’s test, different letters mean significant differences (p < 0.05).
Source: Elaborated by the authors
For Group 3, L, B, and A, values changed, and seeds became darker, less green, and more yellow. ANOVA revealed significant differences between lines in the color change only for B value, being Bluestar the line that experienced the biggest change and Viper the smallest one (table 5); the latter is recommended for more extended periods of storage. For Group 4, only L changed to darker values. ANOVA revealed no significant differences between lines in the color change for the L value (table 5). We performed correlation analyses to understand the interrelationships among the measured traits (table 6). As expected, SW had a significant positive correlation with MD (r = 0.68), as observed by Wang et al. (2010) (r = 0.95). Singh et al. (2010) reported a positive correlation between seed size and WHC, which was not observed in this study; however, there was a relationship between MD and CD (r = -0.47), i.e., a change in diameter due to hydration. On the other hand, we observed correlations between traits related to size and color (SW and A: r = 0.46, MD and B: r = 0.46); higher values of A and B imply less green and more yellow, so yellow varieties have larger MD and higher SW. There was a positive correlation between PC and TA (r = 0.59) that has not been observed in the literature, although a positive correlation was found between PC and pH (0.836) (Bashir et al., 2019). These authors also found a negative correlation between PC and SW (-0.984) that was not noted in this study or Coyne et al.’s (2005).
Table 6. Phenotypic correlation coefficients between different traits evaluated
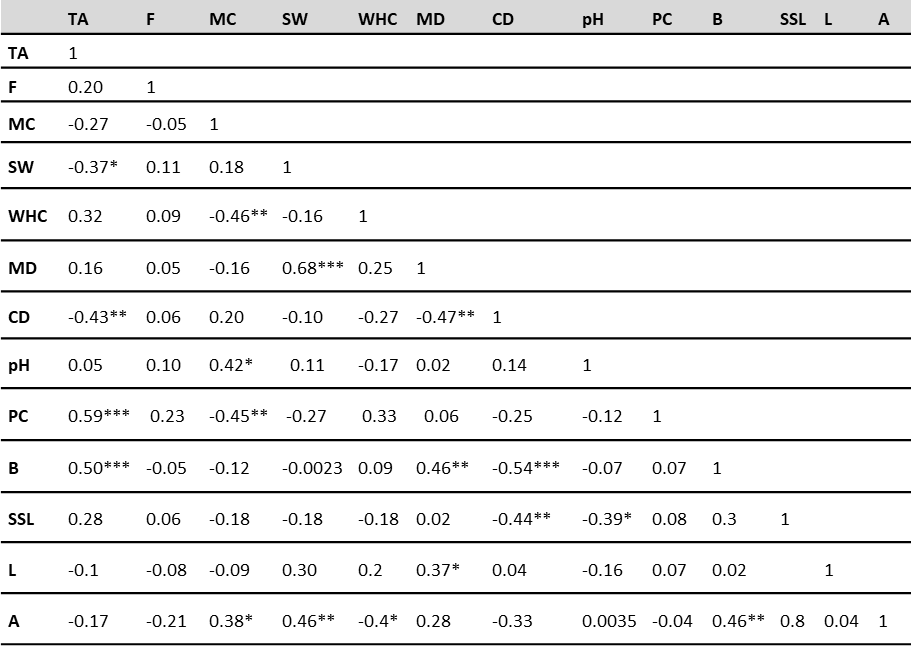
Note.MC: moisture content; SW: seed weight; WHC: water hydration capacity; SSL: soluble-solid loss; MD: diameter of pea seeds; CD: change in diameter; TA: titratable acidity; PC: protein content; F: firmness; L, A and B: Hunter color parameters. The Pearson coefficient was calculated for normal data (MC, SW, WHC, MD, CD, pH, TA, PC, F, B) and the Spearman coefficient for non-normal data (SSL, L, A). *: significant at p < 0.05; **: significant at p < 0.01; ***: significant at p < 0.001.
Source: Elaborated by the authors
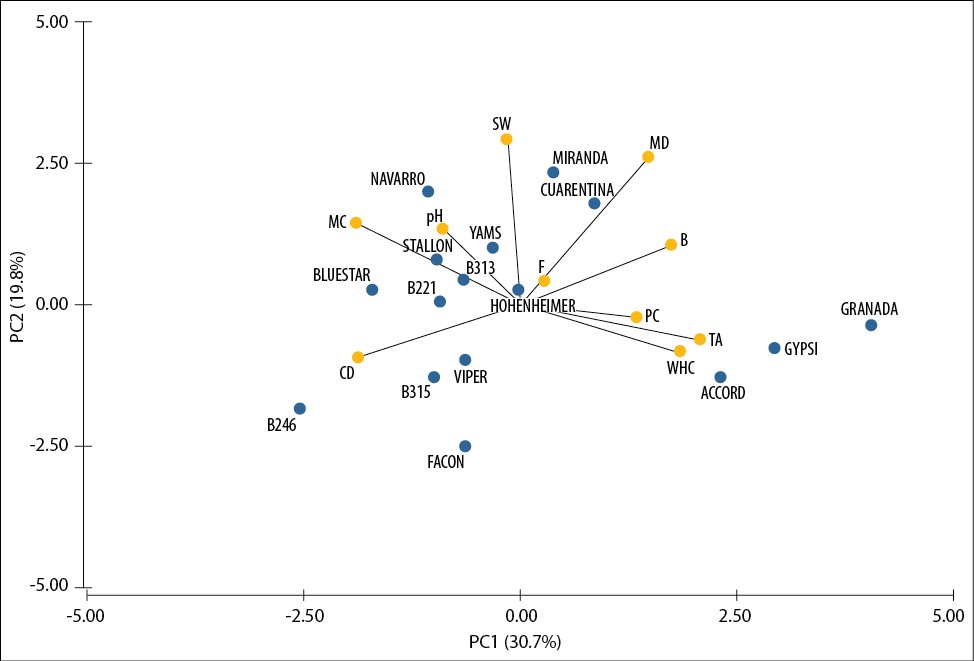
Finally, we carried out the PCA to gain insight into the similarities and differences among the 16 pea varieties. The distribution of the varieties according to the two principal axes of variation is presented in figure 2. The first two PCs only explain 51% of the total variation. If the third one is included, it accounts for 64% of the variation.
Source: Elaborated by the authors
Figure 2. Diagram showing the relationships between the evaluated lines based on the PCA.
MC, TA, CD, and WHC were the variables that contributed most to the first coordinate, whereas PS and MD contributed the most to the second coordinate. Although information about seed coat color and seed appearance was not included in the analysis, varieties were distributed according to these traits because of their non-normal distribution. Traits related to soaking behavior contributed most to the first coordinate, so wrinkled varieties had the highest values. Traits related to size contributed to the second coordinate, and as they were correlated with color traits, the distribution of the lines according to their color is expected, with yellow varieties showing the highest values.
Conclusions
Determining the pea’s physicochemical properties is essential for controlling its performance in breeding programs and processing operations. This research shows significant diversity in the pea’s properties; moreover, according to genetic parameters, most of the traits were under the control of genotypic variance. B315, with higher SW and WHC, and Gypsi, with a favorable protein composition, are suitable for processing. These materials could be used as varieties for industry or exploited in pea quality breeding programs. It is necessary to conduct further studies to enhance accuracy and reduce error, considering the possible influence of multiple environments on the physicochemical composition.

