


 English (pdf)
 Article in xml format
 Article references
 Send this article by e-mail
 Cited by SciELO
  Cited by Google
  Similars in
SciELO
Similars in
SciELO  Similars in Google
 Permalink
Introduction
Lettuce, Lactuca sativa L. (Asteraceae), stands out as one of the most widely consumed leafy vegetables globally due to its importance as a source of vitamins and minerals, being used mainly in salads for in natura consumption. Crisphead lettuce is the preferred type, having a better flavor, more resistance to diseases, ease to handle and transport due to its leaf arrangement, and a longer shelf-life (Santos et al., 2009).
In Brazil, lettuce is the most economically important vegetable. The primary production region is the State of São Paulo, where it is generally cultivated intensively, in all seasons of the year, in conditions of family farming, and in small properties located in peri-urban areas or the green belts of large urban centers (Filgueira, 2008; IEA, 2015).
The diversity of environments in which lettuce is grown in Brazil favors high genotypeenvironment (G×E) interaction. Having identified G×E interaction as significant, appropriate analyses are needed to efficiently select highly productive, stable, and adapted breeding material (Gualberto et al., 2009). Analysis of G×E interaction alone does not provide sufficient information about the best genotypes for each environment.
Simultaneous selection of productive, stable, and adapted genotypes requires methods based on mixed model equations (REML/BLUP - restricted maximum likelihood/best linear unbiased prediction). Their application has been disseminated in the analysis of information on genotypic stability and adaptability for different vegetables such as carrot (Daucus carota L.) (Silva et al., 2011), bean (Phaseolus vulgaris L.) (Torres et al., 2015; Torres et al., 2017), strawberry (Fragaria vasca L.) (Costa et al., 2015), pepper (Capsicum annuum L.) (Pimenta et al., 2016), and recently lettuce (Lactuca sativa L.) (Candido et al., 2018; Silva et al., 2019). REML/BLUP orders genotypes based on their genetic values and stability, referring to the BLUP procedure under harmonic means (Resende, 2002). The lower the standard deviation of the genotypic performance between environments, the higher their harmonic mean of genotype values (HMGV); therefore, selection of the highest values of the HMGV implies selection of the traits evaluated and stability (Resende, 2007).
Adaptability refers to the relative performance of genotype values (RPGV) in all environments. In this case, the predicted genotypic values (or the original data) are expressed as a proportion of each environment’s general mean, and, subsequently, the mean value of this proportion is obtained across environments. Simultaneous selection of the evaluated traits, stability, and adaptability in the context of mixed models can be performed using the harmonic mean of the relative performance of genotypic predicted value method (HMRPGV) (Resende, 2007; Silva et al., 2011).
The present work aims to identify crisphead lettuce breeding lines superior in production, stability, and genotypic adaptability in different growing environments in the State of São Paulo, Brazil, using the REML/BLUP method after five and six generations of selections. The second aim is to identify the G×E interaction in these groups of lettuce lines and cultivars.
Materials and methods
Experimental sites
Twelve experimental trials were carried out in lettuce-producing areas of the State of São Paulo during the autumn-winter, winter, spring, and summer seasons in the municipalities of Monte Alto (MA), São Simão (SS), Aramina (A), Mogi das Cruzes (MC), Biritiba Mirim (BM), and Salesópolis (S), whose climatic conditions are described in table 1. Crisphead lettuce genotypes are composed of eight advanced lines between F5 and F6 generations, L1, L2, L3, L4, L5, L6, L7, L8, and the commercial cultivars Vanda and Vera.
Tabla 1. Climatic characteristics of the municipalities of the State of São Paulo, where experimental trials were set up to evaluate the production, stability and adaptability of eight lines of crisphead lettuce and the commercial cultivars Vanda and Vera.
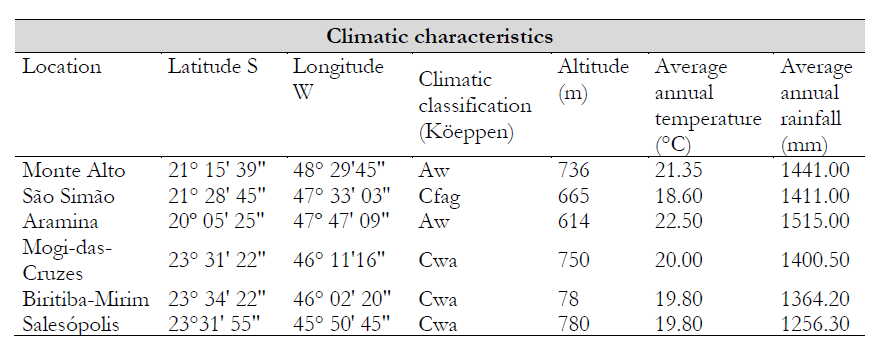
Note. CfaHumid tropical climate; Cwa: Humid temperate climate with dry winter and hot summer;
AwTropical climate with dry winter season.
Source: Weather station of institute of Astronomy, Geophysics and Atmospheric Science of the University of São Paulo
Crops were grown in the open field: one crop in autumn winter, five in winter, one in spring, and five in summer. The experimental design for all trials was a randomized complete block with four replications, considering each trial as an environment. The cultivation cycles of each environment from transplantation to harvest are presented in table 2.
Tabla 2. Twelve different growing environments for crisphead lettuce in the State of Sao Paulo, Brazil
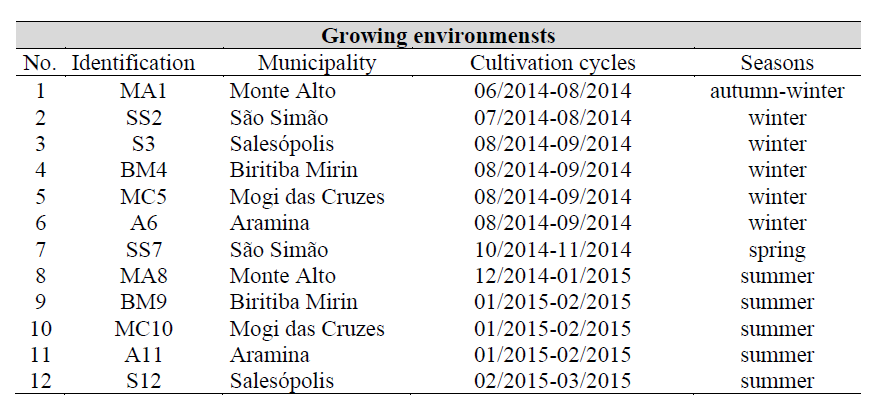
Source: Elaborated by the authors
Plant genetic material
The advanced crisphead lettuce lines were obtained using the pedigree method of the crisphead lettuce genetic improvement program, Paulista State University, Brazil (Tobar-Tosse, 2015). They come from the initial crosses between the JAB 4-13-7 line (male parent, possessor of Bremia lactucae resistance factor R18) and commercial cultivars: Argelis (A) (possessor of B. lactucae resistance factor R38), Vanda (V), Veneranda (Vn), and Solaris (S) (female parents) as presented in table 3.
Tabla 3. Advanced crisphead lettuce lines possessing Bremia lactucae resistance factors R18 and R38
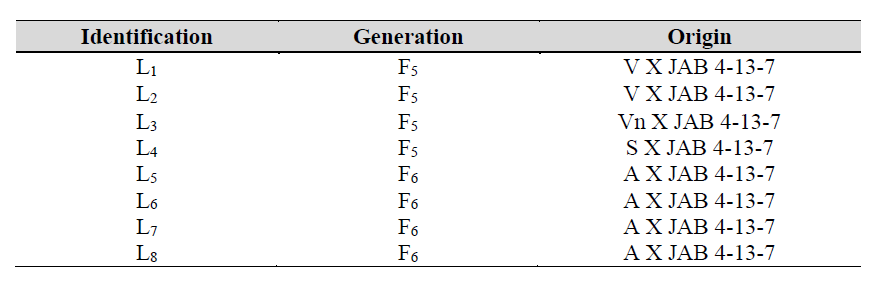
Note.Advanced lines of crisphead lettuce obtained from crosses between commercial cultivars Vanda (V), Veneranda (Vn), Solaris (S), and Argelis (A) (resistance factor R38, female parent) with line JAB 4-13-7 (resistance factor R18, male parent).
Source: Elaborated by the authors
These crisphead lettuce lines have the resistance factors R18 and R38 to the downy mildew races (Bremia lactucae) SPBl:01, SPBl:02, SPBl:03, SPBl:04, SPBl:05, SPBl:06, SPBl:07, SPBl: 09, SPBl:10 SPBl:11, and SPBl:12 that arose in the State of São Paulo (Castoldi et al. 2014; Tobar-Tosse et al., 2017). They are characterized by light-green leaves of high frizziness, large plant size, absence of lateral shoots, tolerance to early flowering, and tipburn in the summer season.
Field experiment descriptions
Each experimental plot consisted of four rows 1.75 m long with a distance between plants of 0.25 m in a triangular arrangement, totaling 28 plants per plot and evaluating the six central plants. Cultivation practices were followed according to the needs of the crop and the horticulturist recommended management practices.
Data collection
When lettuce reached market maturity, approximately 35 (spring-summer) and 45 days after transplanting (autumn-winter), the following characteristics were assessed:
i) Total production in g/plant (TP): The average of the fresh mass of the aerial part of six plants (without removing the outer leaves)
ii) Commercial production in g/plant (CP): The average of the fresh mass of the aerial part of six plants, after removing the outer leaves and remaining stem of the plant
iii) Number of leaves/plant (NL): The number of leaves counted, considering those longer than 1.5 cm
REML/BLUP analyses
Stability and adaptability were evaluated using the Selegen program (Resende, 2016), which employs the REML/BLUP methodology, considering statistical model 51 for the genetic evaluation by the highest values of the HMGV. The significance of the model’s effects was estimated by deviance analysis, and the genetic parameters according to Resende (2007).
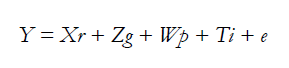
Model 51 considers the randomized complete block experimental design. In the model, the ten genotypes of crisphead lettuce in twelve growing environments were included (Equation 1).
 (1)
(1)
where Y = data vector; r = vector of repetition effects (fixed) in addition to the general mean; g = vector of genotypic effects (random); p = vector of plot effects (random); i = vector of G×E interaction effects (random); e = vector of the error or residuals (random). Capital letters represent the incidence matrices for the purposes above.
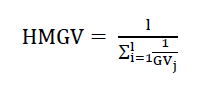
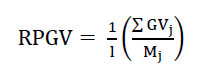
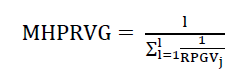
The values of HMGV for stability, RPGV for adaptability, and HMPRGV for productivity, stability, and adaptability simultaneously, for all genotypes, were obtained according to Resende (2007) (Equations 2, 3, and 4):
 (2)
(2)
 (3)
(3)
 (4)
(4)
where l = number of environments; GV = genotypic value; j = genotypes.
Results and discussion
Components of variance and genetic parameters
The genotype selection precision parameter (Acgen) defined by Resende and Duarte (2007) varied from high (0.71) for CP to very high (0.95) for NL, indicating a high correlation between the predicted and actual genotypic values. These results are like those obtained by Silva et al. (2019) for an Acgen of 0.98 for NL and 0.80 for yield in lettuce cultivars under different environmental conditions in Mossoró, RN, Brazil (table 4).
Table 4. Estimation of variance and genetic parameters for total production (TP), commercial production (CP), and number of leaves/plant (NL) in crisphead lettuce
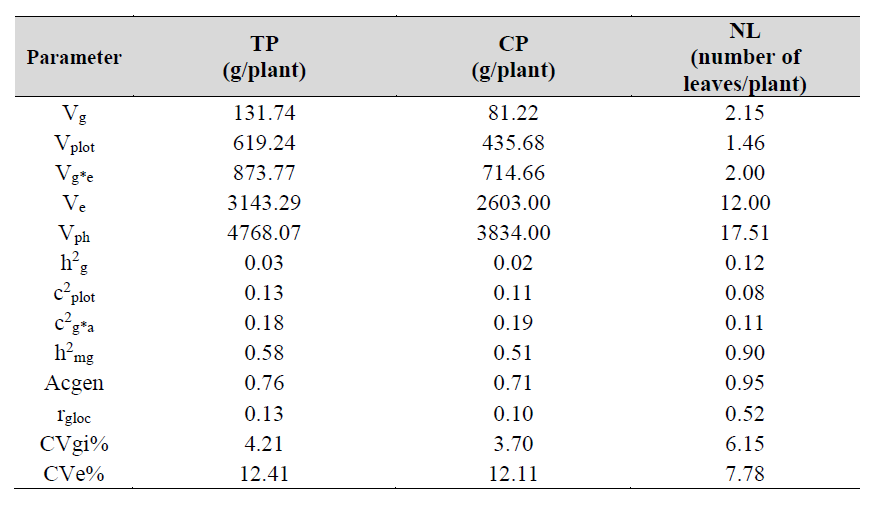
Note.Vg: genotypic variance; Vplot: environmental variance between plots; Vg*e: variance of the G×E interaction; Ve: residual variance; Vph: individual phenotypic variance; h2g: individual heritability in the broad sense, that is, of the total genotypic effects; c2plot: coefficient for determining the plot effects; c2g*e: coefficients of determination of the G×E interaction effects; h2mg: heritability of the genotype mean, assuming complete survival; Acgen: precision of genotype selection, assuming complete survival; rgloc: genotypic correlation between performance in various environments; CVgi%: coefficient of genotypic variation; CVe%: coefficient of environmental variation.
Source: Elaborated by the authors.
The effect of genotypes was significant (P < 0.05) for TP, CP, and NL, indicating differential performance among lettuce genotypes (table 5). The production observed in this research was higher than the one observed by Candido et al. (2018) for the same genotypes but in seven different cropping systems during two seasons in the municipality of Jaboticabal, SP, Brazil.
Tabla 5. Global analysis of joint deviance (ANADEV)
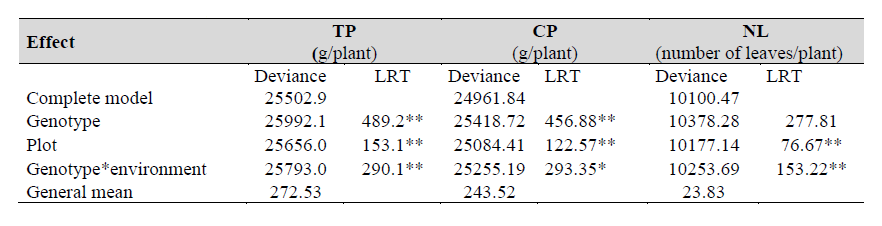
Note.** and *: significance at 1 and 5 % probability, respectively, by mixed models’ likelihood ratio test (LRT).
Source: Elaborated by the authors.
The heritability of the genotype mean, assuming complete survival (h2mg), was estimated when the means of the blocks were used as genotype evaluation or selection criteria. The h2mg values found in this work ranged from medium for CP (0.51) to high for NL (0.90); the greater this value, the better the reliability in selecting genotypes based on genotype values. These results agree with the ones found by Silva et al. (2019) in crisphead, American, mimosa, and smooth lettuce genotypes for NL with a high h2mg value of 0.96 (table 4).
On estimating the individual heritability in the broad sense (h2g), considering the total genotypic effects, low values were found for the production characteristics evaluated, varying from 0.02 for CP to 0.12 for NL, as shown in table 3. Similarly, Candido et al. (2018) on evaluating the identical genotypes of crisphead lettuce in the municipality of Jaboticabal, SP, Brazil, in seven different cropping systems, found low h2g values for TP (0.001 + 0.004), CP (0.001 + 0.004), and NL (0.132), which is consistent with the polygenic nature and therefore quantitative inheritance of these characteristics.
The phenotypic value of a trait generated in field trials is composed of the genetic effect, environment effect, and interaction effect of a genotype in a specific environment. Thus, the sum of the genotypic variance (Vg), the environmental variance between plots (Vp), the variance of the G×E interaction (Vg*e), and residual variance (Ve) results in individual phenotypic variance (Vph).
This study confirmed that the environmental component contributed the most to the expression of productive characteristics (table 4), as verified by Candido et al. (2018) in identical genotypes and Silva et al. (2019) in different types of lettuce for the yield characteristic Mg/ha, except in NL, where the genetic component made the biggest contribution to phenotypic variance.
The G×E interaction effect in TP and CP was more significant than the genotypic effect, while for NL, the genotypic effect was greater than the G×E interaction (tables 4 and 5). These results agree with those obtained by Candido et al. (2018) and Silva et al. (2019). The significant effect of the G×E interaction indicates a differential behavior of the lettuce genotypes across the different growing environments, commonly found in the evaluation of lines and cultivars adapted to several geographical regions in Brazil (Blind & Silva, 2015; Candido et al., 2018; Gualberto et al., 2009; Luz et al., 2009; Silva et al., 2019).
The c2plot component quantifies how much of the phenotypic variance is explained by the environmental variance component between plots, and the c2g*e quantifies how much of the phenotypic variance is explained by the variance component of the G×E interaction. The environmental variance between plots and the G×E interaction have more effect on TP and CP, explaining 12.9 % and 11.3 % for c2plot and 18.3 % and 18.6 % for c2g*e of the phenotypic variance, respectively, and the c2plot and c2g*e for NL was the lowest, 8.3 % and 11.4 %, respectively (table 4).
The mean genotypic correlation (rgloc) of the genotypes’ performance in the environments shows how constant the order of the genotypes is and, therefore, the magnitude of the complex interaction. In this parameter, the rgloc estimates were low for TP (0.131) and CP (0.102) and moderate for NL (0.517). These correlations corroborate the previously mentioned results of Ve for TP, CP, and NL, indicating that G×E interaction is vital for TP and CP but not for NL.
Genotypic values
According to the classification order by genotypic value of the joint analysis presented in tables 6 and 7, most breeding lines outperformed the commercial Vanda and Vera cultivars in TP and CP. Conversely, L5 ranked together for TP with the commercial cultivars among the three worstperforming genotypes. Meanwhile, the lines that outperformed the commercial cultivars in NL were L7, L8, L6, L4, and L2; the other lines barely surpassed Vera and were classified among the five least productive genotypes.
Table 6. Genotypic values (GV) for total production/plant (TP) and their rankings in parenthesis (order of sorting by the highest genotypic values) of ten genotypes of crisphead lettuce, including eight advanced lines and two commercial cultivars in twelve growing environments, in the State of São Paulo, Brazil.
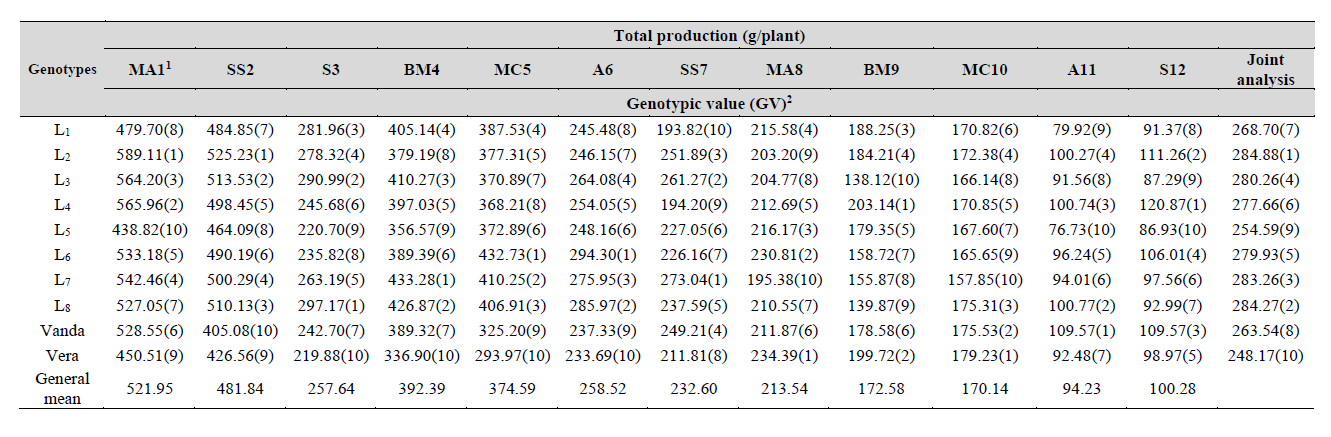
Note. 1Growing environments: MA1-Monte Alto 1, 06/2014-08/2014 (autumn-winter); SS2 - São Simão 2, 07/2014-08/2014 (winter); S3- Salesópolis 3, 08/2014-09/2014 (winter); BM4-Biritiba Mirin, 08/2014-09/2014 (winter); MC5-Mogi das Cruzes 5, 08/2014-09/2014 (winter); A6-Aramina 6, 08/2014-09/2014 (winter); SS7-São Simão 7, 10/2014-11/2014 (spring); MA8-Monte Alto 8, 12/2014-01/2015 (summer); Biritiba Mirin-9, 01/2015-02/2015 (summer); MC10-Mogi das Cruzes 10, 01/2015-02/2015 (summer); A11-Aramina 11, 01/2015- 02/2015 (summer); S12-Salesópolis 12, 02/2015-03/2015 (summer).
2Genotypic values = ((uj+g+gem): General mean plus the genotype effect and the mean interaction for total production in g/plant.
Source: Elaborated by the authors.
Table 7. Genotypic values (GV) for commercial production/plant (CP), and their rankings in parenthesis (order of sorting by the highest genotypic values) of ten genotypes of crisphead lettuce, including eight advanced lines and two commercial cultivars in twelve growing environments, in the State of São Paulo, Brazil.
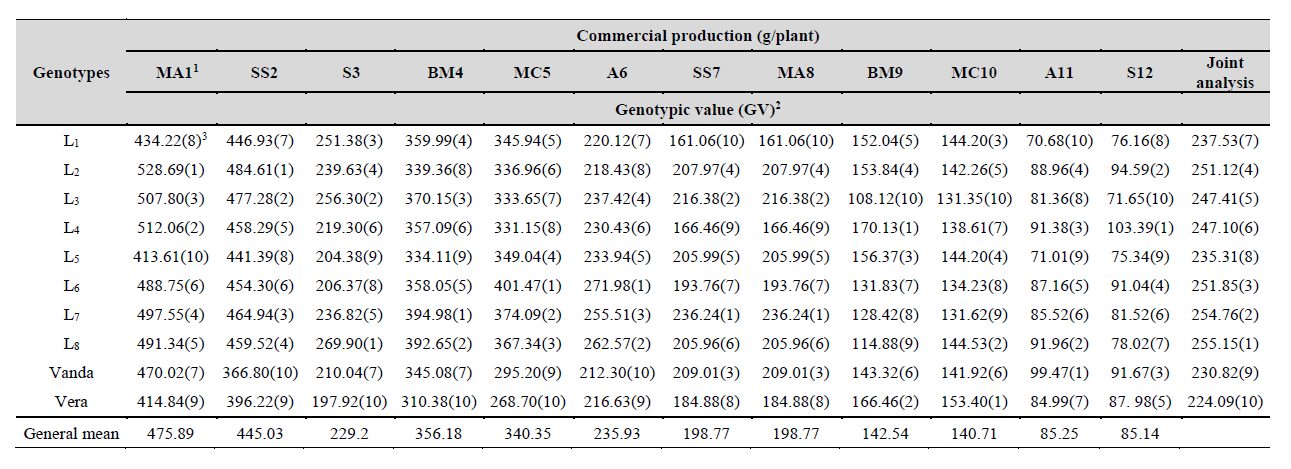
Note. 1Growing environments: MA1-Monte Alto 1, 06/2014-08/2014 (autumn-winter); SS2 - São Simão 2, 07/2014-08/2014 (winter); S3- Salesópolis 3, 08/2014-09/2014 (winter); BM4-Biritiba Mirin, 08/2014-09/2014 (winter); MC5-Mogi das Cruzes 5, 08/2014-09/2014 (winter); A6-Aramina 6, 08/2014-09/2014 (winter); SS7-São Simão 7, 10/2014-11/2014 (spring); MA8-Monte Alto 8, 12/2014-01/2015 (summer); Biritiba Mirin-9, 01/2015-02/2015 (summer); MC10-Mogi das Cruzes 10, 01/2015-02/2015 (summer); A11-Aramina 11, 01/2015- 02/2015 (summer); S12-Salesópolis 12, 02/2015-03/2015 (summer).
2Genotypic values = ((uj+g+gem): General mean plus the genotype effect and the mean interaction for commercial production in g/plant.
Source: Elaborated by the authors
In the joint analysis of the twelve environments, the three genotypes with the highest genotypic value were lines L2, L8, and L7 for TP; L8, L7, and L6 for CP; lines L7, L8, and L6 and for NL. On verifying these lines’ performance across the environments, and according to c2gxa and rgloc values, we observed the predominance of the complex component of G×E for TP and CP and a medium genotypic correlation for NL. Thus, the order of the genotypes across the environments for TP, CP, and NL varied moderately (table 8).
Table 8. Genotypic values (GV) for number of leaves/plant (NL) and their rankings in parenthesis (order of sorting by the highest genotypic values) of ten genotypes of crisphead lettuce, including eight advanced lines and two commercial cultivars in twelve growing environments, in the State of São Paulo, Brazil.
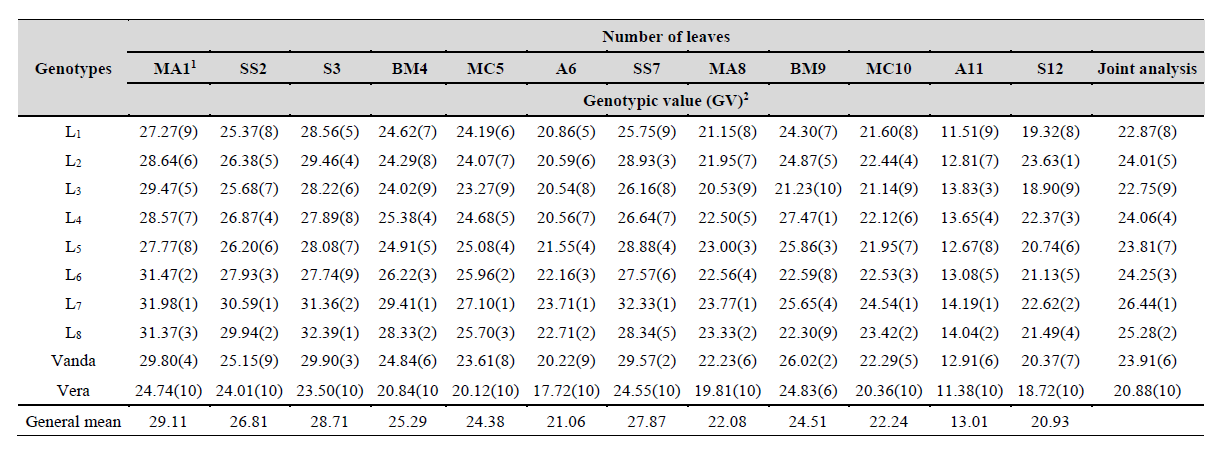
Note. 1Growing environments: MA1-Monte Alto 1, 06/2014-08/2014 (autumn-winter); SS2 - São Simão 2, 07/2014-08/2014 (winter); S3- Salesópolis 3, 08/2014-09/2014 (winter); BM4-Biritiba Mirin, 08/2014-09/2014 (winter); MC5-Mogi das Cruzes 5, 08/2014-09/2014 (winter); A6-Aramina 6, 08/2014-09/2014 (winter); SS7-São Simão 7, 10/2014-11/2014 (spring); MA8-Monte Alto 8, 12/2014-01/2015 (summer); Biritiba Mirin-9, 01/2015-02/2015 (summer); MC10-Mogi das Cruzes 10, 01/2015-02/2015 (summer); A11-Aramina 11, 01/2015- 02/2015 (summer); S12-Salesópolis 12, 02/2015-03/2015 (summer).
2Genotypic values = ((uj+g+gem): General mean plus the genotype effect and the mean interaction for the number of leaves per plant.
Source: Elaborated by the authors.
On comparing the values of the general means of the environments in autumn and winter seasons with the environments in spring and summer seasons, we noted that the lettuce crop is more adapted to autumn and winter conditions (environments: MA1, SS2, S3, BM4, MC5, and A6) (tables 6 and 7). The lines L1, L2, L3, L4, L5, L6, L7, and L8 have resistance factors R18 and R38 to B. lactucae races and show promising results for cultivation during winter where the appearance of lettuce downy mildew disease is frequent. In particular, the L8 line stands out among the three most productive in the set of twelve environments and, specifically, in most of the environments with the autumn-winter season.
Some genotypes showed specific adaptability to the environment in which they were grown. For example, the L2 line for TP with the best genotypic performance in the MA1 and SS2 environments was the worst-performing in MA8. For CP, the L7 line with the best genotypic performance in the S3 environment ranked among the worst performers in the BM9 environment. The cultivar Vera performed better in the MA8, BM9, and MC10 environments, having a higher resistance to early flowering in summer cultivation (Feltrim et al., 2009). Perhaps, cultivar Vera has some tolerance to warmer temperatures that remains to be investigated.
The three best genotypes prominent in the joint analysis across environments had excellent performance in specific environments. It was found that the L2 line stood out among the three best-performing genotypes in at least four environments (MA1, SS2, SS7, and S12) for TP; L8 stood out among the top three genotypes in six environments (S3, BM4, MC5, A6, MC10, and A11) for TP and CP and the SS2 environment only for TP. The L7 line stood out in four environments (BM4, MC5, A6, and SS7) among the three superior genotypes, and in the SS2 and MA8 environments only for CP; and the L6 line in at least two environments (MC5 and A6) for CP (tables 6 and 7). The L7 and L8 genotypes were superior genotypes in the twelve environments for NL, except the BM9 environment for the L7 line and the SS7, BM9, and S12 environments for the L8 line. The L6 line behaved similarly in half of the environments evaluated (table 8).
The superiority of the commercial cultivars compared to the lines was generally noticeable in the environments with the summer season (MA8, BM9, MC10, A11, and S12). Breeding line L8 stood out among the three best genotypes along with one or both commercial cultivars in environments A11 and MC10 for TP and CP. Meanwhile, breeding line L4, although not outstanding in the joint analysis, was the most productive genotype for TP and CP in the S12 environment and TP, CP, and NL in the BM9 environment. Breeding lines L8 and L4 are possibly more tolerant to early flowering than the others.
The lettuce crop is better adapted to winter months and shows differential responses to different cultivation environments (cultivation systems, municipalities, seasons) (Brzezinski et al., 2017; Candido et al., 2018; Feltrim et al., 2009; Gualberto et al., 2009; Queiroz et al., 2014; Sediyama et al., 2009; Silva et al., 2019). The lack of adaptation of lettuce to conditions of high temperature and higher number of light hours may accelerate the reproductive phase and, therefore, the early elongation of the flower stem. This phenomenon is also known as early bolting and makes lettuce unfit for consumption due to the production of milky latex that gives the leaves a bitter taste (Luz et al., 2009).
However, the cultivation of genotypes in a wide range of sites or conditions (environments) is of interest to seed producers of lettuce and other vegetables. It would increase their profitability by targeting several environments for cultivar release. Identifying productive lettuce genotypes with the highest stability and adaptability in the twelve environments evaluated would attenuate the G×E interaction (Torres et al., 2017). In the context of mixed models, the HMRPGVBLUP technique allows incorporating stability, adaptability, and the mean value of the characteristics of interest into a single genotypic data model (Resende, 2002) that can be used for selection (table 9).
Table 9. Harmonic mean of genotypic values (HMGV), relative performance of genotypic values (RPGV), RPGV*general mean (GM), harmonic mean of the relative performance of genotype values (HMRPGV) and HMRPGV*general mean (GM) for total production, commercial production, and number of leaves/plant
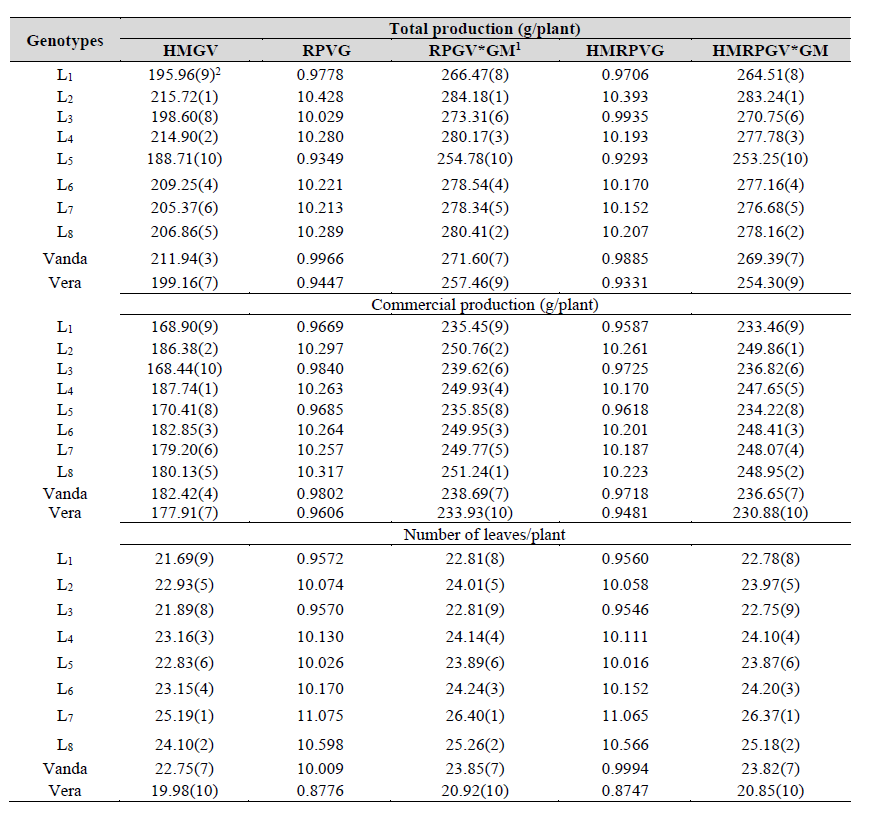
Note 1.General mean;
2Order of sorting by the highest values of HMGV, RPGV*GM, and HMRPGV*GM.
Source: Elaborated by the authors.
Stability of genetic values (MHVG)
HMGV is a parameter that allows selection based on production and stability. According to this parameter, the L2, L4, and Vanda genotypes stood out for TP; lines L4, L2, and L6 were higher for CP; and lines L7, L8 and L4 stood out for NL.
Adaptability of genetic values (RPGV)
Adaptability is the ability of the genotype to respond positively to the best environment (Silva et al., 2019). RPGV is used to identify this characteristic, which capitalizes the response of each genotype to the best environments. The results were similar to HMGV; thus, for TP, the best genotypes were lines L2, L8, and L4; for CP, L8, L2 and L6, L6; and for NL, L7, L8, and L6.
Stability and adaptability of genetic values (HMRPGV)
The HMRPGV method, based on the genotypic values predicted by mixed models, groups together production, stability, and adaptability in a single statistic, facilitating the selection of superior genotypes uniquely (Resende, 2007). The HMRPGV*MG provided the genotypic value of each genotype penalized for instability and capitalized for adaptability in the unit of measurement of the characteristic concerned. Most of the lines outperformed the commercial cultivars, except lines L5 and L1 for PT and PC and L3 and L1 for NL (table 9).
For TP, the L2, L8, andL4 lines with the best performance responded with mean values of 1.0393, 1.0207, and 1.0193 times, respectively, to the mean of the environment where they were cultivated. For CP, the L2,L8, and L6 lines with the best performance responded with a mean value of 1.0261, 1.0223, and 1.0201 times, respectively, and for NL, the L7, L8, and L6 lines were superior, responding 1.1065, 1.0566, and 1.0152 times, respectively, to the mean of culture environments. Lines L6 and L8 were also reported by Candido et al. (2018) as the most productive, stable, adapted, and superior to commercial cultivars in eight different growing environments in the municipality of Jaboticabal State of São Paulo, Brazil.
REML/BLUP can be useful when selecting yield-related traits (CP, TP, and NL) but remains to be identified if the model can be helpful when selecting other traits against lettuce diseases and pests targeted by breeding programs.
Conclusions
According to the discrimination of genotypes using the REML/BLUP mixed model methodology, crisphead lettuce breeding lines L2, L8 and L4 were the most productive, stable, and adapted for total production, L2, L8, and L6 for commercial production and L7, L8, and L6 for the number of leaves. The lettuce lines mentioned above outperformed Vanda and Vera commercial cultivars regarding these characteristics in lettuce-growing environments in Sao Paulo, Brazil.

