


 Inglês (pdf)
 Artigo em XML
 Referências do artigo
 Enviar este artigo por email
 Citado por SciELO
  Citado por Google
  Similares em
SciELO
Similares em
SciELO  Similares em Google
 Permalink
Introduction
The potato, Solanum tuberosum L. (Solanaceae), is native to the Andes Mountains in South America, ranks as the world’s third most important food crop after wheat and rice, and is grown in over 125 countries (Dlamini, 2018; Zhang et al., 2017). China is currently the largest potato producer at 99,205,580 tons (t) per year, followed by India (48,605,000 t) and Russia (29,589,976 t) (Food and Agriculture Organization of the United Nations [FAOSTAT], 2020; Ministerio de Agricultura y Desarrollo Rural [MADR], 2020).
In Colombia, potatoes are grown at altitudes of 2,200 to 3,400 meters above sea level, and there are more than thirty known varieties, of which only ten are considered of commercial importance (Agronet, 2020; Osorio et al., 2012). Potato production in 2019 was reported at 2,701,062 t, with a total cultivated area of 128,622 hectares (ha) and an average yield of 21.0 t/ha. Potato production was concentrated in the departments of Cundinamarca (37 %), Boyacá (27 %), Nariño (20 %) and Antioquia (6%) (Agronet, 2020).
Potato production is undoubtedly a vital part of the total Colombian economy, as it accounts for 3.3 % of the country’s Agricultural Gross Domestic Product and is the primary source of income for more than 100,000 farmers. During the 2015-2018 period, potato production was responsible for creating 264,000 jobs, of which 75,000 were for directly employed workers and 189,000 for indirectly employed workers (Federación Colombiana de Productores de Papa [Fedepapa], 2020; MADR, 2019).
The study of agricultural supply response has long been a subject of discussion among economists and has received much attention in the literature. Various methods have been used to study agricultural supply response, the appropriateness of which depends to some extent on the type of crop, the available data, and the decision-making processes they are intended to support. According to Huq and Arshad (2010), most empirical research is based on the application, modification, and extension of the Nerlove (1958) framework. The Nerlove model, which is a partial adjustment and adaptive expectations model, describes the dynamics of supply response using price expectations. In its traditional version, it consists of three equations where the optimal output (Q*t) is a function of expected price (Pet), as shown in equation (1) (Askari & Cummings, 1977; Kohli, 1996).
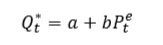 (1)
(1)
Furthermore, it is assumed that price expectations are adaptive and, as such, are reviewed every year and adjusted to the difference between the actual price in the previous period and the expected price. A delayed output adjustment within the agricultural production cycles is also assumed, as shown in equations (2) and (3).
 (2)
(2)
 (3)
(3)
The Nerlovian approach has several advantages, including that it is a simple procedure and allows flexibility when developing dynamic specifications (Shahzad et al., 2018). Nevertheless, the major criticisms of the approach are that the formal theory it uses is inadequate and that when using the standard ordinary least square (OLS) technique, spurious regression results may occur if variables are non-stationary. Moreover, using conventional empirical procedures means that own-price short- and long-run supply responses are likely to be underestimated (Obayelu & Ebute, 2016; Tripathi & Prasad, 2009).
Another commonly employed model for estimating supply response is the dual approach derived from the primal profit maximization and cost minimization methods. It assumes that farmers are profit-maximizing agents, price takers, and technically efficient and originates from a study by Hotelling (1932). From an empirical point of view, it requires detailed input prices, and the profit and demand function equations should be simultaneously estimated (Arnade & Kelch, 2007). According to Khan et al. (2018), the dual approach has been widely used in applied economics and has proven useful when analyzing the impact of price policy changes on farmers’ behavior. However, its major drawbacks are that the model uses integrated (non- stationary) series, which can lead to spurious regression, and is static. In other words, it does not present specific time lags; therefore, it is difficult to determine whether the estimated elasticities are short- or long-run values (Henneberry & Tweeten, 1991; Kohli, 1996; Tripathi & Prasad, 2009).
Given the limitations of the above supply response approaches, cointegration analysis using the error correction model (ECM) is believed to be a viable alternative, as it captures both the short-run dynamic relationship between cointegrated variables and their adjustments toward long-term equilibrium (Obayelu & Ebute, 2016). Furthermore, it provides both short and long- run elasticities and is consistent in dealing with non-stationary data (Lutkepohl, 2005). Two well-known and widely used methods for verifying cointegration are the Engle-Granger (1987) and Johansen (1988) procedures.
The Engle-Granger two-step method is based on a single equation that can be estimated using OLS regression and applying unit root tests to the residuals to identify stationarity. Johansen’s method, however, does not rely on OLS and instead uses a maximum likelihood estimation technique. Its advantage over the Engle-Granger procedure is that it can test two or more cointegrated series. On the other hand, one of its main weaknesses is that it requires a high number of observations, which are sometimes unavailable (Pekmeczci & Dilek, 2014).
Compared with the number of studies that have used variants of the Nerlovian approach, fewer studies have used the vector error correction model (VECM) and cointegration analysis to examine supply response to price. However, Huq and Arshad (2010) have used the VECM approach to estimate the supply response of potato farmers in Bangladesh for the 1982-2006 period. Their study found that producers react to harvest prices, as noted by significant short- and long-run elasticities. Likewise, Obayelu and Ebute (2016) have used cointegration and VECM to investigate the responsiveness of cassava output supply to price changes in Nigeria in the 1966-2010 period. Their results show a linear deterministic trend in the data and that cultivated area and own-prices jointly explain the variation in cassava output in both the short and long run.
Obayelu and Salau (2010) estimated the impact of Nigerian agricultural supply on prices and exchange rates in the 1970-2007 period. They concluded that both variables were significant in determining supply in the short and long run. Similarly, Mesike et al. (2010) evaluated the supply response of rubber farmers in Nigeria from 1970 to 2008 using error correction techniques and found that producer prices and a policy shift in the form of structural adjustment programs significantly affected the supply of rubber.
Mose et al. (2007) estimated the supply response of maize farmers in the Trans-Nzoia District for the 1980-2002 period. Their study found that farmers responded strongly to price incentives, as shown by the significant but negative short- and long-run elasticity of supply to fertilizer price and positive own-price elasticity in the short and long run.
According to the studies described above, potato supply is highly influenced by market price: price increases tend to increase output, and vice-versa. In addition, the time lag in terms of production is an important issue, as output is obtained months after planting; consequently, changes in market conditions raise many challenges for farmers (Huq & Arshad, 2010). Understanding the output supply response to price changes proves not only to be helpful information for evaluating the effectiveness of price policies in farmers’ resource allocation but also facilitates farmers’ output decisions. Price policies have long been the basis of farmers’ decisions in many countries, and any incentives or production planning will require detailed knowledge of supply factors (Tripathi & Prasad, 2009).
Given these points, the underlying aim of the present study is to estimate the potato output supply response to own-price and fertilizer price. Hence, based on Johansen’s cointegration analysis, a VECM was used as the appropriate tool for price transmission analysis. It not only overcomes the problems of spurious regression but also provides information about the short- and long-term relationships between time series.
The present paper is structured as follows: after the introduction, the second section provides relevant data and describes the proposed econometric methodology, the third section includes the empirical results, and the final two sections discuss the results and summarize the significant findings of this study.
Materials and methods
An explanatory, correlational, and non-experimental research design was selected to describe the relationships between the variables. The information required for the present study was obtained from the FAOSTAT, Fedepapa, and MADR databases.
Data
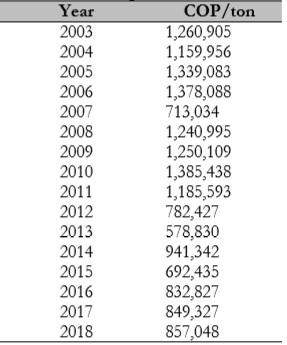
The data used in this study consist of annual time series spanning from 2003 to 2018. Due to the limited scope of this study, the variables were restricted to the mean annual potato and fertilizer prices in Colombian pesos (COP) and the country’s total potato production (tons).
The potato prices summarized in table 1 were obtained from FAOSTAT and deflated using the 2018 Colombian producers’ price index (IPP). All series were converted to natural logarithm form for economic interpretation. The data and regression model were analyzed using the E-views® 11 package (E-views, 2020).
Empirical specification
In a vector autoregression (VAR) model, all variables are considered endogenous, with each variable written as a regression of past lags of itself and the past lags of all other variables in a finite order system (Lawrence, 2012). When the variables are integrated as order I (1) and there is cointegration (i.e., there are relationships amongst the variables), the VECM can be derived from the vector autoregressive model (VARM); hence, the VEC model is a VAR model with cointegration constraints. However, a preliminary analysis of the data must be performed to confirm that the model specification is correct; this can consist of the unit root (stationarity) and cointegration tests. According to Hamilton (1994) and Lutkepohl (2005), the VEC model can be parameterized according to equation (4):
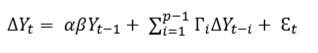 (4)
(4)
Where:
∆𝑌𝑡 = 𝑌𝑡 − 𝑌𝑡−1; 𝑌𝑡 is a p-dimensional column vector of non-stationary I (1) endogenous variables.
βYt−1 is the error correction term that reflects long-term equilibrium relationships between variables.
α is a full rank matrix that determines the speed of adjustment towards equilibrium.
Г is a n x 1 vector-matrix representing the lagged variables’ coefficients.
Thus, equation (5) was proposed:
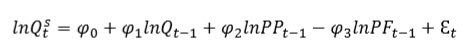 (5)
(5)
Where:
𝑙𝑛𝑄t 𝑠 is the quantity supply, 𝑙𝑛𝑄𝑡−1, 𝑙𝑛𝑃𝑃𝑡−1, and 𝑙𝑛𝑃𝐹𝑡−1 are the lagged quantity and own potato and fertilizer prices; 𝜑0 is the constant or intercept; 𝜑1, 𝜑2, and 𝜑3 are the long-run coefficients, and Ɛt is the error term.
The sign of each coefficient indicates the direction of the relationship between the independent and the response variables. A positive sign for lnPP is expected, as it indicates a direct relationship with production level. Meanwhile, lnPF should present an inverse relationship, as an increase in fertilizer prices implies higher production costs for farmers, thus reducing output supply.
Stationarity, cointegration, and validity tests
Testing for stationarity and cointegration in autoregressive processes is key to identifying the econometric model that best fits the times series; therefore, the Augmented Dickey-Fuller (ADF) (1979) and Johansen’s (1988) cointegration tests were performed. In addition, model validation was carried out to verify that the residuals met the assumptions of stability, normality, constant error variance, and unrelated error terms.
Granger causality test
The Granger (1969) causality test was applied to determine the relationship between the time series. It assumes that if Z helps predict W, the regression of W is based on its past values. Past values of Z are added, and therefore Z can be called the Granger cause of W; otherwise, it is called the non-Granger cause.
Results
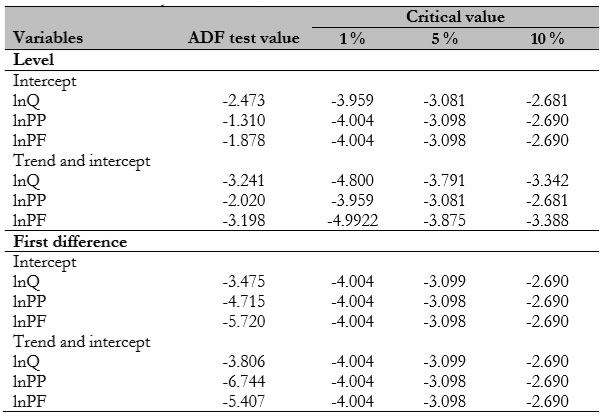
Unit root tests were conducted as a first step towards specifying the correct autoregressive model. The results of the ADF test are summarized in table 2 for level and first difference with intercept and trend and intercept. The calculated ADF statistics for all log-level series with intercept, trend, and intercept were lower in absolute value than their respective critical values at 1 %, 5%, and 10 % significance levels, which implies that they were not stationary; as such, the null hypothesis of a unit root cannot be rejected. However, at the first difference, all log series values were higher at 5% and 10% significance levels; therefore, they do not show unit root and are integrated in order I (1).
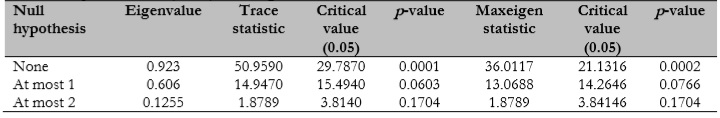
For the cointegration analysis, Johansen’s Maximum Likelihood method was employed, and the results show that, in both the trace and maximum Eigenvalue tests, the statistical values for the null hypothesis of no cointegrated equations were greater than their critical values, with a probability below the 5% significance level (table 3). The preceding confirms the existence of one cointegrated equation and hence a long-term relationship between potato supply and potato and fertilizer prices, and therefore VEC modeling could continue to be conducted.
VECM estimation
The error correction model presented in table 4 captures the long- and short-run relationships between variables in the integrated series. However, lag length criteria were established prior to the model’s estimation, as incorrect fitting can lead to autocorrelated errors and forecast miscalculations. Both the Akaike information criteria and the VEC lag order specification (p-1) suggested a lag length of one.
Table 4 Long and shortrun VECM estimates
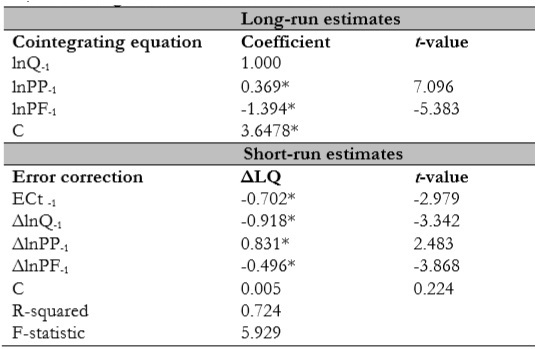
*Statistical significance level at 5%
Source: Elaborated by the authors
The results show that the signs and the magnitude of the estimated supply response coefficients were within a reasonable range and that the model fits the observed data, as indicated by the R2 (0.74) and F (5.92) statistics (table 3). As all variables were in logarithmic form, the estimated cointegration coefficients represent supply elasticities. Therefore both the short- (0.83) and long-run (0.36) own-price coefficients were positive, significant (p < 0.05), and inelastic, suggesting a positive relationship with potato supply and that a percentage increase in lagged potato price leads to a less than proportionate increase in supply.
As expected and in line with the theory, the estimated fertilizer price coefficients presented negative elasticity in the short (-0.49) and long-run (-1.39), which indicates that as the price of an input increases, the costs increase, making farmers reduce output.
Additionally, given that potato crops have high fertilizer requirements, more remarkable changes in supply response to price movements this is expected. Moreover, considering the structure of potato production, the negative sign on the lagged output suggests that potato crops could be replaced with substitute crops in the event of excess supply. In other words, an increase in potato output would result in a price decrease and induce farmers to shift to other crops. Accordingly, the error correction coefficient of the short-run equation, which determines the speed of adjustment towards long-run equilibrium, presented the correct negative sign (-0.70) and was statistically significant (p < 0.05), implying that the rate at which potato and fertilizer prices adjust to long-run equilibrium is 70% within one year.
Granger causality test
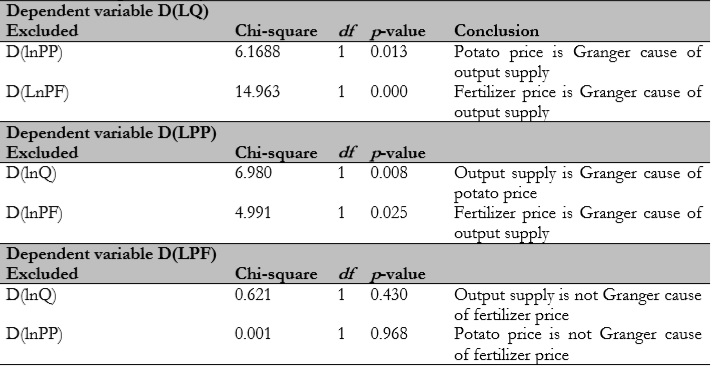
This study also examines causal relationships, which can provide helpful information about the model’s ability to make predictions. The results show a robust causal relationship, as the t-statistics of the independent variables and the error correction term are statistically significant (p < 0.05) (table 5). In addition, if the p-values of the log time series obtained from the Granger test were lower than the significance level of 5%, the null hypothesis could be rejected, thus confirming the existence of causality among the variables. Except that lnQ and lnPP are not Granger causes of lnPF, all other variables present Granger causality relationships: lnPP and lnQ are Granger causes of each other and lnPF is the Granger cause of both lnQ and lnPP. Reciprocity among the three variables was established (table 5).
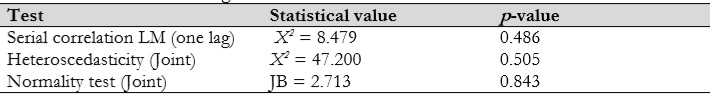
Diagnostic tests
To examine the consistency of the VEC model, residual diagnostic tests were performed. As shown in table 6, the assumptions of no serial correlation, homoscedasticity, and normality were not violated.
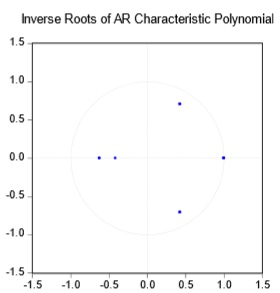
In addition, as calculated by the autoregressive (AR) root diagram method, the roots of two observations were equal to one, and all others were located within the circle; therefore, the VECM satisfies the stability criteria (figure 1).
Discussion
The potato farming sector contributes significantly to the economic growth of various low- and middle-income countries. It is an essential source of income for large and small farmers in these countries, and the price factor plays a vital role in investment and planting decisions; it is thus necessary to understand its magnitude and characteristics (Soontaranurak & Dawson, 2015). However, few studies refer to the estimation of potato supply response using a VEC framework. Nonetheless, some studies have found that production is strongly motivated by price (both own-price and fertilizer price), and to a lesser extent, by non-price factors such as acreage, yield, and climate (Dlamini, 2018; Huq & Arshad, 2010).
Consequently, the results of the short- and long-run coefficient estimates obtained in the present study are considered to be significant empirical evidence that supports the existence of a relationship between potato production and both own price and fertilizer price. These findings are consistent with those of Huq and Arshad (2010); by using the VECM approach, these authors also obtained evidence for a positive relationship between potato supply and lagged own price and similar short- (0.61) and long-run (0.44) elasticity values to those found in the present study, therefore implying that price is an essential factor in farmers’ production decisions (Dlamini, 2018). In contrast with these results, Mose et al (2007), in their study on the aggregate supply response of maize to price incentives, estimated a higher short-run fertilizer price coefficient (-1.05), which would imply a more significant response to price changes.
Moreover, the estimated speed of adjustment towards long-run equilibrium found in the present study was like Huq and Arshad’s (2010). Both studies present a negative and slow adjustment rate of 0.7 and 1.18, respectively, most probably because farmers may not have access to the financial resources and technology necessary to increase production in the immediate term, thus deterring their response to incentives (Dlamini, 2018; Mose et al., 2007; Tripathi & Prasad, 2009).
Conclusions
The results of this research allow us to conclude that potato output supply is highly responsive to price incentives, which can be noted by the correct signs and the statistical significance of the short- and long-run elasticities of potato and fertilizer prices. It can be said that these positive results support the importance of the role that potato production plays in farmers’ incomes. Likewise, the Granger causality test results show a solid reciprocal causal relationship among the variables. Moreover, the error correction term indicates that, eventually, the system will converge towards equilibrium at a 70% rate, which implies that it takes a relatively long period for farmers to respond to price movements.
Therefore, the above analysis reveals that overall, the use of the VECM can contribute to improve the understanding of the long- and short-term dynamics of potato output response and thus help evaluate the effectiveness of price policies and farmers’ output decisions. Nonetheless, the proposed model could be enhanced: other lines of further research should be pursued to obtain a more accurate simulation by, for example, including factors such as expenditure in infrastructure and research and development.

