


 Inglês (pdf)
 Artigo em XML
 Referências do artigo
 Enviar este artigo por email
 Citado por SciELO
  Citado por Google
  Similares em
SciELO
Similares em
SciELO  Similares em Google
 Permalink
Introduction
Quinoa, Chenopodium quinoa Willdenow (Amaranthaceae), has about 16,000 accessions distributed in five agroecological groups ordered according to their edaphoclimatic adaptability, allowing the recognition of quinoas from the inter-Andean valleys, salt flats, Yungas, highlands, and sea level throughout Central and South America (Bazile et al., 2016; Pinedo-Taco et al., 2020). Currently, the highest genetic diversity of quinoa is in Bolivia, Peru, Ecuador, Chile, and Argentina. However, there are mostly ex-situ collections outside these Andean countries, which in many cases belong to companies that managed to obtain varieties with Plant Variety Certificate (COV) in countries such as the Netherlands, the United Kingdom, Denmark, Canada, and Israel (Bazile et al., 2014).
Quinoa is a plant with eco-physiological harmony. Therefore, it is used to colonize places with extreme climate and soil conditions, thus tolerating salinity problems, water deficit, substantial temperature changes, and frost (Hinojosa et al., 2018). In recent years, the production of quinoa has taken great value due to the nutritional benefits of its grains mainly related to amino acid profile, macronutrients (proteins, carbohydrates, and lipids), and some micronutrients such as polyphenols, vitamins, and minerals; all of them favor its use in food preparation and offer health benefits (Navruz-Varli & Sanlier, 2016; Stikic et al., 2012). However, these nutrients could differ significantly between cultivars (García-Parra et al., 2019; Reguera et al., 2018), which is why genetic quinoa breeding programs have become relevant recently to reduce the effect of genetic variability on the physiological and compositional expression of the grain (Murphy & Matanguihan, 2015; Saad-Allah & Youssef, 2018).
The use and consumption of quinoa derivatives have increased because of campaigns highlighting this plant as one of the promissory food resources for its health benefits, food sovereignty, and easy production in the face of climate change (Ruiz et al., 2014). Even though Colombia is recognized as the core of quinoa origins, the diversity of this species in the producing provinces is scarce, which translates into difficulties choosing appropriate cultivars for different agroecological regions in the country, where the most widely used cultivar shows low yields (García-Parra et al., 2020a).
Although different fertilization methodologies have been tried to enhance the production of quinoa, yields obtained performed below the cultivars established in other countries (Torres et al., 2000; García-Parra et al., 2019). Thus, it is necessary to identify cultivars under controlled conditions that could express their best physiological and production potential and formulate strategies for producing various cultivars under typical agroclimatic conditions in each region. This research analyzed the physiological and productioneffective performance of six quinoa cultivars from Colombia under controlled conditions.
Materials and methods
Study area
The study was conducted under greenhouse conditions in Ventaquemada, Colombia, at the Agro-ecological Victoria Farm (latitude 05°22′47″N and longitude 73°30′10″W, 2,722 m a.s.l.). The average temperature during experimentation was 15.2 °C, with a relative humidity of 79.1%; the average daily light inside the greenhouse was 851 ± 448 μmol m-2 s-1.
Quinoa seeds were obtained from the seed bank of Gobernación de Boyacá, Agriculture, Organizations, and Fruits (AOF) Research Group, and different local markets (Titicaca, Salcedo, Soracá, Pasankalla, Puno, and Nariño cultivars). Seeds were sowed and grew in 10 kg soil pots of Andisol with the following physicochemical conditions: pH 6.1; electrical conductivity 6.3 dS/m; organic matter 8.8 %; cations (cmol kg-1) Al3+ 1, Ca 36.4, Mg 7.2, K 10.3, and Na 1.1; and micronutrients (mg/kg) Fe 93.8, Mn 11.8, Cu 9.4, Zn 9.4, and B 1.5. During the study, irrigation and preventive sanitary control were performed to preserve plant health.
Phenological phases
Phenological phases were evaluated in each cultivar under the methodology proposed by Sosa- Zuniga et al. (2017), who adopted the BBCH (Biologische Bundesanstalt Bundessortenamt und Chemische Industrie) scale for quinoa plants. The phenological observations were registered weekly. The beginning and end of the phenological phases were deduced based on the adaptation to the mentioned scale and considering the specifics for quinoa. The growing degree days (GDD) were calculated as (Eq. 1):
 (1)
(1)
Where GDD in the accumulated growing degree days, Tmax and Tmin are maximum and minimum air temperatures, respectively, and Tbase represents the physiological base temperature of quinoa equal to 3 °C (Präger et al., 2018).
Height dynamics and number of leaves
The height and number of leaves on each experimental unit were measured every two weeks. Afterward, the plant height and number of leaves were modeled through a non-linear regression model (Eq. 2). Best fitting model was selected according to the determination coefficient (R2 ) following Melgarejo’s (2010) methodology. A logistic growth curve analysis was conducted using three parameters, as follows:
 (2)
(2)
Where h refers to the value of the target variable at time t, t refers to the days after planting, b refers to the maximal growth rate, and c is the slope of the curve.
Maximum number of branches
The maximum number of branches on each experimental unit was recorded following Hussain et al.’s (2018) methodology, in which the lateral branches formed from the main stem were quantified based on the axial shoots on the pedicels of primary leaves.
Total chlorophyll content
Total chlorophyll content was measured for each preeminent phenological phase on all experimental units using a chlorophyll meter (SPAD 502 Plus Konica-Minolta, Japan). Measurements of the total chlorophyll of leaves from three-thirds of the plant were made, focusing the laser camera on the middle part of the plant.
Chlorophyll fluorescence
Plant chlorophyll fluorescence was measured in fully expanded leaves over three-thirds of the plant for each experimental unit using a fluorometer (PAM junior WALZ, Germany). The measurements were made during phenological phases between 11:00 pm and 1:00 am, following Fghire et al.’s (2015) methodology.
Stomatal density
The stomatal density was measured by collecting leaves from different parts of the plant in each experimental unit. Then, a suspension with the sampled leaves was made by applying industrial resin according to Shabala et al.’s (2013) methodology. Finally, the stomatal density was recorded by number per area with a 200X magnification microscope.
Colorimetric analysis of quinoa seeds
The CIE L*a*b* scale (Commission Internationale d’Eclairage – CIE) was used to record the L* (lightness), a* (redness, greenness), and b* (yellowness, blueness) color parameters using a Konica Minolta spectrophotometer (Model CM-5, Tokyo, Japan) under the CIE D65 illuminant and observation angle of 10°. The components of the CIELAB system (L*, a*, b*) were measured three times for each sample.
Compositional characteristics
Seeds were harvested manually at the time of physiological maturity. Kjeldahl’s method of with a conversion factor of 6.25 by AOAC 960.52 was used to quantify the total of crude protein in seeds (AOAC, 2016). Fat determination was analyzed following AOAC 922.06 with a Soxhlet (Soxtec 2050). Total carbohydrates were calculated by difference (i.e., 100 – the sum of protein, fat, ash, and moisture) (Alonso-Miravalles & O’Mahony, 2018).
Statistical analysis
The experiment had a randomized design with six treatments corresponding to cultivars, each with 30 replicates. Data were tested for normality (Shapiro-Wilk test) and variance homogeneity (Bartlett test). Analysis of variance (ANOVA) was performed, followed by Tukey’s test (p ≤ 0.05). Principal component analysis (PCA) depicts the relationship between the cultivars and the evaluated physiological and nutritional variables. PCA analysis was carried out using the Agricolae and Factoextra libraries in the statistical program R version 3.6.1 (R Core Team).
Results and discussion
Phenological phases
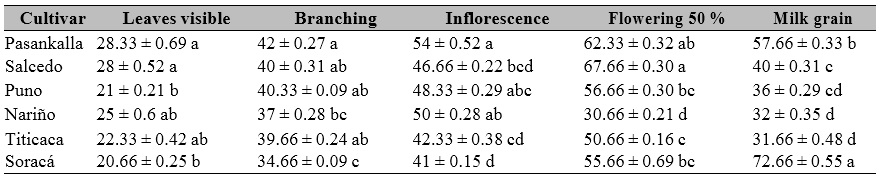
Cultivars in different stages from early to late phases were observed for germination, visible leaves, branching, inflorescence appearance, flowering 50 %, milky grain, pasty grain, and harvest as described in the BBCH scale. These cultivars were classified into three groups: (a) Puno, Nariño, and Titicaca as the earliest, (b) Soracá as the latest, and (c) Salcedo and Pasankalla as intermediate between a and b categories (Table 1).
Table 1. Phenological performance of different quinoa cultivars under controlled conditions in Colombia
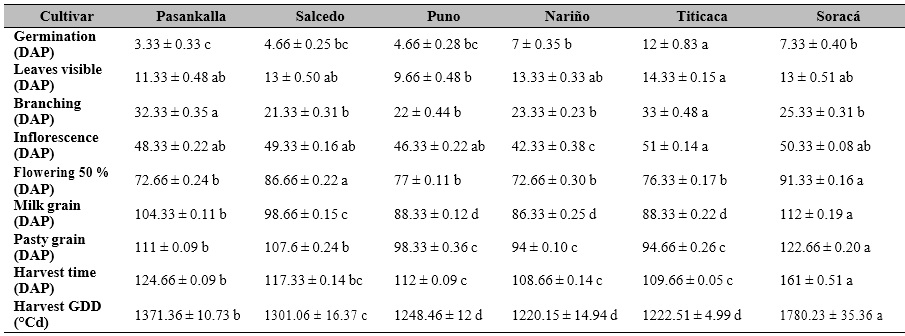
Note.DAP: Days after planting. ± Standard error. Distinct letters in the same row indicate significant differences according to Tukey’s test (p ≤ 0.05). GDD: Growing Degree Days.
Source: Elaborated by the authors
The growth and development of plants in response to genetic and environmental variation allow determining, in many cases, the state of vigor and phytosanitary quality (Carranza et al., 2009). Thus, quinoa genetic diversity has contributed to this species’ adaptability under different agroecological conditions. Consequently, its line of origin favors early maturing or increases the time of its production cycle (Bazile et al., 2016a).
The phenological performance and the BBCH scale for quinoa allowed standardizing the states and sub-states that quinoa passes from the moment of sowing to harvesting. Reguera et al. (2018) found that cultivars such as Titicaca and Salcedo had 105 days and 145 days to harvest, respectively, which agrees with the results obtained for Titicaca, which increased harvesting time by 4.24 % compared to the cultivars evaluated in Chile and was reduced by 65.18 % for Salcedo.
Several studies have reported the Soracá cultivar with a longer-cycle genotype that varies between 171 and 202 days (Garcia et al., 2018; García-Parra et al., 2020), which is higher than the one evaluated in this research. In Pasankalla’s case, it has a longer phenological cycle (175 days) under open field conditions in Pavia, Italy (Melo, 2016), which differs significantly from the cycle shown in this research under controlled conditions. The latter trend is likely due to increased water availability during the trial (1370 mm in Pavia), which could favor cell turgor and constant physiological activity, lengthening the vegetative and reproductive phases (Taiz & Zeiger, 2006).
Nariño cultivar showed attributes that favor its production, at least under controlled conditions. During the vegetative phases, when there is a higher water demand, this cultivar has an early inflorescence phase, a rapid reproductive phase start, and grain maturation. This behavior has been reported in studies where this cultivar is affected by edaphic salinity, accelerating the pace in its phenological stages (Delgado et al., 2009). Also, it is noteworthy that the environmental temperature influences the accumulation of GDD, hence is a determinant of the growth rate of the species. In the case of quinoa, it has been reported that about 2,000 GDD are necessary to reach the harvest phase (Präger et al., 2018), which is consistent with the results obtained in the present study.
Height of plants and number of leaves
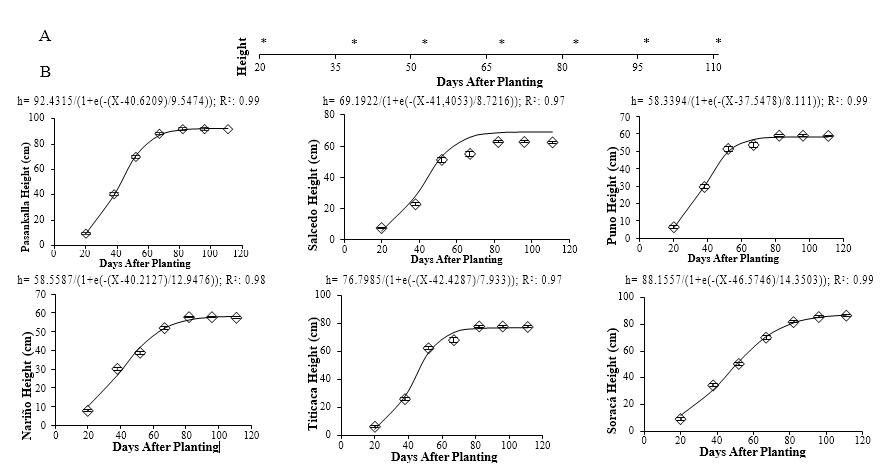
Plants crops show their highest growth expression during the vegetative phases (Liu et al., 2018). During the reproductive and maturation seed phases, most photosynthates move to sink organs; that is why the growth dynamics of the evaluated quinoa cultivars showed a sigmoidal shape. Significant differences were identified in the growth development between cultivars (Figure 1).
This growth dynamic is characteristic of plant growth (Jayme-Oliveira et al., 2017). However, these results highlight an accelerated expansion of the different cultivars during the vegetative phases and then slows down during the inflorescence and flowering stages. This aspect was more pronounced in Pasankalla, Salcedo, Puno, and Titicaca, while in the remaining cultivars, moderate growth was maintained during the elongation of the panicle. According to García- Parra et al. (2020b), this small growth dynamic at the beginning of the reproductive phase is identified in most Colombian cultivars, except in the Soracá cultivar, which kept gaining size even after the vegetative stages. This growth dynamic has not been previously reported, except for the maximum height reached by the Salcedo and Titicaca cultivar in Chile during their development (Reguera et al. 2018). Such cultivars had a maximum height of 115.66 and 126.33 cm, including the panicle, which is much higher than the maximum height observed in this study:62.4 and 76.8 cm, respectively.
Source: Elaborated by the authors
Figure 1. Regression models of the height vs. time of six quinoa cultivars under controlled conditions. A: * indicates significant differences between days after planting of the cultivars according to Tukey’s test (p ≤ 0.05). B: Vertical bars correspond to standard error. –: Modeling. ◊: Observed.
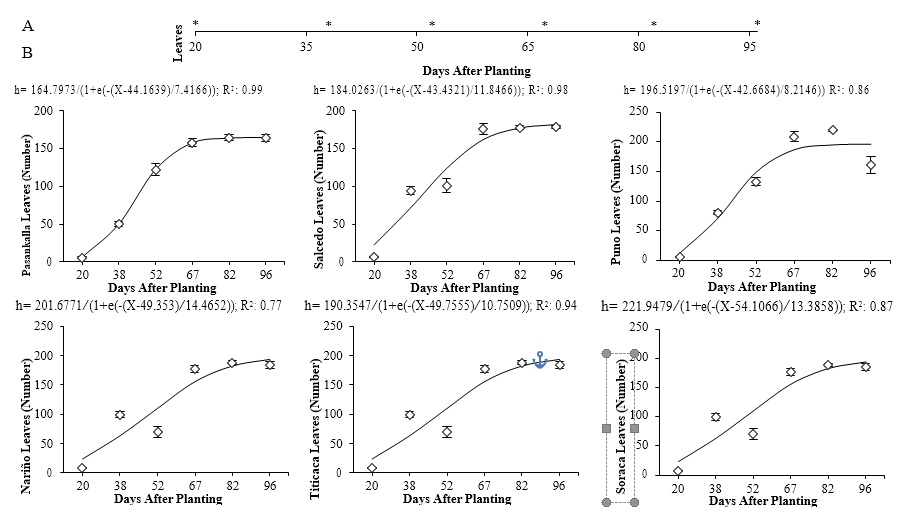
Source: Elaborated by the authors
Figure 2. Regression models of the number of leaves vs. time in six quinoa cultivars planted under controlled conditions. A: * indicate significant differences between days after planting of the cultivars according to Tukey’s test (p ≤ 0.05). B: Vertical bars correspond to standard error. –: Modeling. ◊: Observed.
Different behaviors were found in the production of leaves among the cultivars evaluated, varying the output of leaves significantly between cultivars: 164 leaves for Pasankalla and 219 for Puno (Figure 2). Overall, plant leaf development follows a sigmoidal shape, except if interrupted by biotic or abiotic factors that might affect the production of foliage, altering the capture of light and their photosynthesis process (Taiz & Zeiger, 2006).
Results show that the total accumulation of leaves fluctuates between cultivars, yet this is not a variable commonly evaluated in this kind of study (García-Parra et al., 2019). The dynamics of leaf production in quinoa are underseen. However, leaf performance in plants has shown sigmoidal and double sigmoidal behavior over time since their number increase exponentially during the vegetative phases, is slightly maintained over the reproductive stages, and reduces the maturation of the grain due to the effect of plant senescence (Jayme-Oliveira et al., 2017).
Number of branches
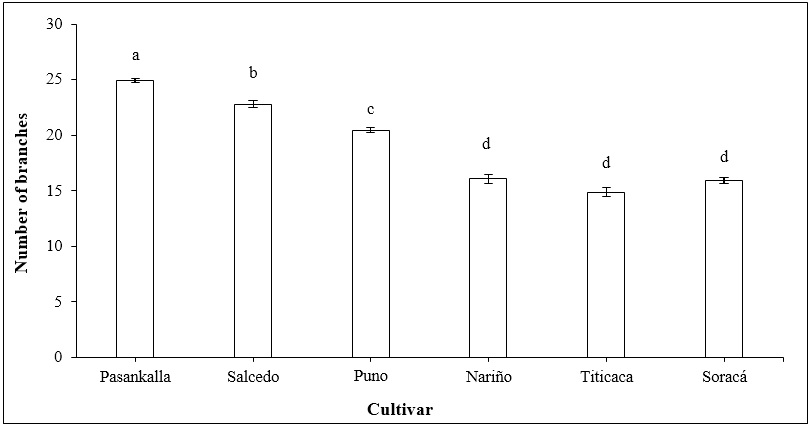
The results showed significant differences in the production of branches between several of the evaluated cultivars. The output of branches was higher in the Pasankalla cultivar, followed by the Salcedo and Puno cultivars. Cultivars such as Nariño, Titicaca, and Soracá showed a lower branch production and not significant statistical differences (Figure 3).
Source: Elaborated by the authors.
Figure 3. The number of branches in quinoa cultivars at harvest time. Vertical bars represent standard error. Different letters indicate significant differences according to Tukey’s test (p ≤ 0.05).
One of the significant responses expressed by quinoa to agroclimatic effects is the modification of morphological structures (Ahmadi et al., 2019). This feature, recognized as morphological plasticity, is common in species with an extensive altitude range for adaptation. For this reason, quinoa cultivars have been classified into four large groups according to the level of branching (number and architecture of the branches): 1: simple; 2: branched to the lower third; 3: branched up to the second third; and 4: branched without defined inflorescence (Bazile et al. 2014). However, since there are about 16 thousand accessions of quinoa, it becomes difficult to identify each individually.
Chlorophyll content
The concentration of chlorophyll in plants is a proxy for the nutritional status of plants (Li et al., 2018). The total chlorophyll content of the different quinoa cultivars evaluated in this study increased about 50% during the flowering period. Soracá cultivar kept evidencing an increment in the chlorophyll content for the rest of the phenological phases because of foliage regrowth lasting over the blooming and maturing grain stages. All cultivars showed significant differences in the chlorophyll content in all the phenological phases evaluated (Table 2).
Table 2. Chlorophyll content (SPAD units) of different quinoa cultivars grown under controlled conditions in Colombia.
Note.± Standard error. Distinct letters in the same row indicate significant differences according to Tukey’s test (p ≤ 0.05).
Source: Elaborated by the authors
The total chlorophyll content in quinoa has been widely recorded, as mentioned by Riccardi et al. (2014), who had determined different methodologies to estimate its content. They found that the Titicaca cultivar exhibited its maximum chlorophyll content with 40 SPAD units, which is lower than the values obtained in this analysis (55.66 SPAD units). Melo (2016) reported chlorophyll contents between 10 and 30 SPAD units for the Soracá cultivar under fertilization with N 100 Kg. ha-1, P 60 Kg. ha-1, and K 40 Kg. ha-1. Puno and Titicaca cultivars have been reported with the highest chlorophyll content, while the Nariño cultivar is one of the cultivars with lower content (Hinojosa et al., 2018). These values are like those obtained in this research, except for the visible leaves and inflorescence phases where the chlorophyll content was higher. In the case of Salcedo, the chlorophyll content reported by Antezana-Febres et al. (2017) varied between 45.54 and 56.45 SPAD units, which does not differ significantly from the values obtained here.
Chlorophyll fluorescence (Fv / Fm)
Photosynthesis is an essential process in plants; therefore, stress levels can be determined by the photochemical activity and light transportation through the photosynthetic structure. The maximum quantum efficiency of the photosystem II (FSII) is a proxy of the chlorophyll fluorescence. We found significant statistical differences in the chlorophyll fluorescence between quinoa cultivars in all the phenological phases, except pasty grain (Table 3).
Table 3. Chlorophyll fluorescence (Fv / Fm) activity in quinoa cultivars grown under controlled conditions in Colombia.
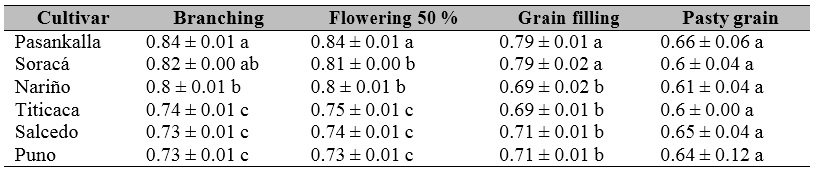
Note.± Standard error. Distinct letters in the same row indicate significant differences according to Tukey’s test (p ≤ 0.05).
Source: Elaborated by the authors
The maximum quantum efficiency of the FSII showed a higher performance during the branching phase. The Pasankalla and Soracá cultivars showed the most increased Fv / Fm activity and maintained this trend during the grain filling and flowering stages (Table 3). The cultivar Puno showed a low Fv / Fm activity compared to other cultivars. Within our findings, we could detect the significant variability in the chlorophyll fluorescence of quinoa, an aspect given little attention concerning the great diversity of this species. Hinojosa et al. (2018) reported that its efficiency response is widely unknown.
This feature also develops in the grain filling phase in Pasankalla cultivar during flowering . In this sense, according to Fghire et al. (2015), there were no significant differences in the Puno cultivar with plants subjected to water stress in the Fv / Fm, while in our findings, this cultivar showed a low Fv / Fm activity.
Titicaca cultivar showed an efficiency of the Fv / Fm between 0.6 and 0.75, differing from what was obtained by Eustis et al. (2020), who found that the Fv / Fm was established at 0.7 when measured at night, while it increased when measured at dawn to 0.73.
Stomatal density
The exchange of gases takes place through the stomata, allowing the photosynthetic activity of the plants (Ramos-Montaño, 2020). Some of the evaluated cultivars had a significant statistical difference, with the Pasankalla and Soracá cultivars exhibiting the highest number of stomata per unit of area and the Salcedo and Nariño cultivars the lowest (Figure 4).
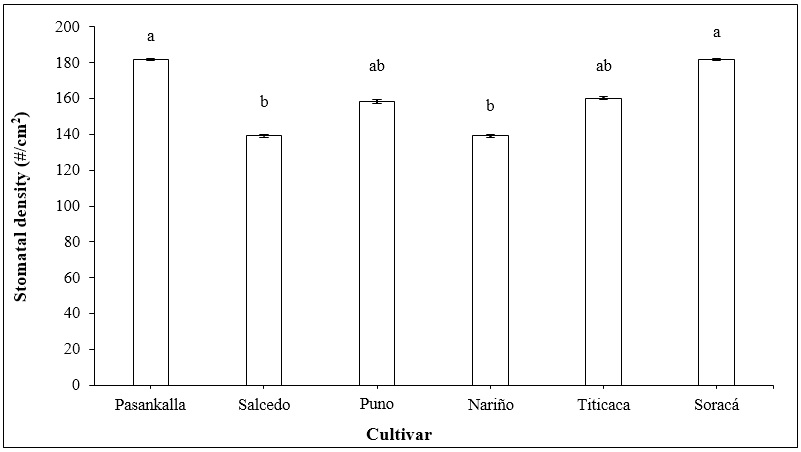
Source: Elaborated by the authors
Figure 4. The stomatal density of different quinoa cultivars under controlled conditions during the flowering phase. Vertical bars represent standard error. Distinct letters indicate significant differences according to Tukey’s test (p < 0.05).
The stomatal density of different quinoa cultivars was primarily evaluated under various abiotic stresses (Rasouli et al., 2021). Issa-Ali et al. (2019) reported for the Titicaca cultivar a density of up to 155 stomata per cm2, similar to the density in this study. Overall, stomatal density varies between 130 and 270 stomata per cm2 among cultivars, with the Bolivian and Peruvian cultivars having the highest density of stomata (Shabala et al., 2013). This aspect needs to be evaluated under natural production conditions and in different cultivars.
Harvest
The harvest production, the given agro-environmental conditions, and the plant genetic characteristics reached the species’ production potential. Several quinoa cultivars showed significant statistical differences that divide the cultivars into three main groups from higher to lower production: 1) Titicaca, Puno, and Soracá; 2) Salcedo and Pasankalla, and 3) Nariño (Figure 5).
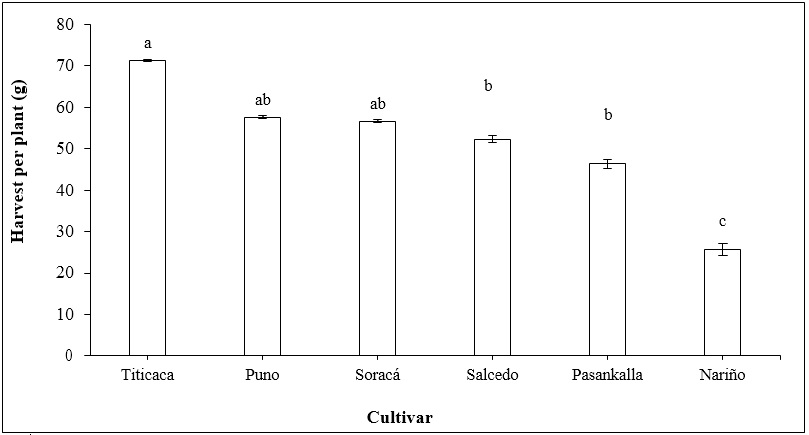
Source: Elaborated by the authors
Figure 5. Mass of the grain seeds harvested in different quinoa cultivars. Vertical bars represent standard error. Distinct letters indicate significant differences according to Tukey’s test (p < 0.05).
The grain production of quinoa fluctuated substantially between cultivars. Cultivars with the highest production, as in the case of Titicaca, had been subjected to genetic improvement programs where production is the principal selection attribute (Präger et al., 2018). Regional cultivars such as Soracá showed an intermediate product associated with this cultivar’s high heterogeneity since its grain yield is highly influenced by fertilization and climate conditions (Guerrero et al., 2017). Nariño cultivar had low production despite being part of genetic improvement programs (Delgado et al., 2009), possibly associated with the conditions of seed handling and storing by farmers, affecting the germination index and the physiological performance and productivity (Romero et al., 2018).
Grain characteristics of different quinoa cultivars
The grains of the evaluated quinoa cultivars showed statistical differences between the CIELab coordinates (L*, a*, b*), which may be attributed to the external coloration of the pericarp. In the quinoa case, the pericarp coloration differentiated all the grains of the cultivars, except Titicaca and Puno in L* and Salcedo and Puno in a*, which together with the compositional content of the seeds showed significant differences between the evaluated cultivars. These aspects can be seen in protein, carbohydrate, and grain fat percentages. The Titicaca and Pasankalla cultivars showed the highest protein value; Puno and Nariño had the highest carbohydrate content, while fat was the highest in Puno (Table 4).
Table 4. Grain characteristics of quinoa cultivars grown under controlled conditions in Colombia
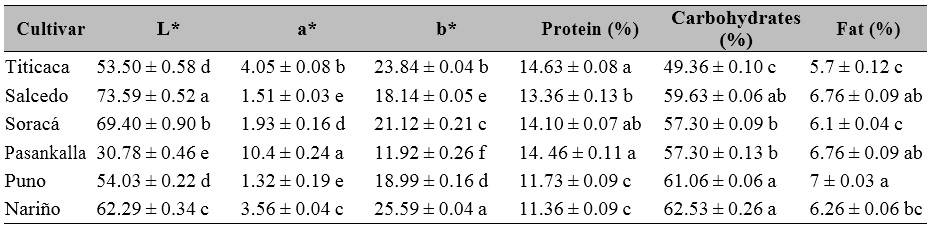
Note.± Standard error. Distinct letters in the same row indicate significant differences according to Tukey’s test (p ≤ 0.05).
Source: Elaborated by the authors
The visual characteristics were the main aspects differentiating quinoa seed variety and even composition (Escribano et al., 2017). Currently, seed color evaluation allows identifying compounds that have strengthened the production of quinoa cultivars with black, pink, red, and purple seeds. Also, there has been a growing relationship between color and compounds such as tannins, saponins, and phytic acid (Abderrahim et al., 2015; Medina et al., 2010).
The preceding is relevant since the protein, lipid, and starch content of grains are fundamental for agro-industrial processes and the formulation of functional foods with hyper-protein, starch qualities, and high nutritional quality (Li & Zhu, 2018; Roa-Acosta et al., 2020).
Principal Component Analysis (PCA) on physiological and yield variables
The six studied cultivars represented a wide range of agronomy variability reflected in phenology, physiology, and composition grain. The cumulative variance explained by the two principal components (PCs) was 71.6 %. The quinoa cultivars were significantly discriminated by the grain physiological and compositional variables (Figure 6). Four groups of cultivars were identified: 1) Titicaca and Nariño, associated with early-growing plants at harvest time; 2) Soracá, characterized by the longest time to harvest through the methodologies of days after planting and GDD; 3) Puno and Salcedo, characterized by the presence of carbohydrates and fats; and 4) Pasankalla, with a higher maximum quantum efficiency of FSII during the branching and flowering phases and the highest height index (Figure 6A)
The clustering analysis evaluates the relationship with the included variables over the quinoa cultivars observed (Figure 6B). A similar phenological performance was identified between the Puno and Salcedo cultivars (lateral grouping 4) and some less relevant similarities between the Soracá and Pasankalla cultivars (lateral grouping 1). It is noteworthy that the similarities are mainly associated with three groups of variables. The first (high grouping 1) corresponds to the number of branches containing carbohydrates and fats. The second (high grouping 2) was linked with the phenological measurement methodologies in the harvest phase, and the third group (high grouping 3) was associated with plant height and stomatal density.
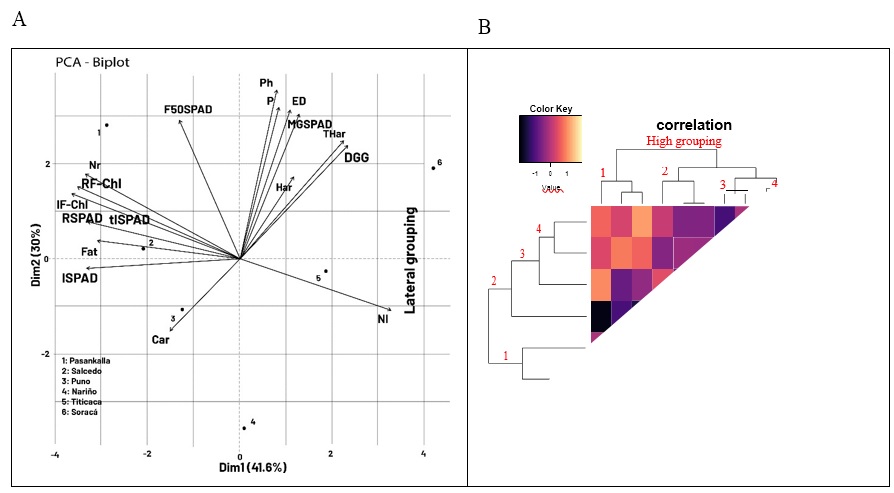
Source: Elaborated by the authors
Figure 6. A) Principal components analysis (PCA) and B) bootstrap-based clustering analysis with Manhattan distance from different quinoa cultivars and physiological relationship and compositional aspects.
The link between the number of branches with carbohydrates and fats present in quinoa seeds may be due to the activity of the branches in the transport of substances and their quantity (Ekman et al., 2008). In this sense, the relationship between the two methodologies to measure the time to harvest in days and GDD is high is primarily because both use differential parameters to establish the production cycle of quinoa even though other studies have recommended GDD as a precise methodology to make comparisons with the production of plant species under other edaphoclimatic conditions (Emendack et al., 2021). Finally, the interrelation between plant height and stomatal density may be due to some quinoa cultivars’ strategies to adapt to variable edaphoclimatic conditions (Sakoda et al., 2020).
Thus, Pinedo et al. (2020) report that one of the most determining factors in the low sustainability indices in quinoa production systems is the incorporation of new plant materials and the loss of native genetic resources. The physiological and production analysis of quinoa cultivars adapted to the edaphoclimatic conditions of a place (ecotypes) has a more significant advantage when applying effective practices such as planting methodology, fertilization, irrigation, and soil mechanization that result in resilient management of natural resources, as well as an advantage for quinoa producers.
Conclusions
Finding new crop alternatives with high agro-environmental adaptability and high nutritional value is a global need. Quinoa grains have excellent protein, carbohydrate, and fat content, which implies its success in food production, mainly in countries such as Colombia, where an average percentage of the population has nutritional deficiencies. Identifying multiple quinoa cultivars under control trials offers a realistic view of its physiological performance. It also helps determine its potential in production in different regions in Colombia as some departments with high yielding had the lowest diversity, consequently affecting efficiency by hectare. Thus, Nariño and Titicaca cultivars were recognized as immature, with a shorter cycle at harvesting related to days after planting and GDD. Soracá cultivar, on the other hand, reached the highest biomass performance.
The Pasankalla cultivar had the highest chlorophyll content values during all the phenological phases, except for the milky grain phase, where the Soracá trial performed better. Both yields evidenced high stomatal density. Titicaca cultivar had the most increased grain production, while Puno and Soracá took an intermediate place in output; Soracá has the wealthiest protein content.
Consequently, studying quinoa cultivars under controlled conditions contributes to analyzing the most likely capacity to obtain biomass. Furthermore, adequate irrigation, fertilization, and sowing practices under warm weather conditions could result in better crop yields favoring grain quality; therefore, this is a potential alternative for production systems regarding desirable attributes of protein and carbohydrates.

