


 Inglês (pdf)
 Artigo em XML
 Referências do artigo
 Enviar este artigo por email
 Citado por SciELO
  Citado por Google
  Similares em
SciELO
Similares em
SciELO  Similares em Google
 Permalink
Introduction
Rice, Oryza sativa L. (Poaceae), is a staple food for human beings. According to official sources, global production of 514.9 million tons was achieved in 2019, and approximately 411.7 million tons were used, with a worldwide per capita consumption of 53.9 kg (FAOSTAT, 2019). In Ecuador, rice is grown in different environments, and its production is concentrated in three provinces: Guayas, Los Ríos, and Manabí (Moreno & Salvador, 2015). In recent years, this crop has been affected by drought and salinity stress (Lamz & González, 2013), which are environmental elements that affect productivity and limit its growth in new cultivation areas.
Salinization is a global concern and affects nearly one-third of the agricultural area across Ecuador. Salinity problems increase in regions where water is limited and of inferior quality, mainly because of its salt content, generally exceeding the tolerance level and diminishing the production of salinity-susceptible crops (Ramírez & Hernández, 2016). Most often found salts such as sodium and magnesium affect plant development and various physiological processes, such as photosynthesis, stomatal conductance, osmotic adjustment, ion absorption, protein synthesis, nucleic acid synthesis, and imbalanced enzyme activity (Chávez et al., 2012).
The Guayas River Basin has abundant water with a flow of 8,847 m3/year and represents 40.4% of the irrigated area of Ecuador (Murcillo et al., 2020). However, this area has problems with salinity levels due to poor drainage and salt intrusion through the estuaries and irrigation channels (Pozo et al., 2010).
Salinity tolerance is a plant’s ability to cope with the osmotic and ionic effects of saline conditions with no significant changes in plan growth or grain yield (Bojórquez et al., 2012). These tolerance mechanisms are controlled by genes or by combining several to reduce any damage caused by increased salinity in the substrate (Zhang & Shi, 2013).
Genetic breeding is a tool that allows the development of salt-tolerant rice varieties under highly saline conditions. As the most reliable approach to plant breeding, it highlights the wide or interspecific crosses made with wild relatives tolerant to salinity (Arzate et al., 2008). These species are phenotypically inferior to cultivated rice. However, there is evidence of transgressive segregation for yield in crossbreeding between cultivated and wild species, which contain genes that can improve quantitative yield-related characteristics (Sánchez, 2013).
The Faculty of Agricultural Sciences of the Technical University of Babahoyo runs a Rice Breeding Program. Several advanced lines have been generated from interspecific crosses between Oryza rufipogon (Puyón) and Oryza sativa ssp. japonica and among japonica types with good agronomic and productive characteristics. These lines must be evaluated for tolerance to adverse environmental conditions.
The study aimed to evaluate the advanced lines developed through interspecific crosses between Oryza sativa L. ssp. japonica and Oryza rufipogon G. and the japonica type line for tolerance to salts under greenhouse and field conditions.
Materials and methods
Experimental locations
This research was conducted under two different conditions: greenhouse and field. The greenhouse was in the Faculty of Agricultural Sciences at the Technical University of Babahoyo, in Babahoyo canton, Los Ríos province(S 01°49′ W 79°32′ W), at 8 m a.s.l., 26.3 °Ca, with a relative humidity of 78.8 %, precipitation of 2,688.8 mm, evaporation of 1,012.4 mm, heliophany of 830.4 hours, and wind speed of 0.5 m/s (Instituto Nacional de Meteorología e Hidrología [INAMHI], 2019).
For field conditions, the salinity stress tolerance across rice genotypes was assessed in San Jacinto de Yaguachi, Guayas province, with a humid tropical climate, a temperature of 24-26 °C, relative humidity of 88 %, annual average rainfall of 1,262 mm, with a height of 8 m a.s.l. and heliophany of 990 hours (INAMHI, 2019).
Genetic materials
A total of 30 genotypes were used in this study: 12 advanced F. rice lines derived from interspecific crosses between Oryza rufipogon and Oryza sativa ssp. japonica, 12 advanced F5 lines obtained from crosses among the japonica line, five parental lines, and the commercial variety SFL-011 used as a control. These genotypes were selected for having higher yields in areas affected by salinity (Table 1).
The advanced F5 rice line seedbed was germinated in inert substrate trays, placing one seed per hole. After 20 days under greenhouse conditions, rice seedlings were transplanted into 60 × 80 × 20 cm wooden boxes covered with a black polyethylene plastic sheet using homogenized and washed pumice stone as an inert substrate. The experimental box was divided into two parts; on the left side, the plants were managed under normal irrigation water conditions (control 0.2 dS/m), and on the right side, the plants were grown in saline conditions (7.0 dS/m). Irrigations were applied twice a week during the first two months of cultivation and then one irrigation per week until harvesting. Water was salinized with sodium chloride (NaCl) to reach 7.0 dS/m salinity levels. These values were measured and monitored weekly with the Bluelab combination meter (Bluelab Corporation Limited, Tauranga 3110, New Zealand).
Selection and characterization of advanced F6 rice lines subjected to salinity-affected field areas
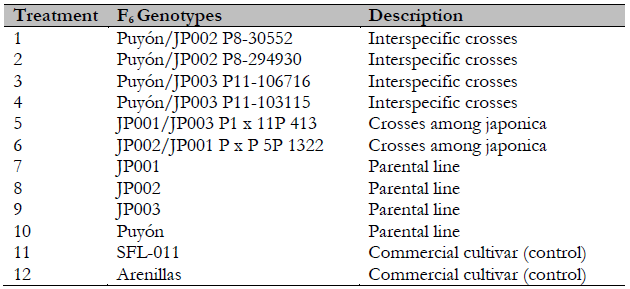
Advanced F6 rice lines selected for their tolerance to salts under greenhouse conditions were evaluated in infield conditions. These included four lines with yields higher than the average derived from the crosses of O. rufipogon × O. Sativa ssp. japonica (Puyón/JP003 P11-106716, Puyón/JP002 P8-30552, Puyón/JP003 P11-103115, and Puyón/JP002 P8-294930), two japonica lines (JP002/JP001 P * P 5P 1322 and JP001/JP003 P1 × 11P 413), four parental lines (JP001, JP002, JP003, and Puyón), and two cultivars (SFL-011 and Arenillas) (Table 2). These genotypes were selected for their higher yields and for being used by growers in areas affected by salinity.
Table 1 F5 rice genotypes exposed to saline stress under greenhouse conditions
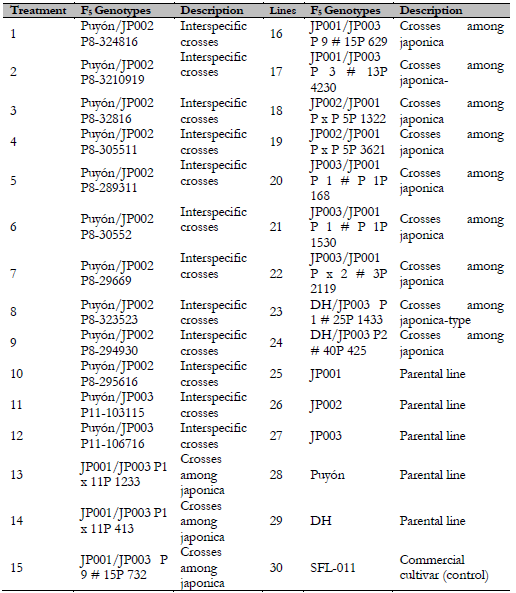
Source: Elaborated by the authors
For seedbed preparation, seeds were left in water for 24 hours, placed in plastic containers, and left for 24 hours. In assessing salinity tolerance across rice genotypes under field conditions, rice seeds were sown and grown by broadcasting, keeping their identification in non-saline conditions for 21 days. Then for planting the experimental field, a plow and harrow pass was made, the land was flooded and dried for five days, and the soil was subsequently muddied.
When the seedlings reached 21 days, two plants were transplanted per site at a distance of 25 × 25 cm to secure the required plants. The irrigation was provided by flooding and given according to the crop needs. In the vegetative phase and early flowering, it was maintained with a water surface layer of 3 to 5 cm, equivalent to 300-500 m3/ha. The fertilizer was applied according to the soil analysis using 230 kg/hectare of urea (105.8 kg of N), 136 kg/hectare of triple superphosphate (62.56 kg of P2O5), 160 kg/hectare of ammonium sulfate (33.6 kg of N and 38.4 kg of S), and 58 kg/hectare of potassium sulfate (29.0 kg of K2O and 10.44 kg de S).
During crop development, chemicals were applied to control pest insects such as leaf miners (Hydrellia sp.), moths Rupela albina Becker & Solis (Lepidoptera: Crambidae), sugarcane borer Diatraea sacharallis (Fabricius) (Lepidoptera: Crambidae), and rice delphacid Tagosodes orizicolus (Muir) (Hemiptera: Delphacid). Diseases such as black stem rot (Gaeumannomyces graminis), pod blight (Rhizoctonia solani), and pod rot (Sarocladium oryzae) were also controlled.
Variables assessed
The evaluated variables under greenhouse and field conditions were vigor (scale) and plant vigor determined at 50 days. They were classified according to the CIAT standard evaluation system scale for rice (Jennings et al., 1981). The scale application consisted of 1 = very vigorous plants, 3 = vigorous plants, 5 = intermediate or regular plants, 7 = plants less vigorous than average, and 9 = fragile and small plants, panicle sterility (%), plant height (cm), number of tillers per plant, panicle length (cm), root length (cm), length and width of the flag leaf (cm), length and width of the second leaf (cm), fresh and dry biomass of the root (g), fresh and dry biomass of the aerial part (g), grains per panicle, panicles per plant, shelling (%), grain weight per panicle (g), thousand-grain weight (g), number of leaves at 30, 45, 60 y 75 d, measured with an atLEAF CHL Plus chlorophyll meter, vegetative cycle (days), length and width of the unshelled grain (mm), length and width of the shelled grain (mm), and yield (g/plant).
Experimental design and statistical analysis
In the first phase of the greenhouse, the advanced F. rice lines were established using a completely randomized design with a 30 × 2 factorial experiment (A × B) and six replications. Factor A corresponded to the 30 rice genotypes and Factor B to soil treatments: control at 0.2 dS/m (tap water) and saline condition at 77.0 dS/m. The experimental unit consisted of a box with six plants.
A Completely Random Block Design with 12 genotypes and three repetitions was used to select and characterize advanced F6 rice lines under saline field conditions.
For both environments, the analysis of variance and Tukey’s test at a 95% probability were performed to determine any significant difference between the treatments. Principal component analysis, cluster analysis, and relative variability (%) were also conducted.
Results
Selection and characterization of advanced F5 rice lines under greenhouse conditions
The vigor at the salinity level of 0.2 dS/m (control) of the cultivar SFL-011 and the F5 genotypes JP001/JP003 P1 × 11P 1233, JP001/JP003 P 9 # 15P 629, JP002/JP001 P × P 5P 3621, JP003/JP001 P1# P 1P 1530, JP003/JP001 P × 2 # 3P 2119, and DH/JP003 P 1 # 25P 1433 scored 1 on average, awarded to very vigorous plants and were statistically superior (p < 0.0001) to the other treatments.
Under a salinity level of 7.0 dS/m, the genotypes JP001/JP003 P1 × 11P 413 and JP001/JP003 P 9 # 15P 629 were more vigorous and statistically superior (p < 0.0001) to the rest of the rice lines (Figure 1).
For panicle sterility, at a salinity level of 0.2 dS/m (control), the genotype JP002/JP001 P × P 5P 1322 had the lowest sterility, equal to 14.0% (p < 0.0001). For a salinity level of 7.0 dS/m, the genotype Puyón/JP003 P11-103115 had the lowest sterility percentage with a mean of 27.0 %, which was statistically different (p < 0.0001) from the other rice lines.
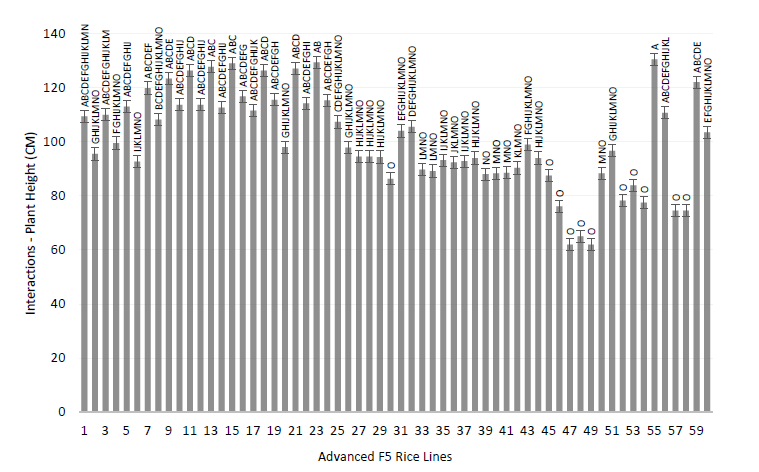
For plant height under the salinity level of 0.2 dS/m (control), the Puyón parental line (No. 28), the genotypes Puyón/JP003 P11-106716, Puyón/JP002 P8-323523, and Puyón/JP002 P8-29669 showed higher plant height with mean values of 130.5, 129.3, 129.0, and 127.7 cm; respectively, and these values are statistically superior (p < 0.0001) to the rest of the genotypes. At the salinity level of 7.0 dS/m, the genotype Puyón/JP002 P8-323523 exhibited the highest plant height with an average of 116.8 cm and was statistically superior (p < 0.0001) to the rest of the rice lines.
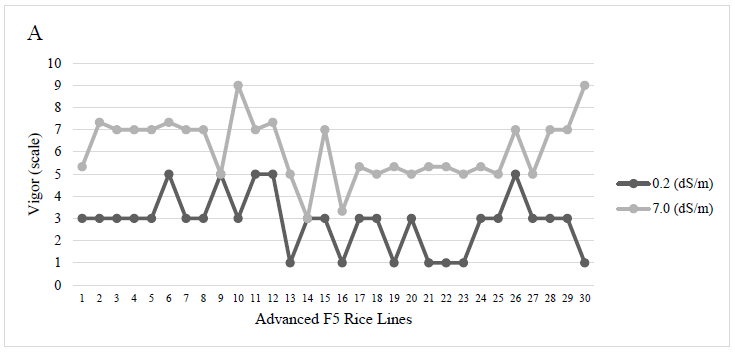
Source: Elaborated by the authors
Figure 1 Variation in the vigor of F5 rice plants subjected to 02 dSm control and 7.0 dSm salinity level
For the number of tillers per plant, at the salinity level of 0.2 dS/m (control), the genotypes Puyón/JP002 P8-305511, Puyón/JP002 P8-30552, and Puyón/JP003 P11-103115 had the highest number of tillers with mean values of 21.5, 19.8, and 19.7, respectively, and these values are statistically superior (p < 0.0001) to the rest of rice lines. At the salinity level of 7.0 dS/m, the genotypes Puyón/JP003 P11-103115 and Puyón/JP002 P8-289311 had a high number of tillers, with mean values of 21.3 and 20.2, respectively, and were statistically superior (p < 0.0001) to the other rice genotypes. A higher number of tillers represents a higher rice production (Figure 2).
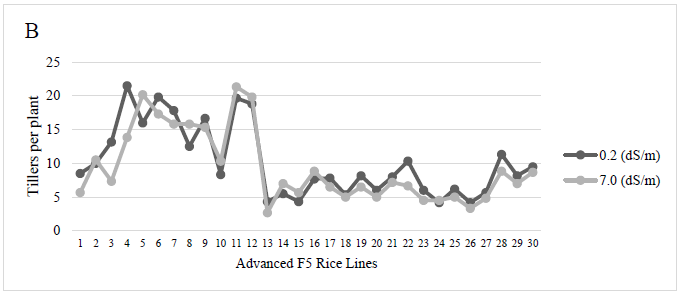
Source: Elaborated by the authors
Figure 2 The number of tillers per plant of F5 rice plants subjected to salinity level control (0.2 dS/m) and 7.0 dS/m.
On the other hand, the analysis of the interaction of agronomic behavior and salinity condition showed that for control (0.2 dS/m), the plant vigor equal to 2.9 was statistically superior (p < 0.0001) to the value observed in the saline treatment of 7.0 dS/m. At 0.2 dS/m (control) treatment, commercial variety SFL-011 and genotypes JP001/JP003 P1 × 11P 1233, JP001/JP003 P 9 # 15P 629, JP002/JP001 P × P 5P 3621, JP003/JP001 P 1 # P 1P 1530, JP003/JP001 P × 2 # 3P 2119, and DH/JP003 P 1 # 25P 1433 had values of plant vigor that did not differ statistically from each other. They were superior (p < 0.0001) to the rest of the lines and the commercial variety.
Regarding interactions, the genotype JP002/JP001 P × P 5P 1322 line at the control level (0.2 dS/m) had a mean of 14.0% sterility, which was statistically superior (p < 0.0001) to the rest of the observed interactions (Figure 3).
Source: Elaborated by the authors.
Figure 3 Interaction for the number of tillers per plant C of F5 rice plants subject to salinity level control 02 dSm and 70 dSm
For plant height, the control (0.2 dS/m) had a mean of 104.2 cm, and this value was statistically (p < 0.0001) higher than the saline treatment (7.0 dS/m). In terms of interaction, the Puyón parental line at the control level (0.2 dS/m) had a mean of 130.5 cm and was statistically higher (p < 0.0001) than all the other interactions.
For the number of tillers per plant, the salinity level of 0.2 dS/m had a mean of 10.2 and was statistically higher (p = 0.007) than 9.4 tillers per plant observed in the saline treatment of 7.0 dS/m. Interaction analysis showed that the genotypes Puyón/JP003 P11-103115 with 21.33 and Puyón/JP002 P8-305511 with a mean of 21.5 were statistically similar but superior (p = 0.0007) to the rest of the interactions. The genotype JP001/JP003 P1 × 11P 1233 at the salinity level of 7.0 dS/m displayed the lowest average tillers per plant (2.7).
Concerning the panicle length, the commercial variety SFL-011 (control) at the salinity level of 0.2 dS/m reached a length of 27.0 cm, and this value was statistically superior (p < 0.0001) to all the treatments. At a salinity level of 7.0 dS/m, the genotype Puyón/JP002 P8-323523 had the longest panicle with a mean of 21.8 cm and was statistically superior (p < 0.0001) to the other treatments.
For grains per panicle, the variety SFL-011 (control) at a salinity level of 0.2 dS/m had the highest value with 158.5 grains and was statistically higher (p < 0.0001) than the rest of the treatments. At the salinity level of 7.0 dS/m, Puyón/JP003 P11-106716 and Puyón/JP002 P8-294930 showed a higher number of grains per panicle with a mean value of 86.8 and 85.8, respectively. They were statistically superior (p < 0.0001) to the rest of the treatments.
For the variable grain weight per panicle, the genotype Puyón/JP003 P11-103115 and the commercial cultivar SFL-011 (control) at the salinity level of 0.2 dS/m had the highest means with values of 30.3 and 29.8 grams, respectively, and were statistically superior (p < 0.0001) to the rest of the treatments. At the salinity level of 7.0 dS/m, the genotypes Puyón/JP003 P11106716 and Puyón/JP002 P8-294930 showed a higher grain weight per panicle with a mean of 12.7 and 12.3 g, respectively. They were statistically superior (p < 0.0001) to the rest of the treatments.
Regarding the thousand-grain weight, the genotype JP001/JP003 P 3 # 13P 4230 at the salinity level of 0.2 dS/m showed the highest value with a mean of 46.2 g and is statistically superior (p < 0.0001) to the rest of the treatments. At the salinity level of 7.0 dS/m, the JP001/JP003 P1 × 11P 413 line reached the highest thousand-grain weight with a mean of 32.0 g and was significantly different (p < 0.0001) from the rest of the treatments.
Considering the interaction effects, panicle length at the salinity level of 0.2 dS/m (control) had a mean of 18.6 cm. It was statistically superior (p < 0.0001) to the saline treatment of 7.0 dS/m, which obtained a mean of 14.4 cm. The variety SFL-011 (control) with an average of 27.0 cm was superior (p < 0.0001) to the rest of the interaction values at a salinity level of 0.2 dS/m. However, at the salinity level of 7.0 dS/m, the SFL-011 (commercial), the parental genotypes JP001 and JP002, and the genotypes JP002/JP001 P × P 5P 3621 and JP003/JP001 P 1 # P 1P 1530 had the lower means with 0, 7.2, 11.0, 10.0, and 10.4 cm, respectively.
The grain weight per panicle at the salinity level of 0.2 dS/m with a mean of 13.3 g was statistically higher (p < 0.0001) than the treatment with 7.0 dS/m, with a value of 4.98 g. The genotype Puyón/JP003 P11-103115 with 30.3 g and the variety SFL-011 (control) with a mean of 29.8 grams at the salinity level of 0.2 dS/m had values statistically similar (p < 0.0001). Still, they were superior to the rest of the interactions. In all the evaluations conducted for this variable, a decrease in weight at high salinity levels was evident.
The thousand-grain weight at the salinity level of 0.2 dS/m had a mean of 27.0 grams and was statistically higher (p < 0.0001) than the salinity level of 7.0 dS/m, with a mean value of 16.7 g. The genotype JP001/JP003 P 3 # 13P 4230 at the salinity level of 0.2 dS/m was superior to the rest of the interactions (p < 0.0001) with a mean of 46.2 g. Genotypes JP001/JP003 P 9 # 15P 629 (27.8 vs. 23.2 g), DH/JP003 P 1 # 25P 1433 (28.5 vs. 23.7 g), JP001/JP003 P 9 # 15P 732 (29.7 vs. 25.2 g), JP002/JP001 P × P 5P 1322 (30.5 vs. 26.2 g), JP003/JP001 P 1 # P 1P 168 (29.3 vs. 27.5g), and parental line JP003 (28.3 vs. 21.8 g) had higher thousand-grain weight when exposed to a salinity level of 7.0 dS/m than to salinity level of 0.2 dS/m; nonetheless, statistically significant differences between treatment means were not observed.
The number of leaves was consistently high in Puyón/JP003 P11-103115 with a mean of 201.67, statistically superior to the rest of the treatments (p < 0.0001). For the panicle length variable, it was evident that Treatment 10 line reached the greatest length at 33.0 cm and statistically exceeded all treatments (p < 0.0001).
Analysis of variance of chlorophyll content registered at 30 days for the salinity level of 0.2 dS/m showed that the genotypes Puyón/JP003 P11-103115, SFL-011 (control), Puyón/JP003 P11106716, Puyón/JP002 P8-305511, No. 25: Parental JP001, No. 28: Parental Puyón, No. 9: Puyón/JP002 P8-294930 and Puyón/JP002 P8-295616 had higher content with means of 45.3, 45.0, 44.8, 44.8, 44.5, 44.5, 44.4, and 44.3 g, respectively, and were significantly superior (p = 0.0083) to the rest of the treatments. For the salinity level of 7.0 dS/m, Puyón/JP003 P11106716 had the highest chlorophyll content with a mean of 40.2, which was significantly higher (p = 0.0208) than the rest of the other rice lines.
At 45 days, the chlorophyll content in the salinity level of 0.2 dS/m was found to be significantly higher in Puyón/JP002 P8-324816, with a value of 42.2. At the salinity level of 7.0 dS/m, JP002/JP001 P × P51322 obtained the highest chlorophyll content (p = 0.0321), with a mean of 39.6. At 60 days for salinity level 0.2 dS/m, the values were not significantly different (p = 0.1677) among rice lines, though Puyón/JP003 P11-106716 had the highest value chlorophyll content, equal to 37.7. For the salinity level of 7.0 dS/m, Puyón/JP003 P11-106716 had the highest chlorophyll content, equivalent to 32.4, and this value was significantly different (p < 0.0001) from the rest of the other rice lines.
At 75 days, analysis of the variance of chlorophyll content shows no statistically significant differences among values (p = 0.9501), though Puyón/JP003 P11-106716 reached the highest mean with 29.52 and numerically exceeded all treatments. At a salinity level of 7.0 dS/m, JP001/JP003 P 9 # 15P 732 had the highest chlorophyll content with a mean of 27.49 and was statistically more elevated than the rest of the treatments (p < 0.0001).
On the chlorophyll content interactions, the salinity level of 0.2 dS/m irrespective of the evaluations at 30, 45, 60, and 75 days exhibited means of 43.6, 38.2, 33.9, and 25.4 %, respectively. These values were statistically higher (p < 0.0001) than those observed at the salinity level of 7.0 dS/m. In the analysis of each rice line at a salinity level of 0.2 dS/m at 30 days, Puyón/JP003 P11-103115 with a mean of 45.3 was statistically superior (p < 0.0001) to all treatment values. At 45 days, the genotypes Puyón/JP002 P8-324816, with a mean chlorophyll content of 42.2, and Puyón/JP003 P11-103115, with a mean of 41.9 were statistically superior (p < 0.0001) to the rest of the treatments. In the 60-day evaluation, Puyón/JP003 P11-106716 with 37.7, Puyón/JP003 P11-103115 with 37.4, Puyón/JP002 P8-324816 with an average of 36.8, Puyón/JP002 P8-305511 with 35.8, and Puyón/JP002 P8-323523 with a value of 35.8 were significantly higher (p < 0.0001) for chlorophyll content compared to the rest of the rice lines. At 75 days, Puyón/JP003 P11-106716 with a value of 29.5 was statistically higher (p < 0.0001) for chlorophyll content than the other treatments.
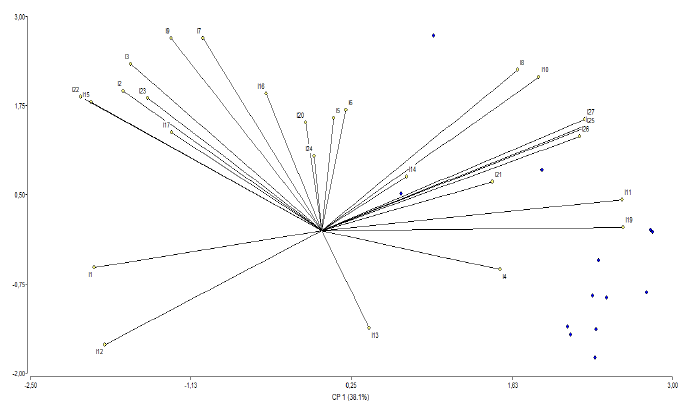
The principal component analysis determined the correlation between some variables (Figure 4). In the upper right quadrant, a correlation was observed between the number of grains per panicle and the grain weight per panicle. The upper left quadrant showed the correlation between the most prominent variables, such as the panicle length (cm), the number of panicles, the number of tillers, and plant height (cm).
Source: Elaborated by the authors
Figure 4 Correlations between the variables determined by the principal component analysis at the greenhouse level under normal 02 dSm and saline 70 dSm conditions in 12 advanced F5 rice lines originating from interspecific crosses of Oryza rufipogon G x Oryza sativa L. ssp. japonica 12 japonica lines five parental lines and a commercial variety SFL011 (Commercial)
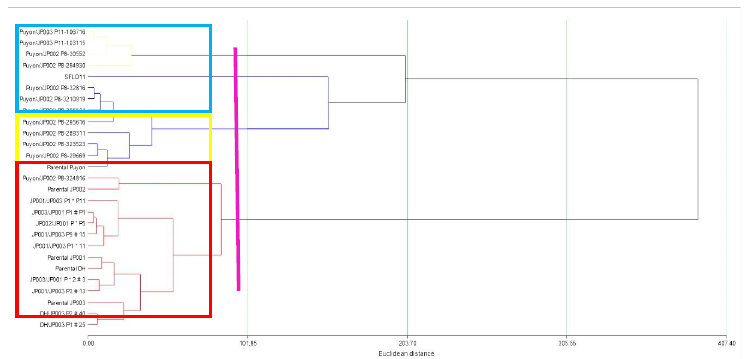
Concerning the cluster analysis, the results allowed the grouping of the lines into three classes with similar characteristics (Figure 5). In Class I (blue), the genetic materials with similar traits were Puyón/JP002 P8-3210919, Puyón/JP002 P8-32816, Puyón/JP002 P8-305511, Puyón/JP002 P8-289311, Puyón/JP002 P8-29669, Puyón/JP002 P8-323523, Puyón/JP002 P8295616, parental Puyón, and SFL-011 (cultivar). Class II (yellow) includes the genotypes Puyón/JP002 P8-30552, Puyón/JP002 P8-294930, Puyón/JP003 P11-103115, and Puyón/JP003 P11-106716. In Class III (red) are Puyón/JP002 P8-324816, JP001/JP003 P1 × 11P 1233, JP001/JP003 P1 × 11P 413, JP001/JP003 P 9 # 15P 732, JP001/JP003 P 9 # 15P 629, JP001/JP003 P 3 # 13P 4230, JP002/JP001 P × P 5P 1322, JP002/JP001 P × P 5P 3621, JP003/JP001 P 1 # P 1P 168, JP003/JP001 P 1 # P 1P 1530, JP003/JP001 P × 2 # 3P 2119, DH/JP003 P 1 # 25P 1433, DH/JP003 P2 # 40P 425, Parental JP001, Parental JP002, Parental JP003, and Parental DH.
Source: Elaborated by the authors
Figure 5 Cluster analysis grouping the lines into three classes with similar characteristics at a greenhouse under normal 02 dSm and saline 70 dSm conditions in 12 advanced F5 rice lines originating from interspecific crosses of Oryza rufipogon G x Oryza sativa L. ssp. japonica
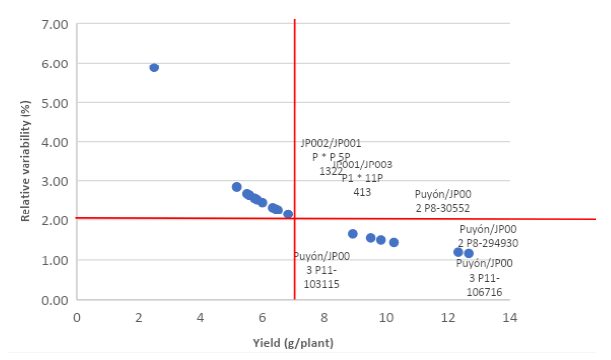
For the analysis of relative variability (Figure 6), the grain yield per plant, the highest values (above the mean) for the yield per plant, and the lowest values (below the mean) of relative variability (%) were considered to select the better lines. The values that were in the lower right quadrant correspond to the selected lines, and these were: Puyón/JP003 P11-106716, Puyón/JP002 P8-294930, Puyón/JP003 P11-103115, Puyón/JP002 P8-30552, JP001/JP003 P1 × 11P 413, and JP002/JP001 P × P 5P 1322. These lines had the highest performance means, from 8.9 to 12.7 g, and for relative variability, the values ranged from 1.65 to 1.16 %.
Source: Elaborated by the author.
Figure 6 Analysis of relative variability (%) using the variable yield per plant as a selection factor at a greenhouse under control (0.2 dS/m) and saline (7.0 dS/m) conditions from 12 advanced F5 rice lines originating from interspecific crosses of Oryza rufipogon G. x Oryza sativa L. ssp. japonica, 12 japonica lines, five parental lines, and a commercial variety SFL-011 (commercial).
Selection and characterization of advanced F6 rice lines subjected to salinity-affected field cropping zone
The line’s plant vigor was evaluated at field conditions with a statistical difference (p = 0.0163). Puyón/JP003 P11-106716, Puyón/JP003 P11-103115, and Puyón/JP002 P8-294930, with an average of 1, were the most vigorous plants.
The sterility analysis of the panicle (%) showed that Puyón/JP003 P11-103115 was the genotype with the lowest sterility with a value of 6.0 percent, significantly higher than the rest of the treatments (p < 0.0001). The remaining lines had higher average values for this variable. On the other hand, the Parental Puyón and the commercial variety SFL-011 (control) had the tallest plant height with average values of 152.7 and 144.7 cm, respectively, and are statistically superior (p < 0.0001) to the rest of the genotypes (Figure 7).
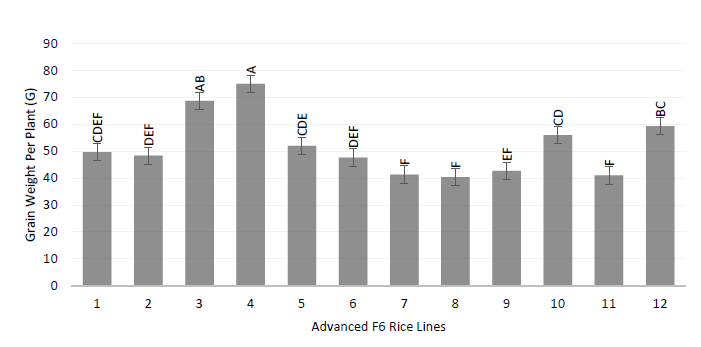
Source: Elaborated by the authors.
Figure 7 Grain weight per panicle D in F6 rice plants subjected to salinity level 72 dSm in the field
For tiller per plant, the advanced lines Puyón/JP003 P11-103115, Puyón/JP003 P11-106716, and Puyón/JP002 P8-294930 presented the higher means with values of 34.7, 34.0, and 32.6, respectively, and were statistically superior to the rest of the treatments (p < 0.0001).
The means of grains per panicle showed that the genotypes Puyón/JP003 P11-106716 and Puyón/JP003 P11-103115 had a higher number of grains per panicle with means of 195.0 and 188.7, respectively, and were statistically superior to the rest of the treatments (p < 0.0001). For the variable grain weight per panicle, Puyón/JP003 P11-103115 had the highest mean with a 75 g, statistically more elevated than the rest of the treatments (p < 0.0001). For thousand-grain weight, it was determined that JP002/JP001 P × P 5P 1322 showed the highest mean of 31.33 g and was statistically superior to the rest of the treatments (p = 0.0008).
For grain length, Puyón/JP003 P11-106716 and cultivar SFL-011 (control) had a mean of 8 mm and were statistically superior to the rest of the treatments (p < 0.0001). The chlorophyll measurement was carried out at 30, 45, 60, and 75 days after seeding and showed that Puyón/JP003 P11-103115 had the highest mean equal to 65.4, 53.7, 48.6, and 47.5 g for each date and were statistically superior to the rest of the treatments (p < 0.0001).
Principal component analysis shows a correlation between certain variables (Figure 8). In the upper right quadrant, a correlation is observed between the most relevant variables: length of the flag leaf (cm), dry biomass of the aerial part (g), fresh biomass of the aerial part (g), fresh biomass of the root (g), panicle length (cm), and width of the second leaf. In the lower right quadrant, there is a correlation between the number of tillers, leaves, and grain length (mm).
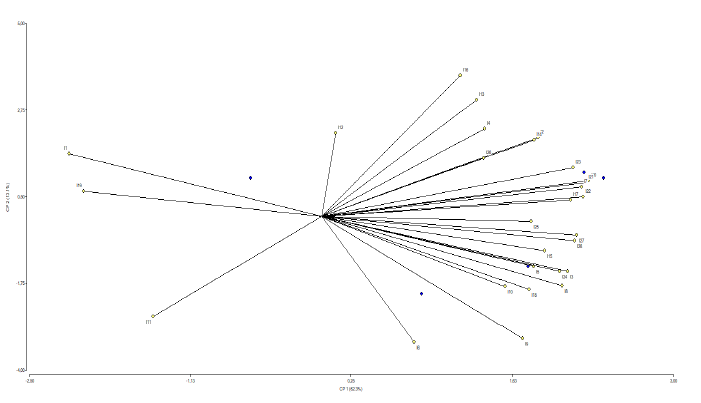
Source: Elaborated by the authors
Figure 8 Correlation between certain variables resulting from the principal component analysis of four advanced F6 rice lines from interspecific crosses of Oryza rufipogon G x Oryza sativa L. ssp. japonica two japonicatype rice lines four parental lines and two cultivars the SFL011 and Arenillas
The cluster analysis identified genetic material with similar characteristics, forming different classes or groups, as shown in Figure 9. In Class I (blue color), the lines with similar traits were JP001/JP003 P1 × 11P 413, JP002/JP001 P × P 5P 1322, Parental JP001, Parental JP002, and Parental JP003. Class II (red) includes Puyón/JP002 P8-30552, Puyón/JP002 P8-294930, Puyón/JP003 P11-106716, Puyón/JP003 P11-103115, Parental Puyón, SFL-011 (control), and Arenillas (control), which were grouped according to their performance in agronomic and yield components against salinity.
For the relative variability analysis (%), the yield per plant was used as the selection factor. The highest values (above the mean) for the yield per plant and the lowest values (below the mean) of relative variability (%) were considered to select the best lines. As shown in Figure 10, the values in the lower right quadrant are the lines with tremendous potential, corresponding to Puyón/JP003 P11-103115, Puyón/JP003 11-106716, Arenillas (commercial), and Parental Puyón. These lines had the best means for yield ranging from 56.0 to 75 g/plant and 1.6 to 2.1% for relative variability.
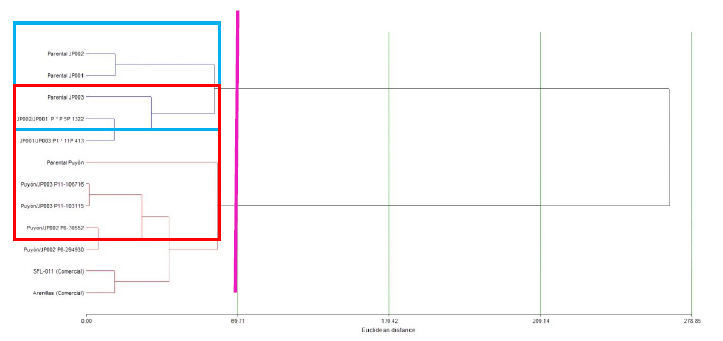
Source: Elaborated by the authors
Figure 9 Grouping of the rice genetic material that shows similar characteristics through the cluster analysis (EuclideanWard distance)
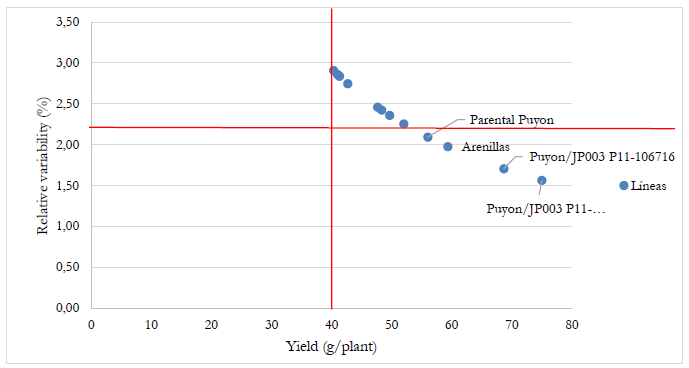
Source: Elaborated by the authors
Figure 10 Relative variability analysis (%) using the variable yield per plant as a selection factor from four advanced F6 rice lines from interspecific crosses of Oryza rufipogon G. x Oryza sativa L. ssp. japonica, two japonica rice lines, four parental lines, and two cultivars (SFL-011 and Arenillas).
Discussion
This study aimed to select and characterize advanced salinity-tolerant rice lines in segregating populations derived from interspecific crosses between Oryza rufipogon G. (Puyón) x Oryza sativa L. ssp. japonica and intraspecific crosses of japonica-type lines, conducted in two stages: the first stage at the greenhouse level and the second at the field level. The study showed two good interspecific crosses, Puyón/JP003 P11-103115 and Puyón/JP003 11-106716, which appeared tolerant to salinity conditions. These interspecific crosses exhibited the best yields comparable to Arenillas (commercial) and Parental Puyón.
With the soil analysis results in the field study, soil electrical conductivity indicated salinity problems that were increased by climate change and poor agricultural practices. These salinity conditions are associated with saline intrusion from the Babahoyo River entering through estuaries and irrigation canals and poor drainage (Pozo et al., 2010). As mentioned by these authors, this water has a high concentration of salts that generally exceed the tolerance limits of rice, which impacts its production (Ramírez & Hernández, 2016).
The interaction results showed that vigor in the greenhouse condition differed from the control. The differences were statistically greater for the saline treatment. Regarding the genotypes evaluated at the control level SFL-011 (commercial), JP001/JP003 P1 × 11P 1233, JP001/JP003 P 9 to 15P 629, JP002/JP001 P × P 5P 3621, JP003/JP001 P 1 to P 1P 1530, JP003/JP001 P × 2 to 3P 2119, and DH/JP003 P 1 to 25P 1433 were statistically superior to the rest of treatments. For salinity level, JP001/JP003 P1 × 11P 413 and JP001/JP003 P 9 to 15P 629 showed the highest vigor, statistically superior to the rest of the genotypes. In phase 2, Puyón/JP003 P11106716, Puyón/JP003 P11-103115, and Puyón/JP002 P8-294930 were the most vigorous plants, which is consistent with the observations reported by García et al. (2009), mentioning that the best yields are comparable to those of Arenillas (commercial) and Parental Puyón.
According to the soil analysis results, the electrical conductivity indicated increasing salinity problems due to climate change and poor agricultural practices. These salinity conditions are associated with the intrusion of the Babahoyo River that enters through the estuaries and ditches with high salinity levels, which is accompanied by poor drainage (Pozo et al., 2010). Coinciding with the authors, the water used by these producers maintains high concentrations of salts that exceed the tolerance of rice, with repercussions on its production (Ramírez & Hernández, 2016).
The interaction results showed that vigor in the greenhouse condition had differences concerning the control statistically greater than the saline treatment. Regarding the genotypes evaluated at the control level SFL-011 (Commercial), JP001/JP003 P1 × 11P 1233, JP001/JP003 P 9 to 15P 629, JP002/JP001 P × P 5P 3621, JP003/JP001 P 1 to P 1P 1530, JP003/JP001 P × 2 to 3P 2119, and DH/JP003 P 1 to 25P 1433 were statistically superior to the rest of treatments. For salinity level, JP001/JP003 P1 × 11P 413 and JP001/JP003 P 9 to 15P 629 showed the highest vigor, statistically superior to the rest of the genotypes. In phase 2, Puyón/JP003 P11106716, Puyón/JP003 P11-103115, and Puyón/JP002 P8-294930 were the most vigorous plants, which is consistent with the observations reported by García et al. (2009) in their study on the increase in salinity levels (Mahmood et al., 2009; Rad et al., 2012).
The greenhouse's number of tillers per plant indicated that the control salinity level was statistically superior to the saline treatment. As for salinity level, two had the highest number of tillers, considering similar results in the field. Among the evaluated materials, there is evidence of loss of tillage in saline conditions, which is consistent with Nawaz et al.’s (2010), indicating that the damage caused by salt concentration resulted in disorders caused in the metabolism of plants, mainly due to changes in the osmotic potential of the soil, nutritional imbalance by the interaction between toxic ions and essential nutrients for plant growth and development.
This research showed the damage caused by the excess of salts in the morphological characteristics of rice, such as vigor, panicle sterility, plant height, and the number of tillers. These results are consistent with other authors, who indicated that excess Na+ in plant cells directly damages membrane systems and organelles, resulting in reduced growth and abnormal development before plant death (Singam et al., 2011). When an excessive amount of salt enters the plant, the salt concentration will eventually increase to a toxic level in the leaves, causing premature senescence and reducing the development of plant organs to a level that cannot sustain growth (Rad et al., 2012).
For panicle length in the greenhouse at the control salinity level, the commercial line SFL-011 reached the most extended length. Concerning salinity level, Puyón/JP002 P8-323523 was statistically higher than other treatments. Similarly, the results obtained in field experiments showed differences between the established genotypes since the Parental Puyón reached the most extended length and statistically surpassed all treatments. The results of this study coincide with those reported by Páres and Basso (2013), who state that salinity negatively affects crop development.
Moreover, the decrease of panicle grains under a salinity effect was evident throughout this research. These results are related to what Zeng and Shannon (2000) mentioned; they point out that salinity causes a significant reduction in seedling establishment, leading to losses in yield components.
In all the evaluations conducted in this study for grain weight, a decrease in weight was evident at high salinity levels; a result attributed to the detrimental effect salinity causes on early-stage crops (Tavakkoli et al., 2011). Other authors, such as Rao et al. (2008), mention that salinity induces biochemical and physiological changes that cause growth inhibition and yield loss.
Concerning thousand-grain weight under greenhouse conditions, the control salinity level was statistically superior to the 7.0 dS/m salinity level. Similar results were obtained in field experiments, where the genotype JP002/JP001 P × P 5P 1322 showed the highest average, which is consistent with Torabi and Halim (2013), who mentioned that salinity is one of the major abiotic factors affecting the growth, yield, and quality of crops through stress. Salinity stress tends to shorten the duration of spikelet differentiation, resulting in fewer grains per panicle.
Regarding chlorophyll content, all tests showed that genotypes subjected to salinity had low chlorophyll levels. Accordingly, Netondo et al. (2004) show that changes in chlorophyll fluorescence (Fv/Fm) and membrane permeability are efficient and potential indicators of understanding the inhibitory effect of salt on photosynthetic efficiency. The present research results are consistent with what Sandoval et al. (2010) reported. The authors indicate that the ions that induce more problems are chlorine and sodium since their accumulation in the leaves produces marginal chlorosis of the leaf zone. Therefore, a decrease in the photosynthetic area determines reductions in net photosynthesis, which is also consistent with De Lucena et al.’s study (2012). They explain that the excess salt level in the cell causes the deposition of materials in the cell wall and decreases its elasticity.
In all the evaluations, an increase in the number of leaves in salinity-resistant lines was evident regarding the number of leaves, which is consistent with the study conducted by Aguilar et al. (2016). They detail that salinity conditions control the transport of salts at the plasmalemma and tonoplast levels and their compartmentalization in the different plant organs.
Based on the results presented, Lamz and González (2013) emphasize that only 25% of the genetic variability in wild species has been used in the genetic improvement of rice. Puyón is genetic material from another species related to Oryza, which is more likely to carry genes for resistance to biotic and abiotic factors. When used as a parent, its offspring would inherit these characteristics, allowing the selection of cultivars with commercial traits for production in marginal areas and environments increasingly affected by climate change.
In terms of correlation, there is a strong relationship between variables such as flag leaf length (cm), aerial part dry biomass (g), aerial part fresh biomass (g), fresh root biomass (g), panicle length (cm) and second leaf width, number of tillers, number of leaves, grain length (mm). In this regard, wide variability among rice genotypes in response to salinity has been documented. High salt concentrations in irrigation water can reduce the germination rate by almost 50% and yield by 80% for susceptible cultivars (Asch & Wopereis, 2001).
Conclusions
We found that the F5 rice lines Puyón/JP003 P11-106716, Puyón/JP002 P8-294930, Puyón/JP003 P11-103115, Puyón/JP002 P8-30552, JP001/JP003 P1 × 11P 413, and JP002/JP001 P × P 5P 1322 had the best agricultural yields on conditions of abiotic stress and outperformed the cultivar control SFL-011 (commercial), indicating that these cultivars could be used as good options for rice production in salinity-affected rice fields.
On the selection and characterization of advanced F6 rice lines subjected to field affected by salinity, it was concluded that Puyón/JP003 P11-103115 and Puyón/JP003 P11-106716 exhibited a more significant number of tillers, a greater number of leaves, less panicle sterility (%), a more significant number of grains per panicle, and greater weight of grains per plant (g). Relative variability analysis (%) consistently showed the most important genetic potential of Puyón/JP003 P11-103115 and Puyón/JP003 P11-106716 for agricultural yields. Because both outperformed the commercial control SFL-011 variety, we recommend these lines as the new cultivars for rice production in abiotic stress field conditions.
Contribución de los autores
Fernando Cobos Mora: registro de información en campo, construcción de bases de datos, análisis de información y elaboración de manuscrito; Luz Rayda Gómez-Pando: análisis de información y elaboración de manuscrito; Walter Oswaldo Reyes Borja: elaboración de proyecto para acceso a recursos económicos, supervisión de actividades, análisis de información y elaboración de manuscrito; María Ruilova Cueva: análisis de información y elaboración de manuscrito; Reina Concepción Medina Litardo: registro de información en campo, análisis de información y elaboración de manuscrito; Danilda Hufana-Duran: análisis de información y elaboración de manuscrito.

