Services on Demand
Journal
Article
Indicators
-
 Cited by SciELO
 -
 Access statistics
Related links
-
 Cited by Google
 -
 Similars in
SciELO
 -
 Similars in Google
Share
Boletín de Investigaciones Marinas y Costeras - INVEMAR
Print version ISSN 0122-9761
Bol. Invest. Mar. Cost. vol.22 no.1 Santa Marta Jan./Dec. 1993
COMPARING K-DOMINANCE CURVES: YET ANOTHER SUGGESTION
Camilo B. García
Facultad de Biología Marina, Seccional de Santa Marta, Universidad Jorge Tadeo Lozano, A.A. 5273, El Rodadero, Santa Marta, Colombia.
ABSTRACT
A simple procedure is presented which facilitates the comparison of k-dominance curves and permits statistical comparison of replicated curves. Two indices are proposed, one for diversity (KDI) and one for dominance (KDO), which summarize the relationships in terms of diversity between one assemblage and all the others In a given set of data, as it is depicted by k-dominance curves.
RESUMEN
Se presenta un procedimiento sencillo que facilita la comparación de curvas de k-dominancia y permite la comparación estadística de curvas replicadas. Se proponen dos índices: uno para diversidad (KDI) y uno para dominancia (KDO) que sumarizan la relación en términos de diversidad, tal como esta relación es representada por las curvas de k-dominancia, entre un ensamblaje y todos los demás dentro de un grupo dado de datos.
INTRODUCTION
The k-dominance curves introduced by Lambshead et al. (1983) have become popular in benthic ecology as graphical means of studying diversity (e.g. Warwick and Clarke, 1991). Their utility, however, has been limited by the lack of an appropiate procedure for statistical comparison of replicated curves. The clarity of presentation, and with it, visual discrimination between curves, also declines sharply as more curves are plotted together. Recently three suggestions have been made to deal with the issues above (Clarke, 1990, McManus and Pauly, 1990, and Garcia and Salzwedel, 1991). The first two deal specifically whith the extension of the original idea, the ABC curves of Warwick (1986). These first two approaches involve calculation of areas between curves. Clarke (1990) also suggested a transformation of the y-axis to improve clarity of the plots. I introduce here a modification of the strategy presented by Garcia and Salzwedel (1991) that is less cumbersome. The purpose is the same: clarity of presentation and interpretation, and as mean of statistical comparison of replicated k-dominance curves which does not involve major calculations.
PROCEDURE
By means of a visual comparison of all possible pairs of curves a triangular Matrix of Comparisons (Garcia and Salzwedel, 1991) can be constructed where the entries are assemblage labels and the indices can take on two values, following the Lambshead et al. (1983) criteria: whether the assemblage on the row is more diverse than the assemblage on the column (relation symbolized by >), or the assemblage on the column is more diverse than the assemblage on the row (relation symbolized by V). When two curves cross they are not comparable (Lambshead et al, 1983), symbolized by N.C. For each assemblage the number of times it is found to be both more diverse and less diverse in the Matrix of Comparisons is scored. When ranked, these numbers, which I will call k-diversity and k-dominance indices, KDI and KDO, respectively, provide information as to the global ordering of assemblages in terms of diversity and dominance as pictured by k-dominance curves. If there is some spatial, temporal or other gradient, the KDI and KDO indices can be plotted against the corresponding gradient's values to explore the behavior of diversity and dominance along the gradient. In the case of replicated k-dominance curves, mean KDIs and KDOs and their standard deviations can be calculated and plotted as above. The mean KDIs and KDOs can be used as input for analyses of variance and other comparative analyses.
EXAMPLES
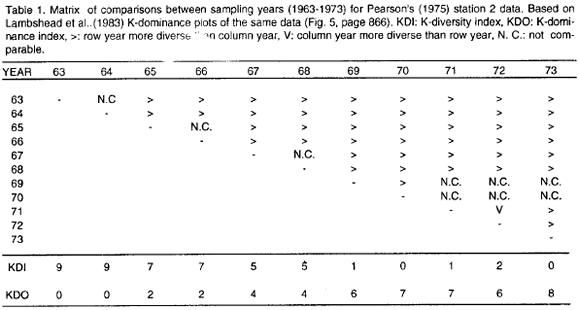
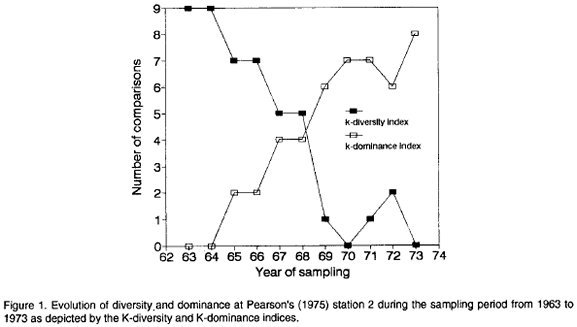
In order to illustrate the application of the KDI and KDO indices to study the behavior of diversity and dominance along gradients I will use the data of Pearson (1975) on the evolution of two permanent benthos stations under pollution stress through the discharge of an adjacent pulp mill. Lambshead et al. (1983) presented k-dominance curves for Pearson's station 2 for each year of the study from 1963 to 1973 (Fig. 5, page 866). Table 1 shows the corresponding Matrix of Comparisons including the scored KDIs and KDOs. Figure 1 shows the plot of KDIs and KDOs against the corresponding years.
The behavior of diversity during this period as shown by the KDI index is in accordance with the conclusions of Pearson (1975) and posterior analyses of the same data (e.g., Warwick, 1986). A trend of decreasing diversity is evident during this decade. In 1970 the lowest diversity was reached (Fig. 1) perhaps in response to the maximum discharge level of the pulp mill (Pearson, 1975). In 1971 and 1972 there appeared to be some signs of recuperation but in 1973 diversity dropped again (Fig. 1). Dominance as depicted by the KDO index behaved in the opposite way, increasing during the decade (Fig. 1).
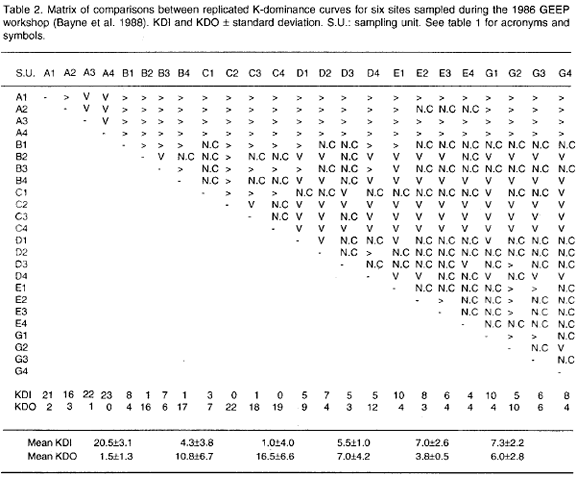
Statistical possibilities of the KDI and KDO indices will be illustrated with the macrobenthos data set gathered and used by the Group of Experts on the Effect of Pollutants (GEEP) set up by the International Oceanographic Commision, in their 1986 workshop (Bayne et al., 1988). The sampling was done at 6 sites (four replicates/site) along a contamination gradient in Frierfjord/Langesundfjord, Norway, from the top to Langesund Bay (Bayne et al. 1988). The area is affected by different sources of pollution including heavy industrial and municipal waste water (Folium and Moe, 1988). Raw data were taken from table 1 of Appendix 3 of the Marine Ecology Progress Series Special Vol. 46.
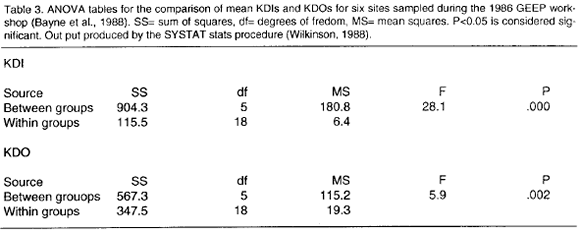
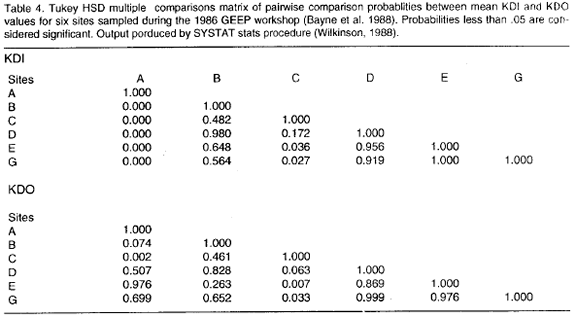
Table 2 shows the Matrix of Comparisons including mean values for the KDI and KDO indices. Ranking the mean KDIs in decreasing order the following pattern is obtained: A>G>E>D>B>C, where the letters are station labels (Folium and Moe 1988). Analysis of Variance (ANOVA) of mean KDIs indicates that there are differences in mean diversity as depicted by k-dominance curves between stations (p=0.000, table 3). The Tukey HSD multiple comparisons test identifies station A as different from all the others (p=0.000, table 4), whereas station C was found different from stations G and E (p<0.05). Thus a gradient of diversity does exist: station A is distinct and the most diverse, stations G+E are truly more diverse than station C and stations D+B are intermediary between stations A+G+E and station C.
Confirmation of this picture is obtained when ANOVA is applyed to the KDOs. There is a significant difference between mean KDOs (p<0.01, table 3). The Tukey HSD multiple comparisons test identifies station C as different in mean dominance to the other stations excepting stations B and D (p<0.05, table 4). Stations B and D, however, are not different from the others (p>0.05, table 4).
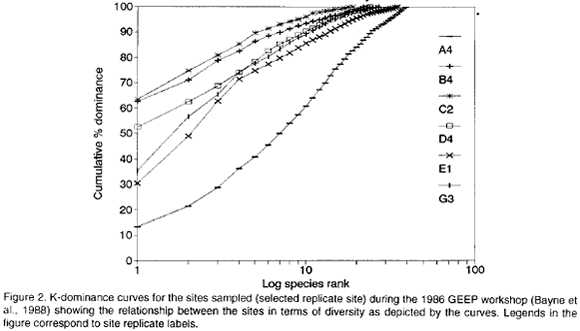
The results above are well in agreement with the results of the GEEP workshop. A variety of univariate measures identified stations B and C as the most stressed followed by D, E, G and A in decreasing order. Indicator taxa suggested a stress condition for stations B, C and D, and "unpolluted" conditions for stations G and A, whereas the status of station E was equivocal. ABC plots indicated that stations C and D were "moderately to grossly polluted", stations B and E were "moderately polluted" and stations G and A were "unpolluted" (Warwick, 1985). The quotation marks reflect the fact that the assemblage structures followed a depth gradient rather than a pollution gradient (Warwick, 1988). Figure 2 shows selected k-dominance curves in order to illustrate the diversity relation between stations.
DISCUSSION
The evident inverse correlation between KDI and KDO indices (see Fig. 1) is of course not surprising on theoretical grounds (diversity and dominance are inverse complementary concepts). However, the KDO index is not necessarily the a mirrow image of the KDI index. For instance, the Spearman correlation between KDI and KDO for the second example here is -0.8. This is due to the fact that diversity also depends on the number of species and an assemblage may be more often noncomparable, according to the criteria of Lambshead et al. 1983, than other. Noncomparability, however, occurs not only when there is a marked difference in species numbers. It may also arise when one assemblage shows higher incidence of codominance in relation to another.
Since the value of the KDI and KDO indices is inversely related to the number of noncomparable scores, it is convenient to keep it low. Very often the crossing of k-dominance curves occurs at the end, reflecting a slight difference in species numbers. In such cases, I suggest to ignore the crossing, provided it does occur at the very end of the curves. This is equivalent to reducing the data matrix by eliminating rare species, a common procedure in benthos studies (e.g. Field et al., 1982). On the other hand to ignore crossings due to codominance in one assemblage with respect to the other would render the procedure useless.
The approach introduced here may prove to be useful on account of its simplicity and because it rescues the idea of noncomparability of assemblages in terms of diversity under certain circumstances (see Lambshead et al., 1983 and references therein), which has been neglected since then. Naturally the procedure must be tested in different situations to explore its limitations.
ACKNOWLEDGEMENTS
This paper is based on a Dr. rer. nat. dissertation by C.B. Garcia, Biology/Chemistry Faculty, University of Bremen, Germany. The author has been finantially supported by a scholarship from the Deutscher Akademischer Austauschdienst, DAAD. The comments of two anonymous reviewers are gratefully acknowledged.
REFERENCES
1 Bayne, B.L., Addison, R.F;, Capuzzo, J.M., Clarke, K.R., Gray, J.S., Moore, M.N. and Warwick, R.M. 1988. An overview of the GEEP workshop. Marine Ecology-Progress Series 46: 235-243. [ Links ]
2 Clarke, K.R. 1990. Comparisons of dominance curves. Journal of Experimental Marine Biology and Ecology 138: 143-157. [ Links ]
3 Field, J.G., Clarke, K.R. and Warwick, R.M. 1982. A practical stategy for analysing multispecies distribution patterns. Marine Ecology-Progress Series 8: 37-52. [ Links ]
4 Folium, O.A. and Moe, K.A. 1988. The GEEP workshop: field sampling. Marine Ecology-Progress Series 46: 7-12. [ Links ]
5 García, C.B. and Salzwedel, H. 1991. Structure of soft-bottom macrobenthos in shallow areas off the Caribbean coast of Colombia: introducing a new analysis strategy. 239-249. In: Estuaries and Coast: Spatial and Temporal Intercomparisons.Edited by Elliot,EM. and Ducrotoy, J-P Proceedings ECSA 19 Symposium, Caen, 1989. Olsen and Olsen. [ Links ]
6 Lambshead, P.J.D., Piatt, H.M. and Shaw, K.M. 1983. The detection of differences among assemblages of marine benthic species based on an assessment of dominance and diversity. Journal of Natural History 17: 859-974. [ Links ]
7 McManus, J.W. and Pauly, D. 1990. Measuring ecological stress: variation on a theme by R.M. Warwick. Marine Biology 106: 305-308. [ Links ]
8 Pearson, T.H. 1975. The benthic ecology of Loch Linnhe and Loch Eil, a sea loch system on the west coast of Scotland. IV. Changes in the benthic fauna attributable to organic enrichment. Journal of Experimental Marine Biology and Ecology 20: 1-41. [ Links ]
9 Warwick, R.M. 1986. A new method for detecting pollution effects on marine macrobenthic communities. Marine Biology 92: 557-562. [ Links ]
10 Warwick, R.M. 1988. Effects on community structure of a pollutant gradient-summary. Marine Ecology-Progress Series 46: 207-211. [ Links ]
11 Warwick, R.M. and Clarke, K.R. 1991. A comparison of some methods for analysing changes in benthic community structure. Journal of the marine biology Association U.K. 71: 225-244. [ Links ]
12 Wilkinson, L. 1988. SYSTAT: The System for Statistics. Evanson, II. SYSTAT, Inc. 822 pp. [ Links ]


