


Services on Demand
Journal
Article
 English (pdf)
 Article in xml format
 Article references
 Send this article by e-mail
Indicators
-
 Cited by SciELO
 -
 Access statistics
Related links
-
 Cited by Google
 -
 Similars in
SciELO
Similars in
SciELO -
 Similars in Google
Share

 Permalink
Boletín de Investigaciones Marinas y Costeras - INVEMAR
Print version ISSN 0122-9761
Bol. Invest. Mar. Cost. vol.45 no.1 Santa Marta Jan./June 2016
DIVERSITY AND DISTRIBUTION OF FISHES ALONG THE DEPTH GRADIENT OF A CORAL REEF WALL AT SAN ANDRÉS ISLAND, COLOMBIAN CARIBBEAN
DIVERSIDAD Y DISTRIBUCIÓN DE PECES EN EL GRADIENTE DE PROFUNDIDAD DE UNA PARED ARRECIFAL CORALINA EN LA ISLA DE SAN ANDRÉS, CARIBE COLOMBIANO
Karen Melissa Serna Rodríguez1, Fernando A. Zapata1 y Luz Marina Mejía-Ladino2,3
1Universidad del Valle, Departamento de Biología, Grupo de Investigación en Ecología de Arrecifes Coralinos, Apartado aéreo 25360, Cali, Colombia. karen.serna@correounivalle.edu.co
2Instituto de Investigaciones Marinas y Costeras (Invemar), Sede Pacífico, Vía Cali-Palmira, Palmira, Colombia. fernando.zapata@correounivalle.edu.co
3Present address: Av. Santander No. 44-47, Apto 1302, Cartagena, Colombia. mardeluz2@gmail.com
ABSTRACT
"Blue Wall", in San Andrés Island (Colombia), is an outer reef slope with an inclination that increases with depth to nearly 90°. Such a steep gradient facilitates the identification of patterns of variation in species abundance and diversity along depth. To document such patterns in fishes associated with this habitat, 30 visual censuses were conducted along 30 x 2 m transects, located at 5 m intervals between 5-30 m depth, in which the abundance and diversity of species was estimated. A total of 2916 individuals belonging to 46 species from 21 families were recorded within transects. Ten additional species were observed outside of transects for a total richness of 56 species. The dominant species were Canthigaster rostrata, Chromis cyanea, Stegastes partitus, Thalassoma bifasciatum and Clepticus parrae, which together with four other species accounted for 92% of the total abundance. Several of these dominant species are planktivorous and abundant throughout the Caribbean and had broad ranges of vertical distribution with abundance peaks in different parts of the depth gradient. In general, there was a positive correlation between average abundance and breadth of depth distribution. Non-metric Multi-Dimensional Scaling analysis revealed distinct assemblages at each depth, which also differed significantly, but weakly, in their diversity and dominance, but not in their species richness and evenness.
Shallow assemblages were clearly distinctive from deep ones, with greater differentiation between shallower than between deeper assemblages. We conclude that the fish assemblage at "Blue Wall" exhibits a structural order that can be explained, in part, by depth and that reef walls offer an excellent opportunity to examine processes responsible for patterns of community structure in coral reef fishes.
KEY WORDS: Abundance, Community structure, Outer reef slope, Species assemblages, Vertical zonation.
RESUMEN
"Blue Wall" en la isla de San Andrés, Colombia, es una pendiente arrecifal externa con una inclinación que aumenta con la profundidad hasta casi 90°. Un gradiente tan pronunciado facilita la identificación de patrones de variación en la abundancia y diversidad de especies con la profundidad. Para documentar tales patrones en los peces asociados a este hábitat, se realizaron 30 censos visuales en transectos de 30 x 2 m, dispuestos a intervalos de 5 m entre 5 y 30 m de profundidad, en los cuales se estimó la abundancia y diversidad de especies. Un total de 2916 individuos pertenecientes a 46 especies de 21 familias fue observado dentro de los transectos. Diez especiesadicionales fueron observadas fuera de los transectos para una riqueza total de 56 especies. Las especies dominantes fueron Canthigaster rostrata, Chromis cyanea, Stegastes partitus, Thalassoma bifasciatum y Clepticus parrae, las cuales, junto con otras cuatro especies, representaron 92% de la abundancia total. Varias de esas especies son planctívoras y abundantes en todo el Caribe. Estas especies presentaron amplios ámbitos de distribución vertical con picos de abundancia en distintas partes del gradiente de profundidad. En general, hubo una correlación positiva entre la abundancia promedio y la amplitud de la distribución batimétrica. Un Análisis de Escalamiento Multi Dimensional no métrico reveló que existen ensamblajes distintivos en cada profundidad, que además difirieron significativa, pero débilmente, en su diversidad y dominancia, pero no en su riqueza de especies y equitabilidad. Los ensamblajes más someros se distinguieron claramente de los más profundos, con una mayor diferenciación entre los más someros que entre los más profundos. Se concluye que los ensamblajes de peces de "Blue Wall" presentan un orden estructural que puede ser explicado, en parte, por la profundidad y que las paredes arrecifales ofrecen una excelente oportunidad para examinar los procesos responsables de los patrones de estructura de la comunidad de peces de arrecifes coralinos.
PALABRAS CLAVES: Abundancia, Estructura de comunidades, Ensamblajes de especies, Pendiente arrecifal externa, Zonación vertical.
INTRODUCTION
Documenting patterns of distribution, abundance and diversity of species along environmental gradients has long been a main focus of ecology (Krebs, 2001; Begon et al., 2006). In marine environments, several variables, such as temperature, pressure and light, vary as a function of depth, which is, therefore, a physical characteristic of the habitat that differentially controls the distribution of species and significantly influences community structure (Levinton, 1982). On coral reefs, for instance, depth has often been found to be a significant predictor of reef fish diversity (Sale, 1977; Wellington, 1982; Russ, 1984; Alevizon et al., 1985; Roberts and Ormond, 1987; McGehee, 1994; Friedlander and Parrish, 1998; Bouchon-Navaro et al., 2005).
Coral reefs are one of the most diverse and complex marine ecosystems on the planet (Sheppard et al., 2009). Typically, they have a physiographical structure and pattern of zonation from the coast towards off-shore areas resulting from the combination of hydrodynamic, wave energy and depth gradients (Blanchon, 2011). Two major reef zones are among those recognized on coral reefs: a reef platform or reef flat, with a horizontal orientation, and an outer reef slope, with an inclined orientation as depth increases. Reef zones vary in size, composition and structure in accordance with local conditions, but have similar and recognizable basic characteristics (Goreau and Goreau, 1973; Alevizon et al., 1985; Guilcher, 1988; Blanchon, 2011). The outer reef slope has been characterized as the most exposed geological structure on coral reefs, and it is also the least known zone (Harmelin-Vivien, 1977). Steeply inclined (to about 90°) outer reef slopes form so-called "reef walls", whose study should facilitate the identification of patterns of spatial variation in the abundance and diversity of species along depth gradients.
Fishes are one of the most notorious faunal groups on coral reefs. They include a variety of functional groups that play fundamental, diverse and complex ecological roles (Sale, 2002). Fish assemblages on reef flats are usually different from those on outer reef slopes (Russ, 1984; Alevizon et al., 1985; Galzin and Legendre, 1987), which often support a rich and complex fish fauna which has not yet been examined in detail (Hiatt and Strasburg, 1960; Harmelin-Vivien, 1977; Edwards and Rosewell, 1981; Williams and Hatcher, 1983; Galzin, 1987; Zapata and Morales, 1997). Some studies have specifically described the occurrence of shallow fish assemblages that are distinct from deep assemblages, while the greatest diversity occurs at intermediate depths as result of species turnover between the shallow and deep assemblages (Gosline, 1965; Harmelin-Vivien, 1977; Edwards and Rosewell, 1981; Bouchon-Navaro et al., 2005; Brokovich et al., 2008; García-Sais, 2010).
Outer reef slopes can have different morphologies depending on their steepness and length, which vary with the depth of the ocean floor on which reefs are built (Guilcher, 1988). Although some studies of reef fish communities have included outer reef slopes in their sampling, including studies in the Caribbean (Bouchon-Navaro et al., 2005), Indian Ocean (Harmelin-Vivien, 1977), Red Sea (Edwards and Rosewell, 1981), French Polynesia (Galzin, 1987) and Eastern Tropical Pacific (Zapata and Morales, 1997), few studies have focused exclusively on this zone (Harmelin-Vivien, 1977; Sheppard, 1980; Williams and Hatcher, 1983), and even less so on reef walls proper. Furthermore, only a few studies have begun to examine changes in community structure of coral reef fishes along marked depth gradients (Brokovich et al., 2008; García-Sais, 2010). For this reason, the information gap on this habitat and associated fish assemblages is notable. To help fill this gap, the aim of this study was to describe patterns of variation in fish community structure along the depth gradient of Blue Wall, a reef wall located at San Andrés Island, in the Colombian Caribbean. Specifically, we focused on the following questions: What are the patterns of fish abundance, distribution and diversity along the depth gradient at Blue Wall? Does the fish fauna exhibit a pattern in which distinct assemblages characterize different zones along the depth gradient?
STUDY AREA
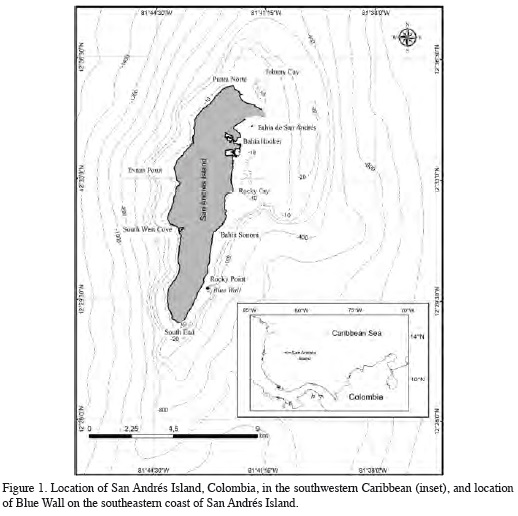
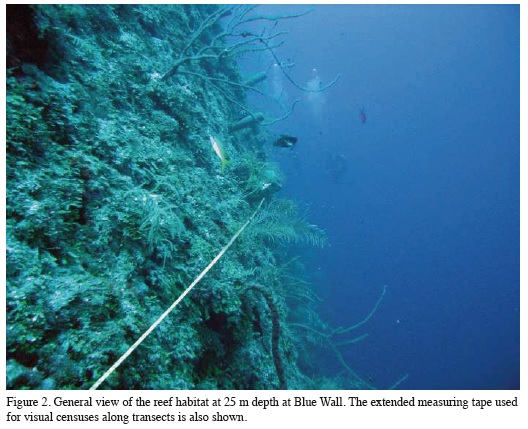
This study was conducted at the site known as Blue Wall (12° 29' 53.1" N, 81° 42' 52.8" W), also referred to as Blue Hole by Victoria and Gómez (1984) or as Bocatora Hole by Geister and Díaz (1997). This site is located on the windward, southeast coast of the oceanic island of San Andrés in the Colombian Caribbean (Figure 1). The reef flat is between 5 and 7 m deep and extends about 300 m from the coast. At the outer reef edge, the inclination of the substrate increases precipitously with increasing depth reaching nearly 90° at 30 m (Figure 2), forming a reef wall dropping to a terrace located at 40 m, and further outward reaching depths near 200 m. This wall was possibly formed during the Pleistocene by gravitational collapse of the unstable margin of the fore-reef terrace as a result of earthquakes and faulting (Geister and Díaz, 1997; Díaz, 2005).
The substrate on the wall is characterized by the presence of algal turfs, macroalgae (Dictyota spp., Ectocarpus sp., Lobophora variegata, Udotea sp., Sargassum sp.), encrusting algae (Lithophyllum sp., Peysonellia sp.) and erect calcareous algae (Amphiroa sp., Halimeda spp.). There were also scattered corals (Agaricia sp., Porites astreoides, P. porites, Orbicella annularis, Montastraea cavernosa, Meandrina sp., Siderastrea sp., Colpophyllia sp., Dichocoenia stokesi and Diploria sp.), fire corals (Millepora sp.), octocorals, and tubular sponges. Erect calcareous algae (Halimeda spp.) were the organisms with the highest coverage. During the study period, water temperature varied between 23 and 27° C and visibility between 2 and 20 m.
MATERIALS AND METHODS
Data were collected in the field between November and December 2011. Initially some dives were done to characterize the study area and standardize methods. Six depths were chosen a priori for sampling at arbitrary intervals of 5 m from the outer edge of the reef flat down to 30 m depth. Visual censuses were made during multilevel scuba dives (two or three depths per dive and two or three dives per day) by a team of two divers. At each depth, at a haphazardly chosen point, the first diver stretched a 30 m-long measuring tape parallel to the wall, keeping depth constant. Once half of the tape had been stretched, the second diver began to count all fish observed within a band 1 m wide (in the shallowest horizontal zone) or high (in the deeper wall) on both sides of the tape, while swimming at a constant speed < 1 m away from the substrate, effectively conducting censuses within 30 x 2 m belt transects. Data were collected by the same observer to avoid inter-observer bias. Each census consisted of two runs in opposite directions along the same transect: in the first run the most conspicuous and mobile fish were recorded both on the bottom and in the water column, and in the second, small, sedentary or cryptic fish were counted on the substrate. The censuses were conducted between 8:00 and 16:00. Five replicates per depth for a total of 30 visual censuses were done. Pairs of vaguely similar species (i.e. Acanthurus tractus -A. chirurgus and Coryphoptherus personatus -C. hyalinus) were grouped and treated as a single taxon because occasionally some individuals were not identified to species (Alevizon et al., 1985; Reyes-Nivia et al., 2004).
To examine patterns of distribution and abundance of species along the depth gradient, we checked the pattern of variation of mean abundance along depth in the most abundant species. These data were analyzed with a one-way ANOVA to examine differences in mean abundance between depths. Because in most cases the abundance data did not meet assumptions of homoscedasticity and normality, the data were first transformed with the Box-Cox-transformation (Quinn and Keough, 2002). This transformation corrected variance heterogeneity in all cases and non-normality in eight out of nine cases. Tukey multiple comparison tests were performed when ANOVA results indicated significant differences in mean abundance between depths. We also performed a qualitative analysis of the vertical distribution of all species, classifying them according to the breadth and continuity of their vertical distribution. Finally, we examined the relationship between average abundance (considering only depths where a species was present; see Brown, 1984) and breadth of depth distribution among all species using linear regression. Breadth of distribution was simply determined as number of depth levels occupied so that we effectively described the abundance-occupancy relationship along depth (Brown, 1984; Gaston and Blackburn, 2000).
To examine patterns of species diversity (Magurran, 2004), the total number of individuals, species richness, Shannon-Wiener diversity, Simpson's dominance, and Pielou's evenness were estimated for each census using the software PAST 3.04 (Hammer et al., 2001). One-way analyses of variance (ANOVA) were performed to determine possible differences between levels of depth in each of these community attributes. Levene's tests indicated that in all cases the assumption of homogeneity of variances was fulfilled. The assumption of normality of residuals was examined by Shapiro-Wilk's tests and normal probability plots. This assumption was not met in the case of Simpson's dominance and Shannon-Wiener diversity. In these two cases, Kruskal-Wallis tests were performed to examine differences between depths and a posteriori multiple comparison tests were done following the method of Siegel and Castellan (1988). All ANOVAs and multiple comparisons were performed with Statistica 8.0 software (StatSoft, 2007). Finally, the fit of the distribution of total average species abundance to four species-abundance distribution models (geometric, logarithmic series, broken stick, and lognormal; Magurran, 2004) was also examined with PAST 3.04 (Hammer et al., 2001).
To examine the similarity of species assemblages between depths, we performed a non-metric Multi Dimensional Scaling analysis (nMDS) based on Bray-Curtis dissimilarity calculated from the untransformed species abundance data obtained from each census (McCune and Grace, 2002). The goodness of fit of the final configuration was evaluated by Kruskal's stress. To find the overall final solution, we used 100 random starts, thus avoiding local minima. We used the fewest possible dimensions (2) for which the final solution was more stable and with an acceptable level of stress (< 0.2). These analyses were performed using the R-3.1.2 platform (R Core Team, 2014) and R packages Vegan (Oksanen et al., 2010), EcoDist (Goslee and Urban, 2007), and Ellipse (Murdoch and Chow, 2007). The nMDS analysis was complemented, using the program PAST 3.04 (Hammer et al., 2001), with an analysis of similarities (ANOSIM; Clarke, 1993) to detect differences between assemblages at each depth and an analysis of percent similarity (SIMPER; Clarke, 1993) to examine which species were responsible for those differences.
RESULTS
A total of 2916 individuals belonging to 46 species in 21 families were recorded within transects at Blue Wall (Table 1). Ten other species were observed outside the transects and were considered for the estimate of total species richness (56 species) but excluded from all other statistical analyses (Table 1). At the reef terrace, individuals of the shark Carcharhinus sp. were observed, but they were not included in the total species count because they were observed at 40 m, outside the depth range considered in this study.
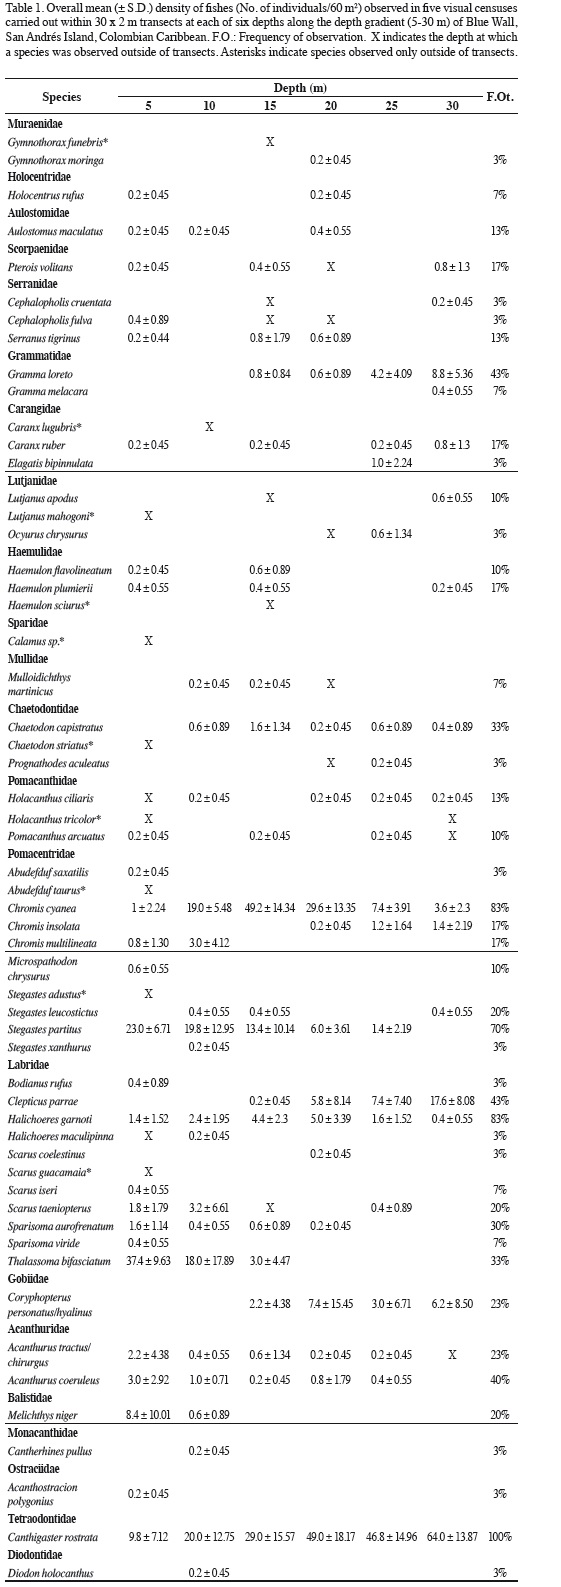
Based on overall average density, nine species represented 92% of the total fish abundance along the depth gradient (Table 1). Canthigaster rostrata was the most abundant species (37.4%), followed by Chromis cyanea (18.8%), Stegastes partitus (10.9%), Thalassoma bifasciatum (10.0%), Clepticus parrae (5.3%), Coryphopterus personatus/hyalinus (3.2%), Halichoeres garnoti (2.6%), Gramma loreto (2.4%), and Melichthys niger (1.5%). These species were observed with frequencies ranging between 20 and 100% of all censuses made (Table 1). The observed species abundance-distribution did not fit any of the four models examined (Geometric, Logarithmic Series, Broken Stick, and Log-Normal), and indeed the distribution was more uneven than expected from the geometric model. Among the rare species, 14 were seen only once in the entire study and 17 had only one or two individuals. The families richest in species were Labridae (including Scarinae, 11 species) and Pomacentridae (10 species). The families Serranidae, Carangidae, Lutjanidae, Haemulidae, Chaetodontidae, and Pomacanthidae had three species each and Muraenidae, Grammatidae, and Acanthuridae had two species each. Twelve families had only one species each (Table 1).
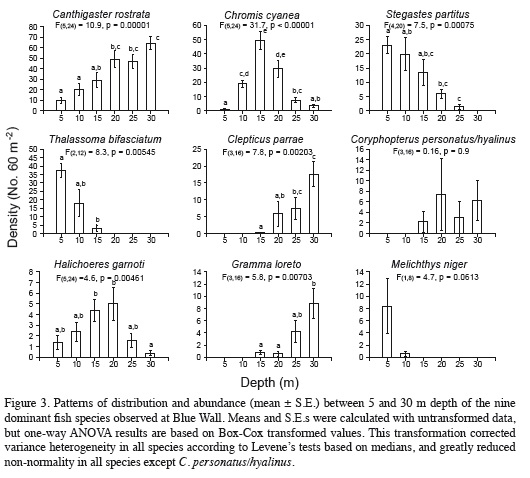
The abundance of the dominant species, except Coryphopterus personatus/hyalinus and Melichthys niger, varied clearly and significantly with depth (Figure 3). These seven species showed different patterns of variation, with abundance peaks in different parts of depth gradient (Figure.3). In some species density increased as depth increased. Such was the case of Canthigaster rostrata, Clepticus parrae, and Gramma loreto, which reached their peak abundance at 30 m. In other species, such as Stegastes partitus and Thalassoma bifasciatum, average density decreased with increasing depth, and exhibited maximum values at 5 m. The remaining species (Chromis cyanea and Halichoeres garnoti) had higher densities at intermediate depths (15 and 20 m, respectively; Table 2, Figure 3).
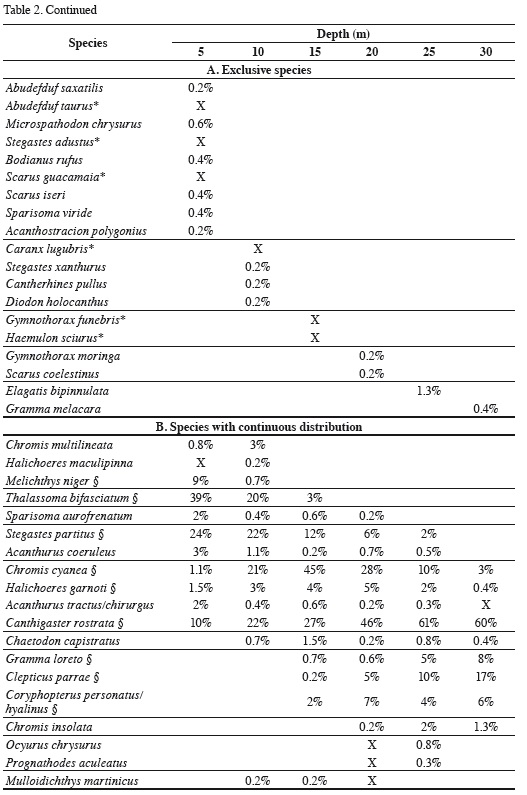
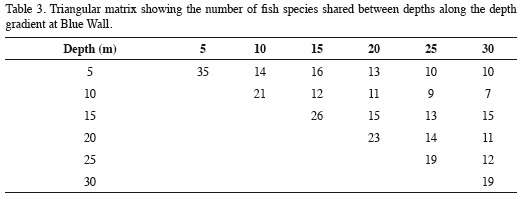
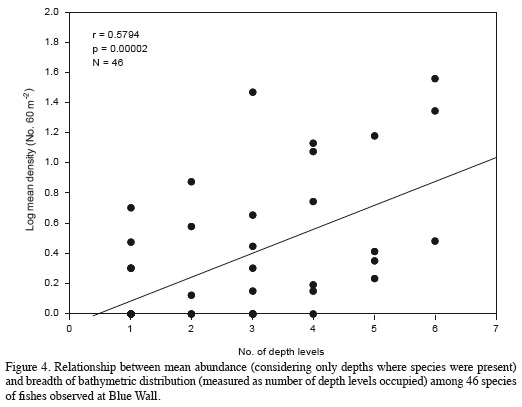
The depth distribution of the species observed at Blue Wall, including those observed outside of transects, is presented in Table 2. Twenty-two species were limited to a single depth, so they are referred to as "exclusive species". These species were generally rare, characterized by having an average relative abundance < 1.5% and a low frequency of observation; some of them were observed only once in the entire study. The reef flat (5 m) was the zone with the highest number of exclusive species (12 species), followed by the 10 m depth (4 species), the 15 and 20 m depths (2 species) and finally the 25 and 30 m depths (1 species each; Table 2). Additionally, 19 species showed a continuous vertical distribution, that is, they were found within at least two adjacent depths with well-defined upper and lower limits of vertical distribution (Table 2). Of these, 15 species were observed in two to five consecutive depths, while the remaining four (Chromis cyanea, Halichoeres garnoti, Acanthurus tractus/chirurgus, and Canthigaster rostrata) were ubiquitous (occurredat all depths along the entire depth gradient examined; Table 2). Nine of these 19 species with continuous distributions were the same numerically dominant species mentioned above (Figure 3). Finally, 15 species had disjunct distributions, i.e. they were observed at different but not adjacent depths. Regarding species observed at more than one depth, the 15 m depth shared the most species with other depths, 16 with the 5 m depth and 15 with the 5 and 20 m depths. In contrast, the 10 m depthshared the fewest species; only seven and nine species with the 30 and 25 m depths, respectively (Table 3). In general, there was a highly significant positive relationship between overall average abundance and the breadth of the bathymetric distribution measured as the number of depth levels occupied (Figure 4).
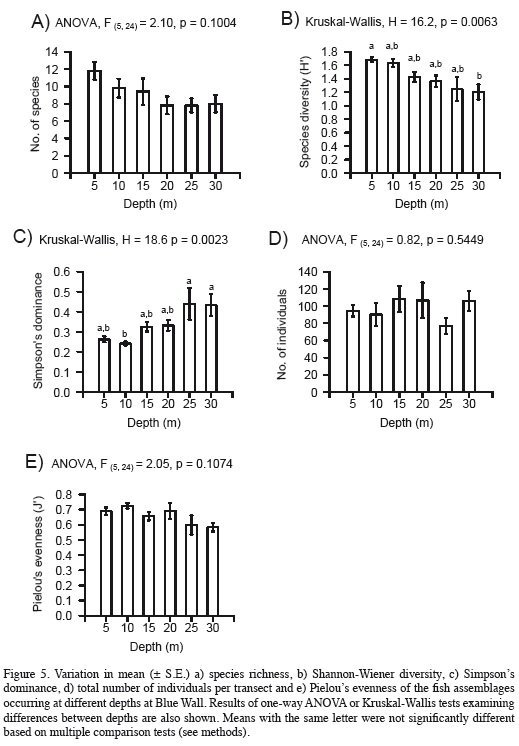
Total species richness was highest at 5 m (35 species), followed by the intermediate depth of 15 m (26 species), while it was lowest at the deepest depths of 25 and 30 m (19 species each). However, average species richness did not vary significantly with depth, although it exhibited a decreasing trend with increasing depth (Figure 5a). Nonetheless, Shannon-Wiener diversity decreased and Simpson's dominance increased significantly with increasing depth (Figures 5b, c). However, significant differences occurred only between depths at opposite ends of the gradient examined (between 5 and 30 m for diversity, and between 10 and 25 or 30 m for dominance). Finally, the mean total number of individuals per transect did not show any trend with changing depth (Figure 5e).
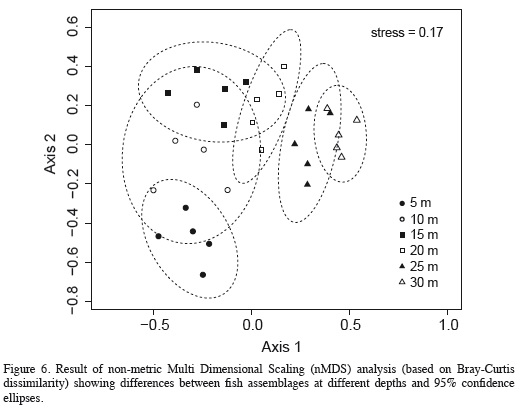
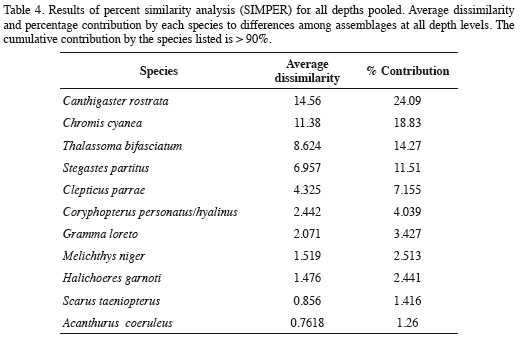
The nMDS revealed a high degree of structure of the fish assemblage along the depth gradient (Figure 6). Assemblages observed at 5-15 m segregated along the vertical axis, while those documented at 20-30 m segregated along the horizontal axis of the nMDS plot (Figure 6). The ANOSIM indicated the existence of significantly different assemblages between depths (R = 0.683, p = 0.0001), and although Figure 6 suggests an apparent transition zone with some overlap between the assemblages at 10, 15 and 20 m, ANOSIM comparisons between pairs of depths were all significant (p < 0.038) except between the depths of 20 m and 25 (R = 0.196, p = 0.074) and between 25 and 30 m (R = 0.152, p = 0.13). In fact, the major differences between adjacent depths were between 5 to 10 m (R = 0.472, p = 0.015), 10 and 15 m (R = 0.498, p = 0.023) and 15 and 20 m (R = 0.284, p = 0.038). Results of the SIMPER analysis indicated that the species that contributed the most to differences between the assemblages observed at different depths were the nine dominant species previously mentioned, nearly in the same order as their relative abundance (Table 4). Based on pairwise SIMPER analyses between adjacent depths, Chromis cyanea made the greatest contribution to differences between 10-15, 15-20, and 20-25 m depths, while Thalassoma bifasciatum was the largest contributor to differences between 5 and 10 m depth, and Canthigaster rostrata to differences between 25 and 30 m depth.
DISCUSSION
In this study we found evidence for the existence of a pattern of zonation in a Caribbean coral-reef-fish assemblage along a depth gradient at a reef wall. The composition and abundance of species varied significantly with depth resulting in distinctive assemblages at different depths. Although at the individual species level clear patterns of variation in abundance with depth were observed (at least in most of the dominant species examined), at the community level only attributes that simultaneously integrate both species richness and evenness, such as diversity and dominance, varied significantly with depth, albeit weakly, while other community properties, such as species richness and total abundance, did not.
The taxonomic composition of the fish community at Blue Wall is similar to that documented in southwestern Caribbean coral reefs, and seven of the dominant species at Blue Wall have also been documented as dominant in different habitats of this region (Victoria and Gómez, 1984; Gómez and Victoria, 1986; Mejía et al., 1998; Reyes-Nivia et al., 2004). For instance, Chromis cyanea, Stegastes partitus, Thalassoma bifasciatum, Clepticus parrae, and Gramma loreto were the most abundant species in the four physiographic zones (peripheral windward reef, lagoon reefs, leeward terrace, and windward terrace) surveyed by Mejía and Garzón-Ferreira (2000) on the cays and banks of San Andrés and Providencia. Similarly, Bolaños (2005) found that in monitoring stations around the island of San Andrés, Coryphopterus personatus and Halichoeres garnoti, together with the species just mentioned, were among the 10 dominant species. In other ecoregions adjacent to the southwestern Caribbean similar results have been obtained: in the Lesser Antilles, Bouchon-Navaro et al. (2005) found that H. garnoti, S. partitus, and C. cyanea were among the species characteristic of outer reef slopes. Dominant species across a 15 - 50 m depth gradient in Puerto Rico include C. cyanea, C. personatus, S. partitus, T. bifasciatum, and G. loreto. The dominant species of coral reef banks in the northwestern Gulf of Mexico (T. bifasciatum and C. parrae) are also dominant on outer reef slopes of Caribbean reefs (Dennis and Bright, 1988). It has been reported that on reef slopes or deep sites in contact with ocean currents, as in Blue Wall, a few planktivorous species with high abundance or biomass are observed (Williams and Hatcher, 1983). This coincides with the findings in this and at least one other study in the Caribbean (García-Sais, 2010) since some of the dominant species at intermediate or greater depths are planktivores (e.g. C. cyanea and C. parrae; Robertson and Van Tassell, 2015). This has been explained in terms of food availability, because plankton is more abundant at sites adjacent to deep water where upwelling of nutrient-rich water often occurs (Edwards and Roswell, 1981; Williams and Hatcher, 1983; Friedlander and Parrish, 1998; Mejía and Garzón-Ferreira, 2000).
The fact that Canthigaster rostrata was the most abundant species in this study is intriguing, particularly because it had not been recorded as dominant in previous works in San Andrés or elsewhere in the Caribbean. Although this species is common and characteristic of reef areas that are densely populated by sea fans, sea whips and fire coral, such as reef walls (Böhlke and Chaplin, 1993), this does not explain its dominance at Blue Wall. The unusually high abundance of C. rostrata in this study could be due to the fact that species of Canthigaster have large population fluctuations with occasional population explosions, which has been previously documented for C. rostrata (Jordán-Garza et al., 2009) as well as for C. bennetti from the Indo-Pacific (Vail and Sinclair-Taylor, 2011). Population explosions of C. rostrata were observed in San Andrés as well as in other localities in Costa Rica and Panamá in August 2013 (Nacor Bolaños. Coralina. San Andrés, Colombia. 2013. Pers. Com.), and in the Santa Marta area, on the Colombian Caribbean continental coast, in November 2014 (F.A. Zapata, Pers. Obs.). It is therefore possible that the abundance of C. rostrata at Blue Wall had already begun to increase in 2011, when this study was done, as part of the population explosion event whose peak was observed in 2013 in San Andrés.
As it is the norm in biological communities (Magurran, 2004), the pattern of variation in abundance among species observed at Blue Wall shows few abundant species and many rare ones. In diverse communities, such as those inhabiting coral reefs, the distribution of abundance among species usually follows a log-normal pattern (Zapata and Morales, 1997; Jones et al., 2002; Connolly et al., 2005; MacNeil and Connolly, 2015). However, this was not the case in the fish community of Blue Wall. The fact that 92% of individuals belonged to only nine species shows an unusual pattern, with an abundance distribution even less equitable than a geometric distribution. This result is intriguing because geometric distributions often occur in species-poor communities in extreme or disturbed environments (Magurran, 2004) and such does not seem to be the case at Blue Wall. Furthermore, total abundance and species richness at Blue Wall were low in comparison to a study in Puerto Rico in which sampling effort was similar (García-Sais, 2010). In that study, 7841 individuals from 80 species were observed in 30 visual censuses made in 30 m2 belt transects, and 39 additional species were observed outside of transects for a total of more than twice the total species richness observed at Blue Wall. Recent analyses indicate that a simplification of Caribbean reef fish assemblages has occurred as a result of the continued deterioration of coral reefs in the region (Álvarez-Filip et al., 2009, 2015; Paddack et al., 2009). Whether this is the case at Blue Wall requires more detailed analysis, although we do not know of historical data to make a rigorous comparison. Nonetheless, some support for this idea is provided by the scarcity of top predators or otherwise large fishes at Blue Wall.
Several patterns of intraspecific variation in abundance along depth were observed in this study even though we focused on a few, dominant species. Some species were much more abundant in the shallow zone, others at intermediate depths and still others in the deep zone of the reef wall. Such variation was similar to that observed by Harmelin-Vivien (1977) in Madagascar and by Edwards and Rosewell (1981) in the Sudanese Red Sea, although they documented variation in species abundance along vertical and horizontal gradients combined. In contrast, in this study we documented variation mostly along depth. Some species (Chromis cyanea and Halichoeres garnoti) showed the intraspecific pattern of variation in abundance that has been long expected to occur along environmental gradients: an abundance peak in the center of distribution and a symmetric decline towards the ends of the gradient (this has also been termed the 'abundant centre' hypothesis; Brown, 1984; Brown et al., 1995; Sagarin and Gaines, 2002). Species that show an increase in abundance with increasing depth (Canthigaster rostrata, Clepticus parrae, and Gramma loreto) either do not conform to the above hypothesis or their distribution extends to greater depths than examined here. On the other hand, it is difficult to reconcile the 'abundant centre' hypothesis with the pattern observed in Stegastes partitus, Thalassoma bifasciatum, and Melichthys niger, in which abundance peaked in the shallowest zone and declined with increasing depth. Nonetheless, proponents of the 'abundant centre' hypothesis consider that this pattern occurs when species reach their highest densities near one end of the gradient, so that a tail of the distribution is absent (Brown, 1984; Brown et al., 1995). Interestingly, patterns of vertical variation in abundance in a given species are not necessarily consistent among studies. For instance, Coryphopterus personatus and T. bifasciatum in Puerto Rico showed similar patterns to those observed in this study, while G. loreto did not (García-Sais, 2010).
There was also much variation among species in the patterns of vertical distribution. Clearly, some species were confined to particular sections of the depth gradient while others were widely distributed. In some cases, restricted and disjunct distributions can be explained by limited sampling at each depth. In other cases, restricted distributions are possibly due to limited tolerance to physical environmental factors or to interactions with other species (McGehee, 1994). It is also likely that some species have narrow habitat requirements, finely dividing the living space available so that each species uses a slightly different portion of space (Sale, 1977; Williams, 1991). In contrast, ubiquitous species do not seem to be affected by any environmental factor that covaries with depth, and appear to be generalists in the sense that different species have similar ecological needs and can coexist in the same habitats (Mejía and Garzón-Ferreira, 2000; Aburto-Oropeza and Balart, 2001).
Abundance and distribution are intrinsically related, so abundant species often have wide distributions, while rare ones have restricted distributions (Brown, 1984). Such was the case in this study: species with higher average abundances were also more widely distributed along the depth gradient and there was a significant positive relationship between abundance and breadth of vertical distribution. A positive relationship between distribution and abundance has been widely documented in various organisms at different scales, from geographic to local, and along various spatial gradients (Brown, 1984; 1995; Gaston and Blackburn, 2000; Gaston, 2003; Blackburn et al., 2006). However, to our knowledge, this is the first report of a positive correlation between abundance and breadth of bathymetric distribution in marine reef fishes. Previous analyses have examined whether there is a relationship between breadth of geographic distribution and species abundance, but a positive relationship has rarely been documented in marine fishes (e.g. Frisk et al., 2011) and particularly not in coral reef fishes (Jones et al., 2002; Pratchett et al., 2008) although it has in rocky reef fishes (Zapata, 1990).
We found evidence that distinct fish assemblages occur at different depths at Blue Wall, even though sampling intervals, every 5 m along depth, were chosen arbitrarily and a priori. In this regard, our results are remarkably similar to those found in two other studies focusing on patterns of variation in assemblage structure along depth (Brokovich et al., 2008; García-Sais, 2010). This suggests the existence of some structural order along the depth gradient at the spatial scale analyzed. However, in other aspects, patterns observed in this study did not fully agree with those observed in previous studies. For instance, in most studies assemblages from intermediate depths were less distinctive (had greater similarity) between adjacent depths, because intermediate depths represent an area of species turnover between shallow and deep assemblages (Harmelin-Vivien, 1977). In contrast, another study documented an increase in species turnover with increasing depth (Brokovich et al., 2008). Although in this study the nMDS plot suggested some overlap between assemblages at intermediate depths (10, 15 and 20 m), the ANOSIM showed a greater similarity between the deeper assemblages (20 to 25 m and 25 to 30 m) than between the shallower ones. In fact, differences between assemblages from adjacent depths were greater in shallow areas and decreased with increasing depth, suggesting greater species turnover in shallow than in deep areas.
At Blue Wall, differences between the shallowest assemblage (5 m) and deeper ones may be partly explained by differences in substrate orientation. Even though the shallowest zone was at the edge of the reef wall, it was oriented horizontally while the substrate in deeper zones had a vertical orientation. Furthermore, at Blue Wall species richness and diversity declined with increasing depth. Here, shallow assemblages not only had higher total and average species richness and Shannon-Winer diversity, but had more exclusive species. This contrasts with other studies in which diversity was highest either at intermediate depths (Harmelin-Vivien, 1977) or towards the deeper end of the gradient (Edwards and Rosewell, 1981; Zapata and Morales, 1997; Friedlander and Parrish, 1998). However, these studies described variation simultaneously across horizontal and vertical gradients and may not be strictly comparable with the present study. In contrast, two studies focusing on variation along depth found that species richness peaked at mid-depths (Brokovich et al., 2008; García-Sais, 2010).
This study documented clear patterns of distribution and abundance, and the occurrence of distinct assemblages of coral reef fishes along a steep depth gradient. A next step is to examine the extent to which the patterns documented are determined by physical or biological factors or their combination. One question is whether the structure of fish assemblages is determined by habitat structure. In general, previous studies have associated the vertical zonation of fish assemblages with the natural zonation of sessile organisms, such as corals and algae, which make up the substrate and provide habitat structure (e.g. Harmelin-Vivien, 1977; Brokovich et al., 2008; García-Sais, 2010). Although the lower limit of the deep zone assemblage in this study was arbitrarily set at 30 m, other studies suggest that the depth limit of the coral-reef-fish assemblage on outer reef slopes or vertical reef habitats follows the limits of coral reef growth. For example, in the Gulf of Mexico the depth limit of the typical reef-fish fauna is 45 m, below which different habitats are found, such as the algae and sponge zone, followed by the deeper antipatharian zone (Dennis and Bright, 1988). Fish assemblage structure has been found to correlate with habitat structure supporting the idea that changes in fish assemblages along depth are due to changes in habitat (Brokovich et al., 2008; García-Sais, 2010). Another question concerns the role that food availability and trophic ecology might play in explaining the observed patterns given the dominance of planktivores on reef slopes. Finally, interspecific interactions such as competition and predation can also be important in determining patterns of distribution, abundance and zonation (Williams, 1991). For instance, there is strong evidence that patterns of segregation along depth between pairs of similar species are the result of competitive interactions (Hixon, 1980; Larson, 1980). Although results of this study must be considered as preliminary due to the limited sampling, we believe that reef walls are excellent habitats to document patterns of distribution, abundance and diversity along environmental gradients, and to test hypotheses regarding the processes responsible for the organization of coral reef fish assemblages.
ACKNOWLEDGMENTS
We are grateful for the logistical support provided by Universidad del Valle, the Institute of Marine and Coastal Research (INVEMAR) and the Corporation for the Sustainable Development of the Archipelago of San Andrés and Providencia (CORALINA), and particularly the staff from these entities that supported and helped conducting this research, especially Elizabeth Taylor Jay and Nacor Bolaños Cubillos. We also thank Carlos Álvaro Molina, who supported the fieldwork and served as safety diver, and Héctor Guzmán of STRI (Panama) for his initial recommendations, and P.C. Sierra, J.J. Pizarro, F. Valencia and the Laboratory of Information Services at Invemar for the map of San Andrés used in Figure 1. Finally, we thank A. Acero and an anonymous reviewer for comments that helped improve an earlier manuscript.
LITERATURE CITED
Aburto-Oropeza, O. and E. Balart. 2001. Community structure of reef fish in several habitats of a rocky reef in the Gulf of California. Mar. Ecol., 22: 283-305. [ Links ]
Alevizon, W., R. Richardson, P. Pitts and G. Serviss. 1985. Coral zonation and patterns of community structure in Bahamian reef fishes. Bull. Mar. Sci., 36: 304-318. [ Links ]
Álvarez-Filip, L., N.K. Dulvy, J.A. Gill, I.M. Côté and A. R. Watkinson. 2009. Flattening of Caribbean coral reefs: region wide declines in architectural complexity. Proc. R. Soc. Biol. Sci., 276: 3019-3025. [ Links ]
Álvarez-Filip, L., M.J. Paddack, B. Collen, D.R. Robertson and I.M. Côté. 2015. Simplification of Caribbean reef-fish assemblages over decades of coral reef degradation. PLoS ONE, 10: e0126004. doi:10.1371/journal.pone.0126004. [ Links ]
Begon, M., C. Townsend and J. Harper. 2006. Ecology: from individuals to ecosystems. 4th edition. Blackwell Publishing, Malden, USA. 738 p. [ Links ]
Blackburn, T.M., P. Cassey and K.J. Gaston. 2006. Variations on a theme: sources of heterogeneity in the form of the interspecific relationship between abundance and distribution. J. Anim. Ecol., 75: 1426-1439. [ Links ]
Blanchon, P. 2011. Geomorphic zonation. 469-486. In: Hopley, D. (Ed.). Encyclopedia of modern coral reefs: structure, form and process. Encyclopedia of earth sciences series. Springer, Dordrecht, Netherlands. 1205 p. [ Links ]
Böhlke, J. and C. Chaplin. 1993. Fishes of the Bahamas and adjacent tropical waters. 2nd edition, Univ. Texas Press, Austin. 771 p. [ Links ]
Bolaños, N. 2005. Variaciones espaciales y temporales en la estructura de la comunidad de peces arrecifales de la isla de San Andrés y su relación con el estado de los arrecifes. Tesis Biol., Univ. Valle, Cali. 132 p. [ Links ]
Bouchon-Navaro, Y., C. Bouchon, M. Louis and P. Legendre. 2005. Biogeographic patterns of coastal fish assemblages in the West Indies. J. Exp. Mar. Biol. Ecol., 315: 31-47. [ Links ]
Brokovich, E., S. Einbinder, N. Shashar, M. Kiflawi and S. Kark. 2008. Descending to the twilight-zone: Changes in coral reef fish assemblages along a depth gradient down to 65 m. Mar. Ecol. Prog. Ser., 371: 253-262. [ Links ]
Brown, J.H. 1984. On the relationship between abundance and distribution of species. Am. Nat., 124: 255-279. [ Links ]
Brown, J.H. 1995. Macroecology. The University of Chicago Press, Chicago. 269 p. [ Links ]
Brown, J.H., D. Mehlman and G. Stevens. 1995. Spatial variation in abundance. Ecology, 76: 2028-2043. [ Links ]
Clarke, K.R. 1993. Non-parametric multivariate analysis of changes in community structure. Aust. J. Ecol., 18:117-143. [ Links ]
Connolly, S.R., T.P. Hughes, D.R. Bellwood and R.H. Karlson. 2005. Community structure of corals and reef fishes at multiple scales. Science, 309: 1363-1365. [ Links ]
Dennis, G. and T. Bright. 1988. Reef fish assemblages on hard banks in the northwestern Gulf of Mexico. Bull. Mar. Sci., 43: 280-307. [ Links ]
Díaz, J. 2005. Esquemas espaciales de zonación ecológica y morfología de las lagunas de los atolones y complejos arrecifales de un archipiélago oceánico del Caribe: San Andrés y Providencia (Colombia). Rev. Acad. Colomb. Cienc., 29: 357-369. [ Links ]
Edwards, A. and J. Rosewell. 1981. Vertical zonation of coral reef fishes in the Sudanese Red Sea. Hydrobiology, 79: 21-31. [ Links ]
Friedlander, A. and J. Parrish. 1998. Habitat characteristics affecting fish assemblages on a Hawaiian coral reef. J. Exp. Mar. Biol. Ecol., 224: 1-30. [ Links ]
Frisk, M.G., D.E. Duplisea and V.M. Trenkel. 2011. Exploring the abundance-occupancy relationships for the Georges Bank finfish and shellfish community from 1963 to 2006. Ecol. Appl., 21: 227-240. [ Links ]
Galzin, R. 1987. Structure of fish communities of French Polynesian coral reefs. I. Spatial scales. Mar. Ecol. Prog. Ser., 41: 129-136. [ Links ]
Galzin, R. and P. Legendre. 1987. The fish communities of a coral reef transect. Pac. Sci., 41: 158-165. [ Links ]
García-Sais, J.R. 2010. Reef habitats and associated sessile-benthic and fish assemblages across a euphotic-mesophotic depth gradient in Isla Desecheo, Puerto Rico. Coral Reefs, 29: 277-288. [ Links ]
Gaston, K.J. 2003. The structure and dynamics of geographic ranges. Oxford University Press, Oxford. 266 p. [ Links ]
Gaston, K.J. and T.M. Blackburn. 2000. Macroecology. Blackwell Science, Oxford. 377 p. [ Links ]
Geister, J. and J. Díaz. 1997. A field guide to the oceanic barrier reefs and atolls of the Southwestern Caribbean (Archipelago of San Andrés and Providencia, Colombia). Proc. 8th Int. Coral Reef Symp., 1: 235-262. [ Links ]
Gómez, D. and P. Victoria. 1986. Peces de la isla de San Andrés y noreste de la isla de Providencia (mar Caribe de Colombia). Inventario en arrecifes coralinos, praderas marinas y aguas costeras. Bol. Ecotrópica Ecos. Trop., 13: 41-85. [ Links ]
Goreau, T. and N. Goreau. 1973. The ecology of Jamaican coral reefs. II. Geomorphology, zonation, and sedimentary phases. Bull. Mar. Sci., 23: 399-464. [ Links ]
Goslee, S.C. and D.L. Urban. 2007. The ecodist package for dissimilarity-based analysis of ecological data. J. Stat. Software, 22: 1-19. [ Links ]
Gosline, W. 1965. Vertical zonation of inshore fishes in the upper water layers of the Hawaiian Islands. Ecology, 46: 823-831. [ Links ]
Guilcher, A. 1988. Coral reef geomorphology. J. Wiley & Sons, New York. 228 p. [ Links ]
Hammer, Q., D. Harper and D. Ryan. 2001. PAST: Palaeontological statistics software package for education and data analysis. Palaeontol. Electron., 4: 1-9. [ Links ]
Harmelin-Vivien, M. 1977. Ecological distribution of fishes on the outer slope of Tulear reef (Madagascar). Proc. 3rd Int. Coral Reef Symp., 1: 289-295. [ Links ]
Hiatt, R. and D. Strasburg. 1960. Ecological relationships of the fish fauna of coral reefs of the Marshall Islands. Ecol. Monogr., 30: 65-127. [ Links ]
Hixon, M.A. 1980. Competitive interactions between California reef fishes of the genus Embiotoca. Ecology 61: 918-931. [ Links ]
Jones, G.P., M.J. Caley and P.L. Munday. 2002. Rarity in coral reef fish communities. 81-101. In: Sale, P.F. (Ed.). Coral reef fishes: dynamics and diversity in a complex ecosystem. Academic Press, Amsterdam. 549 p. [ Links ]
Jordán-Garza, A., E. Díaz-Almeyda, R. Iglesias-Prieto, M. Maldonado and J. Ortega. 2009. Mass mortality of Canthigaster rostrata at the northeast coast of the Yucatan Peninsula. Coral Reefs, 28: 661. [ Links ]
Krebs, C. 2001. Ecology: the experimental analysis of distribution and abundance. 5th edition, Benjamin-Cummings Publishing Company, San Francisco. 695 p. [ Links ]
Larson, R.J. 1980. Competition, habitat selection, and the bathymetric segregation of two rockfish (Sebastes) species. Ecol. Monogr., 50: 221-239. [ Links ]
Levinton, J. 1982. Marine ecology. Prentice-Hall, Inc., Englewood Cliffs, USA. 526 p. [ Links ]
MacNeil, M.A. and S.R. Connolly. 2015. Multi-scale patterns and processes in reef fish abundance. 116-124. In: Mora, C. (Ed.). The ecology of fishes on coral reefs. Cambridge University Press, Cambridge. 370 p. [ Links ]
Magurran, A. 2004. Measuring biological diversity. Blackwell Publishing, Oxford, England. 256 p. [ Links ]
McCune, B. y J.B. Grace. 2002. Analysis of ecological communities. MjM Software Design, Gleneden Beach, USA. 300 p. [ Links ]
McGehee, A. 1994. Correspondence between assemblages of coral reef fishes and gradients of water motion, depth and substrate size of Puerto Rico. Mar. Ecol. Prog. Ser., 105: 243-255. [ Links ]
Mejía, L. and J. Garzón-Ferreira. 2000. Estructura de comunidades de peces arrecifales en cuatro atolones del archipiélago de San Andrés y Providencia (Caribe sur occidental). Rev. Biol. Trop., 48: 883-896. [ Links ]
Mejía, L., J. Garzón-Ferreira and A. Acero P. 1998. Peces registrados en los complejos arrecifales de los cayos Courtown, Albuquerque y los bancos de Serrana y Roncador, Caribe occidental, Colombia. Bol. Ecotrópica Ecos. Trop., 32: 25-42. [ Links ]
Murdoch, D. and E.D. Chow. 2007. Ellipse: functions for drawing ellipses and ellipse-like confidence regions. R package version 0.3-5. [ Links ]
Oksanen, J., F.G. Blanchet, R. Kind, P. Legendre, R.B. O'Hara, G.L. Simpson, P. Solandmos, M. Henry, H. Stevens and H. Wagner. 2010. Vegan: community ecology package. R package version 1.17-3. [ Links ]
Paddack, M.J., J.D. Reynolds, C. Aguilar, R.S. Appeldoorn, J. Beets, E.W. Burkett, P.M. Chittaro, K. Clarke, R. Esteves, A.C. Fonseca, G.E. Forrester, A.M. Friedlander, J. García-Sais, G. González-Sansón, L.K.B. Jordan, D.B. McClellan, M.W. Miller, P.P. Molloy, P.J. Mumby, I. Nagelkerken, M. Nemeth, R. Navas-Camacho, J. Pitt, N.V.C. Polunin, M.C. Reyes-Nivia, D.R. Robertson, A. Rodríguez-Ramírez, E. Salas, S.R. Smith, R.E. Spieler, M.A. Steele, I.D. Williams, C.L. Wormald, A.R. Watkinson and I. M. Côté. 2009. Recent region-wide declines in Caribbean reef fish abundance. Curr. Biol., 19: 590-595. [ Links ]
Pratchett, M.S., P.L. Munday, S.K. WilsoN, N.A.J. GrahaM, J.E. Cinner, D.R. Bellwood, G.P. Jones, N.V.C. Polunin and T.R. McClanahan. 2008. Effects of climate-induced coral bleaching on coral reef fishes - ecological and economic consequences. Oceanogr. Mar. Biol., 46: 251-296. [ Links ]
Quinn, G.P. and M.J. Keough. 2002. Experimental design and data analysis for biologists. Cambridge University Press, Cambridge. 537 p. [ Links ]
R Core Team. 2014. R: A language and environment for statistical computing. R Foundation for Statistical Computing, Vienna. ISBN 3-900051-07-0, URL http://www.R-project.org/. [ Links ]
Reyes-Nivia, M., A. Rodríguez-Ramírez and J. Garzón-Ferreira. 2004. Peces asociados a formaciones coralinas de cinco áreas del Caribe colombiano: listado de especies y primeros registros para las áreas. Bol. Invest. Mar. Cost., 33: 101-114. [ Links ]
Roberts, C. and R. Ormond. 1987. Habitat complexity and coral reef fish diversity and abundance on Red Sea fringing reefs. Mar. Ecol. Prog. Ser., 41: 1-8. [ Links ]
Robertson, D.R. and J. Van Tassell. 2015. Shorefishes of the Greater Caribbean: online information system. Version 1.0 Smithsonian Tropical Research Institute, Balboa, Panamá. http://biogeodb.stri.si.edu/caribbean/en/pages. 04/04/2015. [ Links ]
Russ, G. 1984. Distribution and abundance of herbivorous grazing fishes in the central Great Barrier Reef. II. Patterns of zonation of mid-shelf and outer-shelf. Mar. Ecol. Prog. Ser., 20: 35-44. [ Links ]
Sagarin, R.D. and S.D. Gaines. 2002. The 'abundant centre' distribution: to what extent is it a biogeographical rule? Ecol. Lett., 5: 137-147. [ Links ]
Sale, P. 1977. Maintenance of high diversity in coral reef fish communities. Am. Nat., 111: 337-359. [ Links ]
Sale, P. 2002. Coral reef fishes: dynamics and diversity in a complex ecosystem. Academic Press, San Diego. 549 p. [ Links ]
Sheppard, C. 1980. Coral cover zonation and diversity on reef slopes of Chagos Atolls and population structures of the major species. Mar. Ecol. Prog. Ser., 2: 193-205. [ Links ]
Sheppard, C., S. Davy and G. Pilling. 2009. The biology of coral reefs. Oxford University Press, New York. 339 p. [ Links ]
Siegel, S. and N.J. Castellan. 1988. Nonparametric statistics for the behavioral sciences. 2nd edition, McGraw-Hill, New York. 399 p. [ Links ]
StatSoft, Inc. 2007. STATISTICA (data analysis software system), version 8.0. http://www.statsoft.com. [ Links ]
Vail, A. and T. Sinclair-Taylor. 2011. Mass schooling and mortality of Canthigaster bennetti in Sulawesi. Coral Reefs, 30: 251. [ Links ]
Victoria, P. and D. Gómez. 1984. Nuevos registros de peces para la isla de San Andrés (mar Caribe de Colombia). An. Inst. Inv. Mar. Punta Betín, 14: 115-132. [ Links ]
Wellington, G.M. 1982. Depth zonation in the Gulf of Panama: control and facilitation by resident reef fishes. Ecol. Monogr., 53: 223-241. [ Links ]
Williams, D. McB. 1991. Patterns and processes in the distribution of coral reef fishes. 437-474. In: Sale, P.F. (Ed.). The ecology of fishes on coral reefs. Academic Press, San Diego. 754 p. [ Links ]
Williams, D. McB. and A. Hatcher. 1983. Structure of fish communities on outer-slopes of inshore, midshelf and outer shelf reefs of the Great Barrier Reef. Mar. Ecol. Prog. Ser., 10: 23-34. [ Links ]
Zapata, F.A. 1990. Local and regional patterns of distribution and abundance in marine reef fishes. Ph.D. Dissertation, University of Arizona, Tucson. 177 p. [ Links ]
Zapata, F.A. and Y.A. Morales. 1997. Spatial and temporal patterns of fish diversity in a coral reef at Gorgona Island, Colombia. Proc. 8th Int. Coral Reef Symp., 1: 1029-1034. [ Links ]
RECEIVED: 21/04/2014 ACCEPTED: 20/12/2015

