


Serviços Personalizados
Journal
Artigo
 texto em
  Espanhol (pdf)
 Artigo em XML
 Referências do artigo
 Enviar este artigo por email
Indicadores
-
 Citado por SciELO
 -
 Acessos
Links relacionados
-
 Citado por Google
 -
 Similares em
SciELO
Similares em
SciELO -
 Similares em Google
Compartilhar

 Permalink
Boletín de Investigaciones Marinas y Costeras - INVEMAR
versão impressa ISSN 0122-9761
Bol. Invest. Mar. Cost. vol.46 no.2 Santa Marta jul./dez. 2017
https://doi.org/10.25268/bimc.invemar.2017.46.2.729
Research Articles
Analysis of the trophic state and microphytoplankton in the coastal zone of Guayas Province, Ecuador
1 Instituto Nacional de la Pesca. Letamendi 102 y la Ría. Guayaquil-Ecuador. mprado@institutopesca.gob.ec, jcajas@institutopesca.gob.ec
2 Investigador Prometeo Senescyt-Ecuador. Edificio Público del Sector Social, Planta Baja. Av. Plaza Dañin. Guayaquil, Ecuador. luis.troccoli@gmail.com
3 Instituto de Investigaciones Científicas, Universidad de Oriente. Boca de Río, Isla de Margarita-Venezuela.
Most fishing and aquaculture activity in Ecuador is concentrated in the Gulf of Guayaquil. However, the nutrient loads from anthropic activities could affect the water quality and the diversity of fishery resources. Surface water samples were collected to determine the temperature, salinity, dissolved oxygen, nutrients, and the community structure of microphytoplankton to determine the trophic status of the coastal zone and the inner estuary. In addition, the relation between the hydrographic variables was established through principal component analysis (PCA), and redundancy analysis (RDA) was used to analyze the effect of the environmental variables on the microphytoplankton communities. Differences in community structure were determined using multidimensional scaling analysis of similarities (MDS-Anosim), and the trophic status was established through the Karydis index. Significant differences were detected between the coastal zone and the inner estuary. Overall, the inner estuary showed a higher trophic level, with higher temperature and nutrient concentrations, and lower values for the salinity, transparency, and dissolved oxygen. Seventeen species of microphytoplankton were identified, of which 78% were diatoms, 18% dinoflagellates, 2% cyanophytes, and 2% silicoflagellates. Significant differences were detected in equitability and diversity, with fewer records in the estuarine area. The RDA showed a positive correlation (0.54; p <0.05) between Paralia sulcata, Thalassionema nitzschioides, Thalassionema frauenfeldii and nutrients and a negative correlation with salinity. In the inner estuary, Nitzschia longissima, Chaetoceros decipiens, and Skeletonema costatum were positively correlated (0.64; p <0.05) with temperature and negatively correlated with phosphate and nitrate. Differences in the community structure existed between zones, with S. costatum, T. frauenfeldii, and T. nitzschioides dominating the inner estuary and N. longissima, Guinardia striata, and Leptocylindrus danicus dominating in the coastal zone. The study area was determined to be mesotrophic. However, in the inner estuary, the values of the trophic index were higher because this area probably receives more directly the contributions from anthropic activities. Surveys with samples less than a mile from the coast are recommended to determine the trophic status in an area closer to the coast and to develop management plans to avoid threats of eutrophication.
Keywords: Gulf of Guayaquil; Estuary; Mesotrophic; Diatoms; Hydrographic variables
En el golfo de Guayaquil se concentra la mayor actividad pesquera y acuícola del Ecuador; sin embargo, la carga de nutrientes provenientes de actividades antrópicas, afectaría la calidad del agua y diversidad de recursos pesqueros. Con el propósito de determinar el estado trófico de la zona costera y estuario interior, se recolectaron muestras de agua superficial, para medir temperatura, salinidad, oxígeno disuelto, nutrientes y microfitoplancton. Además, se establecieron relaciones entre las variables hidrográficas mediante un Análisis de Componentes Principales (ACP) y entre éstas con el microfitoplancton a través del Análisis de Redundancia (ADR). Las diferencias en estructura comunitaria se determinaron mediante el Escalamiento Multidimensional no Métrico (MDS) y Análisis de Similaridad (ANOSIM), y el estado trófico empleando el índice Karydis. Se detectaron diferencias significativas entre la zona costera y estuario interior, registrando este último mayor temperatura y concentración de nutrientes, menor salinidad, transparencia, concentración de oxígeno disuelto y el nivel trófico más elevado. Se identificaron 178 especies de microfitoplancton, de las cuales 78% fueron diatomeas, 18% dinoflagelados, 2% cianofitas y 2% silicoflagelados. Se detectaron diferencias significativas en equitatividad y diversidad, con menores registros en la zona estuarina. El ADR mostró una correlación positiva (0.54; p<0.05) entre Paralia sulcata, Thalassionema nitzschioides, Thalassionema frauendeldianum con los nutrientes y negativa con salinidad. En el estuario interno se correlacionaron positivamente (0.64; p<0.05) Nitzschia longissima, Chaetoceros decipiens y Skeletonema costatum con temperatura y en forma inversa con fosfato y nitrato. Se registraron diferencias en la estructura comunitaria entre zonas, predominando S. costatum, T. fraunfeldianum y T. nitzschioides en el estuario interior y N. longissima, Guinardia striata y Leptocylindrus danicus en la zona costera. Se determinó a toda la zona de estudio como mesotrófica, no obstante, en el estuario interior los valores del índice trófico fueron más elevados debido probablemente a que recibe de manera más directa los aportes provenientes de actividades antrópicas. Se recomienda efectuar estudios con muestreos a una distancia menor a 1.8 km de la costa, para conocer el estado trófico en un área más cercana a la costa y desarrollar planes de manejo para evitar amenazas de eutrofización.
Palabras clave: Golfo de Guayaquil; Estuario; Mesotrófico; Diatomeas; Variables hidrográficas
INTRODUCTION
The role of estuaries regarding nutrient inputs to the coastal zone has been extensively studied because of its importance to energy transfer and fish production (Alpine and Cloern, 1992; Dutto et al., 2014; Nelson et al., 2015). This nutrient load is generated mainly by the increase in human populations and their activities in the coastal zones, which, when excessive, can lead to eutrophication and affect the quality and use of the resources of these ecosystems (Nixon, 1995; Cloern and Jassby, 2010; Paerl et al., 2014). To determine the trophic status of aquatic systems, indices have been established that reflect the level of deterioration of water quality, and these indices include factors such as nutrient concentration, water transparency, dissolved oxygen concentration, among others, and the effects of this deterioration on life such as phytoplankton, marine grasses, and macroalgae (Vollenweider, 1992; Birk et al., 2012). All indices are applied according to the feasibility of measuring various factors, including the Karydis index (1992), which is based mainly on the concentration of nutrients and has specificity for each one of them. In addition, this index is applied to various types of water, it is highly sensitive to the effects of eutrophication, and it is easy to apply. Initially, this index was established as a model for European waters, but it has been used successfully in the Americas, such as in the Gulf of Mexico (Herrera-Silveira et al., 2004; Tapia-González et al., 2008;Moreno et al., 2010).
The measurement of the trophic level is important for establishing the type of control and monitoring used in the management of ecosystems in short- and medium- term projects. In addition, the current trend suggests that investigations of the trophic status of the coastal zone should be accompanied by knowledge of the community structure of microphytoplankton because it is the community that best responds as an indicator of changes in coastal hydrography (Hays et al., 2005; Reynolds, 2006; Vinagre and Costa, 2014). Therefore, Tsirstis and Karydis (1998) indicated that phytoplankton diversity reacts to changes in the trophic level if polluted environments favor the growth of a few opportunistic species.
In Ecuador, 70% of the inland water bodies flow into the coastal zone (Rendón et al., 1983), with most of the country’s fishing and aquaculture activity concentrated in the Gulf of Guayaquil (San Martín, 2009). However, the nutrient load that comes from untreated wastewater of agricultural, livestock, domestic, industrial, and aquacultural origins gives water bodies their trophic characteristics, which affect the water quality and the diversity of the resources from which it develops. In this sense, studies on the hydrographic and biological characteristics of the coastal zone of Ecuador show spatial and temporal changes in the community structure of microphytoplankton in the Gulf of Guayaquil, where the dominance of halotolerant diatoms such as Paralia sulcata and Skeletonema costatum, and oceanic species, such as Rhizosolenia imbricata, Eucampia cornuta, Pseudonitzschia seriata and Guinardia striata, have been found in the coastal zone (Prado et al., 2015).
Regarding community structure and its relation to hydrographic conditions, studies have focused mainly on the influence of the water masses of the currents that dominate the Ecuadorian coast, such as the currents of Panama during the rainy season and Humboldt in the dry period, using temperature as an indicator and determining the absolute dominance of diatoms in both periods (Jiménez, 1983; Gualancañay et al., 2003, Coello et al., 2010; Prado and Cajas, 2010a, 2010b). Based on the studies on plankton and hydrographic conditions, carried out 1.8 km off the coast of the province of Guayas, the goal of this study is the determination of the trophic condition in the interior estuary of the Gulf of Guayaquil and adjacent coastal zone relative to the structure of the microphytoplankton.
STUDY AREA
Ecuador is a country with only two seasons: a rainy season from January to May and a dry season from July to November, whereas December and June are considered transitional months. The province of Guayas is in Southwest Ecuador and is influenced by several marine currents, especially the cold Humboldt current in the dry season and the warm El Niño current in the rainy season, producing a tropical savanna and tropical monsoon climate with average temperatures of 25°C and annual precipitation between 500 and 1000 mm (Twilley et al., 2001).
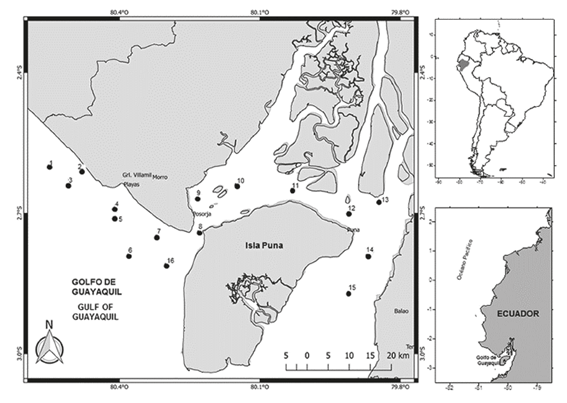
In the coastal zone of this province is the Gulf of Guayaquil (3°S, 80°W), in which an outer and an inner estuary have been established; the former has its limit in the platform along the meridian 81°W to the interior of the island Puná (80°15’W) in the mouths of the El Morro and Jambelí channels. The depth of the Gulf of Guayaquil on the continental shelf ranges from 180 m on the western edge to less than 20 m on the interior (Montaño-Armijos and Sanfeliu-Montolio, 2008).
The inland estuary is known as the Guayas River Estuary; to the northwest is the Salado Estuary, which receives sewage from the city of Guayaquil; and to the southeast lies the Churute Estuary, which receives the Taura and Churute rivers. A total of 24 hydrographic basins discharge into the Gulf of Guayaquil, with the Guayas River, which is formed by the confluence of Daule and Babahoyo (Twilley et al., 2001; Montaño-Armijos and Sanfeliu- Montolio, 2008), being the most important.
The study area corresponds to the area of fishing activity along the coast of Guayas Province and northwest of Puná Island, 1.8 km away from the continental margin and where 16 stations were located, of which eight were in the coastal area (stations 1-7 and 16) and eight were in the interior of the Gulf of Guayaquil (stations 8 to 15) (Figure 1).
MATERIALS AND METHODS
Sampling and analysis
Surface surveys were carried out between 8:00 and 11:00 AM on board an outboard motorboat, 1.8 km from the coast from June to November 2012. In each sample, temperature and salinity were measured with a Seabird CTD, model Seacat S19. Simultaneously, a sample of water was collected at each station using a 5-L Niskin bottle, from which 500 mL was taken for the determination of nitrite, nitrate, phosphate, and silicate, according to the methodology of Parsons et al. (1984), and 240 mL was taken for the microphytoplankton analysis and preserved with Lugol solution for later analysis in the laboratory.
The identification of the microphytoplankton species was carried out following the codes of Cupp (1943), Cleve (1951), Schiller (1971), Jiménez (1983), Tomas (1997), and Bérnard-Therriault et al. (1999), whereas species abundance was estimated using the Utermöhl method referred to in Edler and Elbrächter (2010). In this method, a motorized inverted Leica DMI8 microscope with Leica Application Suite (LAS) software and 10 mL sedimentation chambers were used, with the samples being allowed to stand in the chambers for 24 h. Next, the quantitative data were used to calculate, using the logarithm base 2, the total abundance, relative abundance of functional groups, indices of equitability, richness, and the Shannon and Wiener index (Tsirstsis and Karydis,1998; Krebs, 1999).
To characterize the trophic status by zones, based on each nutrient, the following formula was used to calculate the Karydis multivariate index (1992):
where TI is the trophic index for a specific nutrient, C is the sum of the nutrient concentration per season, Xi is the average monthly nutrient concentration per season, and A is the number of seasons.
The numerical scale that determines the trophic level is the following: <3, oligotrophic; 3-5, mesotrophic; and > 5, eutrophic.
Analysis of data
A nonparametric analysis of variance (Kruskal- Wallis, KW) was performed to verify possible nonparametric variance between the seasons and months of sampling (Zar, 1996). The hydrographic and community structure variability between zones was determined using the Mann Whitney U test (MW-U, Sheskin, 2004), expressed in box and whisker plots according to Boyer et al. (1997). To establish the relations among the hydrographic variables of each zone, a principal component analysis (PCA) was performed from a correlation matrix (Johnson and Wichern, 1992). The relations between the relevant species of each zone and the hydrographic variables were determined through a redundancy analysis (RDA), including the Monte Carlo test (ter Braak and Verdonschot, 1995; Muylaert et al., 2009) with the transformation to square root. To establish possible differences in the community structure of microphytoplankton between zones, nonparametric multidimensional analysis (MDS-Anosim) was used, and the percentage of SIMPER similarity was obtained to determine the contribution of the species between zones. All multivariate analyses were performed using the PAST ver. 3.0 software (Hammer et al., 2001).
RESULTS
Environmental variables
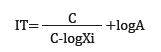
The average temperature was 25.2°C, with the minimum value (24.3°C) in August and the maximum (26.5°C) in June. Monthly differences and differences between significant zones (p <0.05) were detected, with the lowest records in the coastal zone (Figure 2a and b). The average salinity was 31.3, with the minimum (30.6) in June and the maximum (32.2) in December. Significant monthly and interzone differences (p <0.05) were recorded with the lowest records in the internal zone (Figure 2c and d).
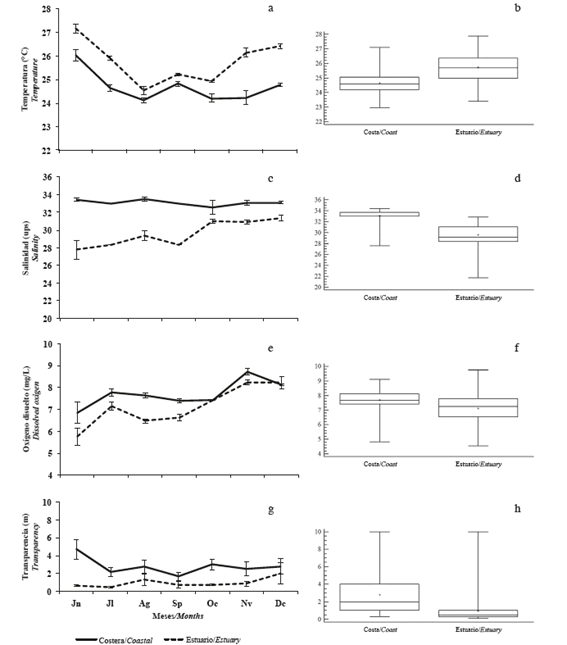
Figure 2 Monthly and zone variation of a and b) temperature, c and d) salinity, e and f) dissolved oxygen, g and h) transparency in the coastal zone (Coastal) and in the inland estuary of the Gulf of Guayaquil (estuary) along the coast of Guayas Province between June and December 2012.
The mean dissolved oxygen concentration was 7.4 mg/L, with a minimum (6.2 mg/L) in June and a maximum (8.5 mg/L) in November, with significant differences (p <0.05) recorded in the estuary (Figure 2e and f). The average transparency was 1.9 m, with the lowest (1.3 m) in July and the maximum (2.6 m) in June, with significant monthly differences (p <0.05) and differences between zones, with the lowest records in the inland estuary (Figure 2g and h).
Nitrite varied significantly monthly and between zones (p <0.05), with the lowest values being recorded in the coastal zone. The mean concentration of nitrite was 0.25 μmol/L, with the lowest concentration (0.16 μmol/L) in November and the maximum (0.36 μmol/L) in August (Figure 3a and b).
Figure 3 Monthly and zone variation of a and b) nitrite, c and d) nitrate, e and f) phosphate, and g and h) silicate in the coastal zone (Coastal) and inland estuary of the Gulf of Guayaquil (Estuary) along the coast of Guayas Province between June and December 2012.
In the case of nitrate, the lowest concentration occurred in September (4.9 μmol/L) and the highest in November (8.3 μmol/L), with an average of 5.8 μmol/L. No significant monthly differences (p> 0.05) were observed, but differences were found between zones (p <0.05), with the lowest concentrations being recorded in the coastal zone (Figure 3c and d).
Phosphate had concentrations between 1.1 μmol/L in December and 1.8 μmol/L in August; the mean value was 1.4 μmol/L. No significant differences (p> 0.05) were observed, but differences were observed between zones (p <0.05), with the lowest concentrations being recording in the coastal zone (Figure 3e and f).
The average concentration of silicate was 45.6 μmol/L, with the lowest concentration (13.6 μmol/L) in December and the maximum (84.6 μmol/L) in June. In this case, the spatial (by zone) and temporal (monthly) differences were significant (p <0.05), with the lowest values being recorded in the coastal zone (p <0.05) (Figure 3g and h).
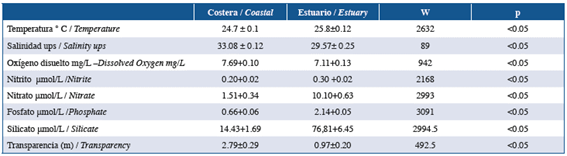
In general, in the coastal zone, lower temperatures and nutrient concentrations were observed, but higher salinity, oxygen, and transparency were observed in the coastal zone compared to the internal area of the Gulf of Guayaquil (Table 1).
Table 1 Averages of physical-chemical variables of the coastal zone and inland estuary of the Gulf of Guayaquil along the coast of Guayas Province between June and December of 2012.
The analysis of the hydrographic variables through the ACP showed 73.0% of accumulated variance in the first three components in the coastal zone; in the first axis, an inverse relation to salinity and transparency was observed between nutrients, while in the second component, the relation was inversely related to temperature and dissolved oxygen (Figure 4a). In the inner estuary, the variance accumulated in the first three axes was 71.0%; in component 1, the silicate, phosphate, and nitrite correlated inversely with the transparency, salinity, and dissolved oxygen, whereas in component 2, an inverse correlation was detected between temperature and nitrate (Figure 4b).
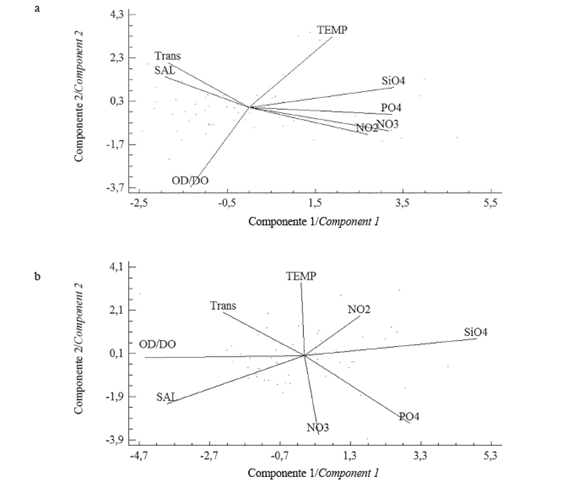
Figure 4 Orthogonal projection of the first two components of the principal components analysis in a) coastal zone and b) inland estuary of the Gulf of Guayaquil off Guayas Province between June and December 2012. (TEMP: temperature; salinity, OD: dissolved oxygen, NO2: nitrite, NO3: nitrate, PO4: phosphate, SiO4: silicate, Trans: transparency).
Trophic levels
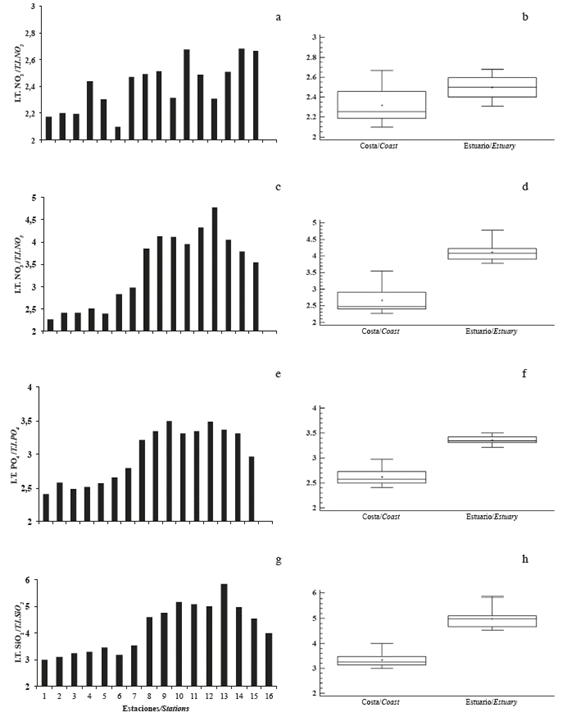
The range of variation in the trophic index values was between 3 and 7, with significant differences in the trophic level between the coastal zone and the inner estuary, the latter being the one with the highest values for all nutrients. Thus, for nitrite, the lowest value was observed at station 6, which corresponds to the sampling site farthest from the coast, while the highest values were observed at stations located in the Channel of Cascajal, Balao, and West of the island of Puná (stations 11, 15, and 16, respectively) (Figure 5a and b). For nitrate, the trophic index values were low throughout the coastal zone, while in the inner estuary, all values were greater than 4 Karydis units, especially at station 13, which corresponds to the sector of El Guabo (Figure 5c and d). A similar tendency occurred with phosphate (Figure 5e and f) and silicate (Figure 5g and h).
Microphytoplankton
Seventeen species of microphytoplankton were identified, of which approximately 78% were diatoms, 18% dinoflagellates, 2% cyanobacteria, and 2% silicoflagellates (Annex 1). The average abundance of microphytoplankton was 7.0 x 10⁵ cell/L with a minimum of 4.1 x 10⁵ cell/L in August and a maximum of 10.6 x 10⁵ cell/L in July, showing significant differences between months (KW: 28.73; p <0.05) and between zones (MW-U: 2087; p <0.05), with the greatest abundance in the interior estuary (Figure 6a and b). The average richness was 19 species, and monthly differences (KW: 21.28; p <0.05) were observed, showing a similar tendency to abundance because the lowest value was observed in August (12 species) and the highest in July (23 species). No significant differences in richness (MW- U: 1428; p> 0.05) were observed between zones (Figure 6c and d). The minimum equitability (0.76) was recorded in August and the highest (0.86) in December, with significant differences between months (KW: 12.71, p <0.05) and between zones (MW-U: 12.71, p <0.05), with the highest equitability in the coastal zone (Figure 6e and f).
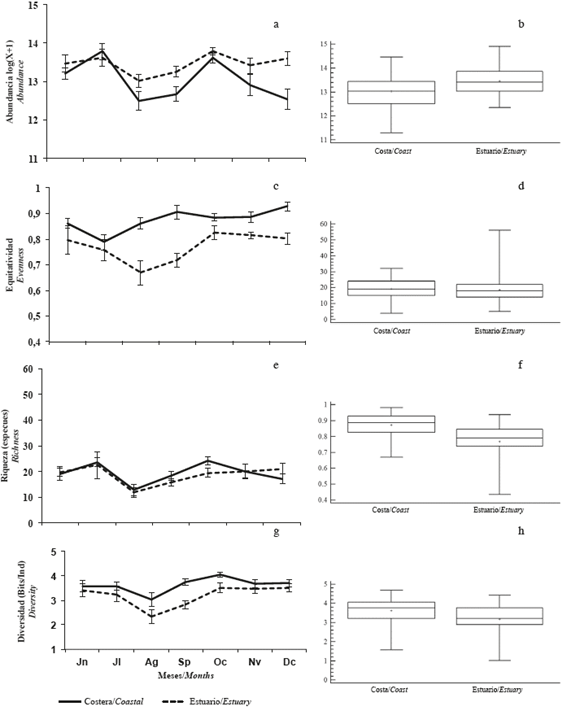
Figure 6 Monthly variation of a and b) abundance, c and d) richness, e and f) equitability, and g and h) diversity of microphytoplankton in the coastal zone (Coastal) and inland estuary of the Gulf of Guayaquil (Estuary) along the coast of Guayas Province between June and December 2012.
The average diversity was 3.4 bits/Ind, with the highest value in October (3.8 bits/Ind) and the lowest in August (2.7 bits/Ind), months in which the abundance was lower. Significant differences between months (KW: 19.6; p <0.05) and between zones (MW-U: 19.6; p <0.05) were detected, with the greatest diversity occurring in the coastal zone (Figure 6g and h).
When exploring the similarity relations (MDS- Anosim) between the microphytoplankton communities, significant differences (R: 0.44, p <0.05) were established between the coastal and inland estuary areas of the Gulf of Guayaquil; however, some species are found in both zones, with greater heterogeneity being observed in the coastal zone, with a stress of 0.18 (Figure 7).
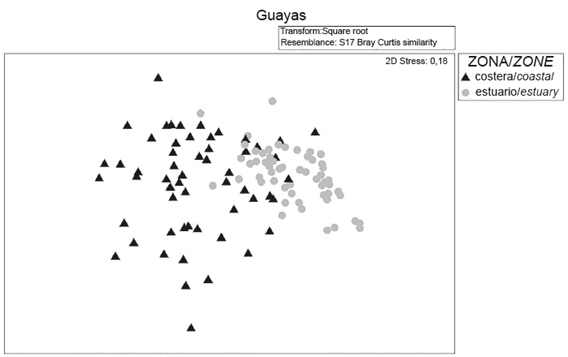
Figure 7 Analysis diagram of multidimensional scaling (MDS) of the community structure of microphytoplankton in the coastal zone and inland estuary of the Gulf of Guayaquil along the coast of Guayas Province between June and December 2012.
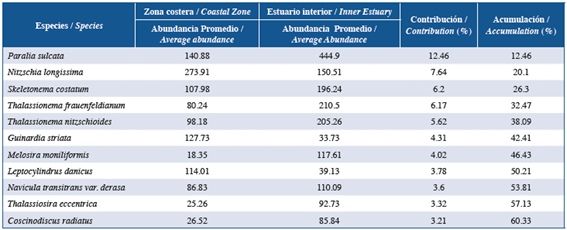
When similarities percentages (SIMPER) were analyzed to explore aspects of the internal structure of the inner and coastal estuary areas, differences were noted between the two zones. Paralia sulcata, Nitzschia longissima, Skeletonema costatum, and Guinardia striata were the species that contributed the most to separating the zones (Table 2).
Table 2 Summary of the SIMPER analysis of the microphytoplankton species in the coastal zone and inland estuary of the Gulf of Guayaquil along the coast of Guayas Province between June and December 2012.
The redundancy analysis (RDA) allowed the relationship between the microphytoplankton structure and the environmental variables of the interior estuary and coastal zone to be studied, showing a correlation of 0.54 and 0.58 in the first two components with a significant Monte Carlo analysis (p <0.05). In the first component, a high positive correlation was observed for diatoms Paralia sulcata, T. nitzschioides, T. frauenfeldii, Navicula transitrans, and Skeletonema costatum, with nutrients and negative correlation with salinity. In the second component, Guinardia striata, Cerataulina pelagica, Nitzschia longissima, Chaetoceros decipiens, and Navicula transitrans var. derasa were significantly correlated with temperature, and in turn, they were inversely related to dissolved oxygen (Figure 8a).
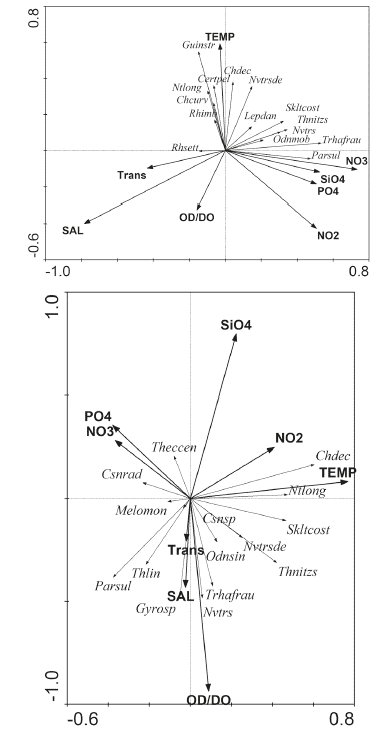
Figure 8 Orthogonal projection of the redundancy analysis in the a) coastal zone and b) interior estuary of the Gulf of Guayaquil along the coast of Guayas Province between June and December of 2012. TEMP: temperature; SAL: salinity; DO: dissolved oxygen; NO2: nitrite; NO3: nitrate; PO4: phosphate; SiO4: silicate; Theccen: Thalassionema eccentrica; Csnrad: Coscinodiscus radiatus; Melomon: Melosira moniliformis; Parsul: Paralia sulcata; Thlin: Thalassiosira limnetica; Csnsp: Coscinodiscus sp.; Chdec: Chaetoceros decipiens; Ntlong: Nitzschia longissima; Odsin: Odontella sinensis; Guinstr. Guinardia striata; Cerpel: Pelagic Cerataulina; Rhimb: Rhizosolenia imbricata; Chcurv: Chaetoceros curvisetus; Navtransde: Navicula transitrans var. derasa; Navtrans: Navicula transitrans; Lepdan: Leptocylindrus danicus; Sklcos: Skeletonema costatum; Thnitzs: Thalassiosira nitzschoides; Odmob: Odontella mobiliensis; Thfrau: Thalassionema frauenfeldii.
In the interior estuary, a correlation of 0.64 was found between the species and environment for the first two components, and the Monte Carlo test was significant (p <0.05). In the first axis, N. longissima, C. decipiens, and S. costatum were associated with temperature and, to a lesser extent, nitrite; Coscinodiscus radiatus and Melosira moniliformis were negatively related to phosphate and nitrate. In the second component, the silicate was inversely correlated with the diatoms T. frauenfeldii, Thalassiosira limnetica, P. sulcata, and N. transitrans, andthedinoflagellate Gyrodinium sp., which, in turn, were significantly related to salinity and dissolved oxygen (Figure 8b).
DISCUSSION AND CONCLUSIONS
The eutrophication processes undergone by estuaries in recent decades have been widely discussed by many authors; these processes occur not only because of the solid and liquid contributions from the natural processes of the rivers that discharge their waters into them but also from the high nutrient content that originates in anthropic activities. This interaction leads to physical processes such as turbidity and biogeochemical processes that generate an effect on the composition and abundance of microphytoplankton, with consequent effects on fisheries, aquaculture, and tourism (Alpine and Cloern, 1992; Paerl et al., 2014).
In the present study, the differences in the hydrographic conditions of the coastal zone and estuary are clear, indicated by the relations among the nutrients, salinity, and transparency that are different for each zone; however, an interaction exists between the zones due to the contributions of the Bay of Guayaquil Estuary, which have a wide reach that affects much of the coastal area (Chiriguaya and Burgos, 1990; Torres et al., 2003), as well as the exchange with the oceanic zone due to the extensive tidal regime on the Ecuadorian coast (Fiedler and Talley, 2006). When the hydrographic variables in the inner estuary were analyzed, the inverse relation between the salinity and dissolved oxygen versus the silicate concentrations is evidence of continental influences across rivers that carry large amounts of sediment and turbid water, which show activity in the biogeochemical processes. Similar results have been reported by O’Boyle and Silke (20109 and Cloern et al. (2014), who emphasized the low concentrations of dissolved oxygen in estuaries.
As for the trophic condition of the study area, the contribution of nutrients of continental origin in the study area was significant; however, the levels reached did not indicate eutrophication, which could result from the location of the sampling stations, as they were located 1 mile from the continental margin, where exchange is high due to the dynamic tidal flow (Twilley et al., 2001; Fiedler and Talley, 2006). However, recorded values greater than 3 Karydis units in nitrogen and phosphorus at the stations located in the interior estuary of the Gulf of Guayaquil indicate that this zone is at the limit of passing from the mesotrophic to the eutrophic state, an important aspect to consider for the management of this area. In this regard, Herrera-Silveira et al. (2002) and Herrera-Silveira and Morales-Ojeda (2009) recommend the use of intermediate categories (oligomesotrophic and mesoeutrophic) because, with only three levels, the Karydis index does not allow detection of trends from one level to another as all allowed with more advanced detection indexes of trophic status, a methodology that could be considered in future research. In this sense, studies showed that Cienfuegos Bay in Cuba was considered mesotrophic (Seisdedo et al., 2010) even though all nutrients presented a trophic index of less than 3. In a coastal lagoon in Mexico, Tapia-González et al. (2008))obtained levels higher than 3, which is why they described the lagoon as mesoeutrophic in nitrate and silicate; these results are similar to the averages found in the interior estuary of Guayas. The levels are not alarming, but they indicate of an initial state of eutrophication produced by river inputs that are exacerbated by anthropogenic activities, requiring medium-term evaluation to exercise control plans (Cloern et al., 2016).
On the other hand, the greatest diversity was recorded in October, with the lowest in August; Likewise, in the coastal zone, the diversity was higher than in the interior estuary, which is attributable to the great turbidity that exists in this latter zone and originates from the contribution of alien materials from contributing rivers because tropical aquatic ecosystems, especially those at low altitudes, such as rivers and estuaries, are usually very muddy due to the high material leaching that occurs in these regions. This turbidity prevents the passage of light, a situation that directly affects the productivity and energy flow of the ecosystem, as it affects phytoplankton development and diversity (Roldán and Ramírez, 2008).
When establishing correlations between phytoplankton species and the environment, evidence of independent processes is important to consider. In other words, in the coastal zone, Paralia sulcata, T. frauenfeldii, Skeletonema costatum, and T. nitzschioides were tolerant to wide areas of salinity as well as being associated to areas with important nutrient inputs (Pednekar et al., 2014; Rakshit et al., 2015), as is the normal tendency of the ecosystem of the Gulf of Guayaquil (Chiriguaya and Burgos, 1990; Gualancañay et al., 2003; Jimenez, 2008). Guinardia striata, Cerataulina pelagica, and C. decipiens, in contrast, would be associated with waters of low temperature and high concentrations of dissolved oxygen, which are representative of the flow of the Humboldt current (Okuda et al., 1983; Macias, 1999; Pennington et al., 2006).
In the estuarine zone, for the first component, the RDA showed C. decipiens and Nitzschia longissima to be associated to the temperature and nitrite, while showing an inverse correlation to nitrate and phosphate; these relations would indicate activity in biogeochemical processes that are typical of estuaries (Huisman et al., 2004), and species such as Coscinodiscus radiatus and Melosira moniliformis are indicative of areas with high nutrient concentrations (De et al., 2015). In component 2, species associated with low salinity and dissolved oxygen, as well as to high silicate, are present, such as P. sulcata, T. limnetica, N. transitrans, and Gyrodinium sp., which indicate that fluvial contributions are the main source of eutrophication (Day et al., 1989; Ninčević-Gladan et al., 2015).
Importantly, although the coastal and estuarine areas of the study area are in constant interaction, the characteristic species of each area can be distinguished, with the estuarine community being more homogeneous than the coastal zone. This is because the estuary is subject to high turbulence; thus, species are limited in terms of light intensity and are adapted to low oxygen concentrations. Therefore, Paralia sulcata, Skeletonema costatum, and T. nitzschioides, which have been registered as indicators of eutrophic waters (Huisman et al., 2004; Garmendia et al., 2013), should be considered for environmental baseline studies and environmental monitoring of the interaction between estuaries and coastal zone.
In summary, when compared to the Guayas Province, the hydrographic conditions in the coastal zone and inland estuary of the Gulf of Guayaquil were different in the structure, abundance, and diversity of microphytoplankton. In the coastal zone, the dominant species were Nitzschia longissima, Guinardia striata, and Leptocylindrus danicus, and in the interior estuary, S. costatum, Thalassionema frauenfeldii, and T. nitzschioides, which are more tolerant to turbulence, low oxygen, and low light intensity (Huisman et al., 2004).
In addition, the entire study area was determined to be mesotrophic; however, the values in the inner estuary were higher, probably because the estuary receives contributions from anthropic activities more directly, and although the trophic levels 1.8 km from the coastal margin in front of Guayas Province did not indicate eutrophication, studies are recommended at a distance of approximately 500 m to reflect the situation of the ecosystem in an area closer to the coast; in addition, management plans should be developed to avoid situations where contributions from drainage basins and urban settlements increase coastal trophic conditions.
ACKNOWLEDGMENTS
We thank Pilar Solís, Director of the National Fisheries Institute (Instituto Nacional de Pesca, INP) for supporting the development of this work and for her collaboration in the revision of the preliminary version. Additionally, we thank Mario Hurtado and Esteban Elías for the elaboration of the map of this manuscript. This work was carried out with data from the project “Condiciones biológica-pesqueras y artes de pesca en la franja marino costera dentro la primera milla náutica de la costa ecuatoriana” [Biological-fishing conditions and fishing techniques in the coastal marine strip within the first nautical mile of the Ecuadorian coast] of the INP, which was financed by the National Secretariat of Higher Education Science Technology and Innovation (SENESCYT) of Ecuador.
REFERENCES
Alpine, A. and J.E. Cloern. 1992. Trophic interactions and direct physical effects control phytoplankton biomass and production in an estuary. Limnol. Oceanogr., 375: 946-955. [ Links ]
Bérnard-Therriault, L., M. Poulin et L. Bossé. 1999. Guide d'identification du phytoplancton marin de l'estuarie et du golfe du Saint-Laurent. Incluant également certains protozoaires. Publ. Esp. Can. Sci. Halieut. Aquat. , 128, 387 p. [ Links ]
Birk, S., W. Bonne, A. Borja, S. Brucet, A. Courrat and S. Poikane. 2012. Three hundred ways to assess Europe's surface waters: an almost complete overview of biological methods to implement the Water Framework Directive. Ecol. Ind., 18: 31-41. [ Links ]
Boyer, J., J. Fourqrean and R. Jones. 1997. Spatial characterization of water quality in Florida Bay and Whitewater Bay by multivariate analyses: Zones of similar influence. Estuaries, 20: 743-758. [ Links ]
Chiriguaya, J. y L. Burgos. 1990. Variaciones verticales y su relación con algunos parámetros físico-químicos en una estación fija en el área externa del golfo de Guayaquil. Acta Oceanogr. Pacífic., 61: 32-40. [ Links ]
Cleve, A. 1951. Die diatomeen von Schweden and Finnland. Alqunvist and wikselle boktrycheri. Sheridan Press, Hanover. 251 p. [ Links ]
Cloern, J. and A. Jassby. 2010. Patterns and scales of phytoplankton variability in estuarine-coastal ecosystems. Estuar. Coast., 33: 230-241. [ Links ]
Cloern, J., S. Foster and A. Kleckner. 2014. Phytoplankton primary production in the world's estuarine-coastal ecosystems. Biogeosciences, 119: 2477-2501. [ Links ]
Cloern, J., P Abreu, J. Carstensen, L. Chauvaud, R. Elmgren, J. Grall and J. Xu. 2016. Human activities and climate variability drive fast-paced change across the world's estuarine-coastal ecosystems. Global Change Biol., 222: 513-529. [ Links ]
Coello, D., M. Prado, M. Cajas y L. Cajas. 2010. Variabilidad del plancton en estaciones fijas frente a la costa ecuatoriana. Rev. Cienc. Mar Limnol., 42:23-43. [ Links ]
Cupp, E. 1943. Marine plankton of the west North America. Bull. Scripps Inst. Oceanogr. Techn. Serv., 5: 1-238. [ Links ]
Day, J., C. Hall, M. Kemp and A. Yáñez-Arancibia. 1989. Estuarine ecology. Wiley, New York. 558 p. [ Links ]
De, T., A. Mukherjee, S. Das, M. De and T.K. Maiti. 2015. Interrelationship between planktonic diatoms and selected governing physicochemical parameters of the Hooghly estuary, Bay of Bengal. Int. J. Mar. Sci., 547: 1-9. [ Links ]
Dutto, M., G. Kopprio, M. Hoffmeyer, T. Alonso, M. Graeve and G. Kattner. 2014. Planktonic trophic interactions in a human-impacted estuary of Argentina: a fatty acid marker approach. J. Plank. Res., 36 (3): 776-787. [ Links ]
Edler, L. and M. Elbrächter. 2010. The Utermöhl method for quantitative phytoplankton analysis. Microscopic and molecular methods for quantitative phytoplankton analysis, 110. Unesco, Paris. [ Links ]
Fiedler, P. and L. Talley. 2006. Hydrography of the eastern tropical Pacific: A review. Prog. Oceanogr., 69: 143-180. [ Links ]
Garmendia, M., A. Borja, J. Franco and M. Revilla. 2013. Phytoplankton composition indicators for the assessment of eutrophication in marine waters: present state and challenges within the European directives. Mar. Pollut. Bull., 661: 7-16. [ Links ]
Gualancañay, E., M.E. Tapia y C. Naranjo. 2003. Composición y variación estacional del microfitoplancton, zooplancton y microbentos en el estuario interior del golfo de Guayaquil. Acta Oceanogr. Pacífic. , 121: 103-128. [ Links ]
Hammer, 0., D. Harper and P Ryan. 2001. Paleontological statistics software: package for education and data analysis. Palaeontol. Electron., 4: 1-9. [ Links ]
Hays, G., A. Richardson and C. Robinson. 2005. Climate change and marine plankton. Trends Ecol. Evol., 20: 337-344. [ Links ]
Herrera-Silveira, J. and S. Morales-Ojeda. 2009. Evaluation of the health status of a coastal ecosystem in southeast Mexico: Assessment of water quality, phytoplankton and submerged aquatic vegetation. Mar. Poll. Bull., 59(1): 72-86. [ Links ]
Herrera-Silveira, J., I. Medina-Gómez and R. Colli. 2002. Trophic status based on nutrient concentration scales and primary producers community of tropical coastal lagoons influenced by groundwater discharges. Hydrobiologia, 475(1): 91-98. [ Links ]
Herrera-Silveira, J., F. Comin, N. Aranda-Cyrerol, L. Troccoli and L. Capurro. 2004. Coastal water quality assessment in the Yucatan Peninsula: management and implications. Ocean Coast. Manage., 47: 625-639. [ Links ]
Huisman, J., J. Sharples, J. Stroom, P. Visser, W. Kardinaal and J. Verspagen. 2004. Changes in turbulent mixing shift competition for light between phytoplankton species. Ecology, 85: 2960-2970. [ Links ]
Jiménez, R. 1983. Diatomeas y silicoflagelados del microfitoplancton del golfo de Guayaquil. Acta Oceanogr. Pacífic. , 22: 193-281. [ Links ]
Jiménez, R. 2008. Aspectos biológicos de El Niño en el Océano Pacífico Ecuatorial. Ed. Univ. Guayaquil. 329 p. [ Links ]
Johnson, R. and D. Wichern. 1992. Applied multivariate statistical analysis. 3th ed. Prentice-Hall. New Jersey. 312 p. [ Links ]
Karydis, M. 1992. Scaling methods in assessing environmental -quality- a methodological approach to eutrophication. Environ. Monit. Assess., 22: 123-136. [ Links ]
Krebs, C. 1999. Ecological methodology. Benjamin/Cumming. California. 760 p. [ Links ]
Macías, P. 1999. Condiciones hidroquímicas frente al Ecuador en el período 1995-1999. Bol. Esp. INP Ecuador, 1: 39-71. [ Links ]
Montaño Armijos, M. y T. Sanfeliu Montolio. 2008. Ecosistema Guayas Ecuador: Medio ambiente y sostenibilidad. Rev. Tecnol. ESPOL, 211: 1-6. [ Links ]
Moreno, D., J. Quintero y A. López. 2010. Métodos para identificar, diagnosticar y evaluar el grado de eutrofia. Rev. Contactos, 78: 25-33. [ Links ]
Muylaert, K., K. Sabbe and W. Vyerman. 2009. Changes in phytoplankton diversity and community composition along the salinity gradient of the Schelde estuary Belgium/The Netherlands. Est. Coast. Shelf Sci., 82: 335-340. [ Links ]
Nelson, J., L. Deegan and R. Garritt. 2015. Drivers of spatial and temporal variability in estuarine food webs. Mar. Ecol. Prog. Ser., 533: 67-77. [ Links ]
Ninčević-Gladan, Ž., M. Bužančić, G. Kušpilić, B. Grbec, S. Matijević, S. Skejić and M. Morović. 2015. The response of phytoplankton community to anthropogenic pressure gradient in the coastal waters of the eastern Adriatic Sea. Ecol. Indic., 56: 106-115. [ Links ]
Nixon, S.W. 1995. Coastal eutrophication: a definition, social causes, and future concerns. Ophelia 41: 199-220. [ Links ]
O'Boyle, S. and J. Silke. 2010. A review of phytoplankton ecology in estuarine and coastal waters around Ireland. J. Plank. Res. , 32 (1): 99-118. [ Links ]
Okuda, T., R. Trejos, M. Valencia y A. Rodríguez. 1983. Variación estacional de la posición del frente ecuatorial y su efecto sobre la fertilidad de las aguas superficiales ecuatorianas. Acta Oceanogr. Pac., 21: 53-84. [ Links ]
Paerl, H., N. Hall, B. Peierls and K. Rossignol. 2014. Evolving paradigms and challenges in estuarine and coastal eutrophication dynamics in a culturally and climatically stressed world. Estuar. Coast. , 372: 243-258. [ Links ]
Parsons, T., Y. Maita and C. Lally. 1984. A manual of chemical and biological methods of seawater analysis. Pergamon, Oxford. 189 p. [ Links ]
Pednekar, S., V. Kerkar and S. Matondkar. 2014. Spatiotemporal distribution in phytoplankton community with distinct salinity regimes along the Mandovi estuary, Goa, India. Turk. J. Bot., 384: 800-818. [ Links ]
Pennington, T., K. Mahoney, V. Kuwahara, D. Kolber, R. Calienes and F. Chávez. 2006. Primary production in the eastern tropical Pacific: A review. Prog. Oceanogr. , 69: 285-317. [ Links ]
Prado, M. y J. Cajas. 2010a. Variabilidad del plancton en estaciones fijas frente a la costa ecuatoriana durante 2007. Rev. Cienc. Mar Limnol. INP-Ecuador, 43: 59-69. [ Links ]
Prado, M. y J. Cajas. 2010b. Variabilidad del plancton en estaciones fijas frente a la costa ecuatoriana durante 2009. Rev. Cienc. Mar Limnol. INP-Ecuador, 43: 23-31. [ Links ]
Prado, M., L. Troccoli y E. Moncayo. 2015. Cambios estructurales del microfitoplancton en la zona costera de la provincia El Oro-Ecuador en temporada seca. Bol. Inst. Oceanogr. Ven., 542: 139-152. [ Links ]
Rakshit, D., S. Sarkar, B. Bhattacharya, M. Jonathan, J. Biswas, P. Mondal and S. Mitra, S. 2015. Human induced ecological changes in western part of Indian Sundarban megadelta: A threat to ecosystem stability. Mar. Pollut. Bull. , 991: 186-194. [ Links ]
Rendón, M., N. de Padilla y E. Pérez. 1983. Estudio preliminar de los ríos de la región litoral de Ecuador. Rev. Cienc. Mar Limnol. INP. Ecuador, 21:179-222. [ Links ]
Reynolds, C. 2006. The ecology of phytoplankton. Cambridge Univ. Press., 551 p. [ Links ]
Roldán, G. y J. Ramírez. 2008. Fundamentos de limnología neotropical. Seg. ed. Univ. Antioquia, Medellín. 440 p. [ Links ]
San Martín, V. 2009. Golfo de Guayaquil. Capítulo 3. Zona de estudio. Escuela Superior Politécnica del Litoral ESPOL. DSpace en ESPOL. https://www.dspace.espol.edu.ec/bitstream/123456789/5234/3/8719.pdf . 01/10/2016. [ Links ]
Seisdedo, M., I. Pérez, G. Arancibia y A. Moreira, A. 2010. Análisis comparativo del estado trófico de las aguas en la costa oriental de la provincia de Cienfuegos, Cuba. Rev. Invest. Mar., 312: 124-130. [ Links ]
Schiller, J. 1971. Dinoflagellate (Peridinae) in monographischer Behandlung. 2 Teil. Kriptogamen-Flora von Deutschland, Osterreich und der Schweiz. Johnson Repr. Corp., New York. 316 p. [ Links ]
Sheskin, D. 2004. Parametric and nonparametric statistical procedures. Chapman and Hall, Boca Raton, USA. 423 p. [ Links ]
Tapia-González, F., J. Herrera-Silveira and M. Aguirre-Macedo. 2008. Water quality variability and eutrophic trends in karstic tropical coastal lagoons of the Yucatán Peninsula. Est. Coast. Shelf Sci., 76: 418-430. [ Links ]
ter Braak, C. and P. Verdonschot. 1995. Canonical correspondence analysis and related multivariate methods in aquatic ecology. Aquat. Sci., 57: 255-289. [ Links ]
Tomas, C. 1997. Identifying marine diatoms and dinoflagellates. Academic Press, New York. 265 p. [ Links ]
Torres, G., G. Calderón, V. Franco, E. Cedeño, T. Calderón y E. Salazar. 2003. Composición del plancton en la Puntilla de Santa Elena, durante agosto del 2002 Ecuador. Acta Oceanogr. Pacífic. , 12: 63-73. [ Links ]
Tsirtsis, G. and M. Karydis. 1998. Evaluation of phytoplankton community indices for detecting eutrophic trends in the marine environment. Environ. Monit. Assess., 50: 255-269. [ Links ]
Twilley, R., W. Cárdenas, V. Rivera-Monroy, J. Espinoza, R. Suescum, M. Armijos and L. Solórzano. 2001. The Gulf of Guayaquil and the Guayas river estuary, Ecuador: 245-263. In: Coastal Marine Ecosystems of Latin America. Springer, Berlin Heidelberg. [ Links ]
Vinagre, C. and M.J. Costa. 2014. Estuarine-coastal gradient in food web network structure and properties. Mar. Ecol. Prog. Ser., 503:11-21. [ Links ]
Vollenweider, R.A. 1992. Coastal marine eutrophication: principles and control. In: Vollenweider, R. A., R. Marchetti and R. Viviani (Eds.). Marine coastal eutrophication. The response of marine transitional systems to human impact: Problems and perspectives coastal eutrophication. Science of the total environment supplement. [ Links ]
Zar, J. 1996. Biostatistical analysis. Prentice Hall, New Jersey. 940 p. [ Links ]
ANEXES
Annex 1. List of microphytoplankton species identified along the coast of Guayas Province between June and December 2012.
Diatomeas pennadas
1 Achnanthes sp.
2 Amphora cf. arenicula
3 Amphora macilenta Gregory
4 Amphora sp.
5 Asterionellopsis glacialis (Castracane) F. E. Round
6 Bacillaria paxillifera (O. F. Müller) Hendey
7 Climacosphenia moniligera Ehrenberg
8 Cocconeis placentula Ehrenberg
9 Cocconeis pseudomarginata Gregory
10 Cylindrotheca closterium (Ehrenberg) Reimann & J.C.Lewin
11 Diploneis bombus Ehrenberg
12 Diploneis bombus var. bombiformis (Cleve) Hustedt
13 Diploneis sp.
14 Diploneis splendida Cleve
15 Entomoneis alata (Ehrenberg) Ehrenberg
16 Fragilariopsis doliolus (Wallich) Medlin & Sims
17 Gyrosigma balticum (Ehrenberg) Rabenhorst
18 Gyrosigma fasciola (Ehrenberg) J. W. Griffith & Henfrey
19 Lioloma delicatulum (Cupp) Hasle
20 Lioloma pacificum (Cupp) Hasle
21 Meuniera membranacea (Cleve) P. C. Silva
22 Navicula cruciculoides C. Brockmann
23 Navicula directa (W. Smith) Ralfs
24 Navicula distans (W. Smith) Ralfs
25 Navicula lanceolata Ehrenberg
26 Navicula sp.
27 Navicula transitrans var. derasa (Grunow) Cleve
28 Navicula transitrans var. derasa f. delicatula Heimdal
29 Nitzschia acicularis (Kützing) W.Smith
30 Nitzschia longissima (Brébisson) Ralfs
31 Nitzschia navicularis (Brébisson ex Kutzing) Grunow
32 Nitzschia recta Hantzsch ex Rabenhorst
33 Nitzschia sigma (Kutzing) W. Smith
34 Nitzschia sp.
35 Placoneis gastrum (Ehrenberg) Mereschkovsky
36 Pleurosigma acuminatum (Kutzing) Grunow
37 Pleurosigma acutum Norman ex Ralfs
38 Pleurosigma angulatum (Queckett) W. Smith
39 Pleurosigma elongatum W. Smith
40 Pleurosigma formosum W. Smith
41 Pleurosigma nicobaricum Grunow
42 Pleurosigma normanii Ralfs
43 Pleurosigma sp.
44 Pseudo-nitzschia delicatissima (Cleve) Heiden
45 Pseudo-nitzschia lineola (Cleve) Hasle
46 Pseudo-nitzschia pacifica Cupp
47 Pseudo-nitzschia pungens (Grunow ex Cleve) Hasle
48 Pseudo-nitzschia seriata Cleve
49 Surirella febigerii F. W. Lewis
50 Surirella sp.
51 Thalassionema frauenfeldii (Grunow) Hallegraeff
52 Thalassionema nitzschioides (Grunow) Mereschkowsky
53 Tryblionella hungarica (Grunow) Frenguelli
54 Ulnaria ulna (Nitzsch) P. Compere
Diatomeas céntricas
55 Actinoptychus senarius (Ehrenberg) Ehrenberg
56 Actinoptychus splendens (Shadbolt) Ralfs ex Pritchard
57 Bacteriastrum delicatulum Cleve
58 Bacteriastrum furcatum Shadbolt
59 Bacteriastrum hyalinum Lauder
60 Biddulphia alternans (J. W. Bailey) Van Heurck
61 Cerataulina pelagica (Cleve) Hendey
62 Chaetoceros affinis Lauder
63 Chaetoceros brevis F. Schütt
64 Chaetoceros coarctatus Lauder
65 Chaetoceros compressus Lauder
66 Chaetoceros convolutus Castracane
67 Chaetoceros curvisetus Cleve
68 Chaetoceros danicus Cleve
69 Chaetoceros decipiens Cleve
70 Chaetoceros denticulatus Lauder
71 Chaetoceros didymus Ehrenberg
72 Chaetoceros didymus var.protuberans (H. S. Lauder) H. H. Gran & K. Yendo
73 Chaetoceros eibenii Grunow in Van Heurck
74 Chaetoceros laciniosus Schütt
75 Chaetoceros lorenzianus Grunow
76 Chaetoceros peruvianus Brightwell
77 Chaetoceros radicans Schütt
78 Chaetoceros sp.
79 Chaetoceros tortissimus Gran
80 Coscinodiscus centralis Ehrenberg
81 Coscinodiscus concinnus W. Smith
82 Coscinodiscus curvatulus Grunow ex A. Schmidt
83 Coscinodiscus oculus-iridis (Ehrenberg) Ehrenberg
84 Coscinodiscus perforatus Ehrenberg
85 Coscinodiscus radiatus Ehrenberg
86 Coscinodiscus sp.
87 Coscinodiscus wailesii Gran y Angst
88 Cyclotella bodanica Eulenstein ex Grunow
89 Cyclotella comta (Ehrenberg) Kützing
90 Cyclotella meneghiniana Kützing
91 Cyclotella sp.
92 Cyclotella striata (Kutzing) Grunow
93 Dactyliosolen fragilissimus (Bergon) Hasle y Sivertsen
94 Dactyliosolen phuketensis (B. G. Sundström) G. R. Hasle in C. R. Tomas
95 Detonula pumila (Castracane) Gran
96 Ditylum brightwellii (T. West) Grunow
97 Eucampia cornuta (Cleve) Grunow
98 Eucampia zodiacus Ehrenberg
99 Guinardia delicatula (Cleve) Hasle y Sivertsen
100 Guinardia flaccida (Castracane) H. Peragallo
101 Guinardia striata (Stolterfoth) Hasle y Syvertsen
102 Helicotheca tamesis (Shrubsole) Ricard
103 Hemiaulus hauckii Grunow ex Van Heurck
104 Hemiaulus membranaceus Cleve
105 Hemiaulus sinensis Greville
106 Lauderia annulata Cleve
107 Leptocylindrus danicus Cleve
108 Leptocylindrus mediterraneus (H. Peragallo) Hasle
109 Leptocylindrus minimus Gran
110 Lithodesmium undulatum Ehrenberg
111 Melosira moniliformis (O. F. Muller) C. Agardh
112 Odontella aurita (Lyngbye) C. Agardh
113 Odontella dubia (Brightwell) Cleve
114 Odontella mobiliensis (Bailey) Grunow
115 Odontella sinensis (Greville) Grunow
116 Odontella sp.
117 Paralia sulcata (Ehrenberg) Cleve
118 Plagiogrammopsis vanheurekii (Grunow) Hasle, Von Stosch, & Syvertsen
119 Planktoniella sol (Wallich) Schutt
120 Proboscia alata (Brightwell) Sundström
121 Pseudosolenia calcar-avis (Schutze) B. G. Sundström
122 Rhizosolenia bergonii H. Peragallo
123 Rhizosolenia hebetata J. W. Bailey
124 Rhizosolenia hyalina Ostenfeld
125 Rhizosolenia imbricata Brightwell
126 Rhizosolenia ostenfeldii B. G. Sundstrom
127 Rhizosolenia robusta G. Norman ex Ralfs
128 Rhizosolenia setigera Brightwell
129 Rhizosolenia styliformis Brightwell
130 Skeletonema costatum (Greville) Cleve
131 Stephanopyxis palmeriana (Greville) Grunow
132 Stephanopyxis turris (Greville) Ralfs
133 Thalassiosira angulata (W. Gregory) Hasle
134 Thalassiosira anguste-lineata (A. Schmidt) G. Fryxell & Hasle
135 Thalassiosira eccentrica (Ehrenberg) Cleve
136 Thalassiosira lineata Jousé
137 Thalassiosira punctigera (Castracane) Hasle
138 Thalassiosira sp.
139 Thalassiosira subtilis (Ostenfeld) Gran
Dinoflagelados
140 Ceratium dens Ostenfeld & Schmidt
141 Ceratium falcatiforme E. G. Jorgensen
142 Ceratium furca (Ehrenberg) Claparède & Lachmann
143 Ceratium fusus (Ehrenberg) Dujardin
144 Ceratium incisum (Karsten) E.G.Jørgensen
145 Ceratium lineatum (Ehrenberg) Cleve
146 Ceratium pentagonum Gourret
147 Ceratium strictum (Okamura y Nishikawa) Kofoid
148 Ceratium teres Kofoid
149 Ceratium trichoceros (Ehrenberg) W. S. Kent
150 Dinophysis acuminata Claparede and Lachmann
151 Dinophysis caudata Saville - Kent
152 Dinophysis norvegica Claparede & Lachmann
153 Diplopelta asymmetrica (Mangin) Balech
154 Gonyaulax polyedra Stein
155 Gonyaulax polygramma Stein
156 Gonyaulax sp.
157 Gymnodinium catenatum H. W. Graham
158 Gyrodinium sp.
159 Ornithocercus sp.
160 Ornithocercus steinii Schutt
161 Oxyphysis oxytoxoides Kofoid
162 Prorocentrum gracile Schutt
163 Prorocentrum micans Ehrenberg
164 Prorocentrum rostratum Stein
165 Prorocentrum vaginulum (Stein) Dodge
166 Protoperidinium depressum (Bailey) Balech
167 Protoperidinium latispinum (Mangin) Balech
168 Protoperidinium pentagonum (Gran) Balech
169 Protoperidinium sp.
170 Pyrocystis noctiluca Murray ex Haeckel
171 Pyrophacus sp.
172 Pyrophacus steinii (Schiller) Wall & Dale
Cianobacterias
173 Anabaena sp.
Received: November 10, 2016; Accepted: August 27, 2017
 Este es un artículo publicado en acceso abierto bajo una licencia Creative Commons
