


Servicios Personalizados
Revista
Articulo
 texto en
  Español (pdf)
 Articulo en XML
 Referencias del artículo
 Enviar articulo por email
Indicadores
-
 Citado por SciELO
 -
 Accesos
Links relacionados
-
 Citado por Google
 -
 Similares en
SciELO
Similares en
SciELO -
 Similares en Google
Compartir

 Permalink
Boletín de Investigaciones Marinas y Costeras - INVEMAR
versión impresa ISSN 0122-9761
Bol. Invest. Mar. Cost. vol.47 no.2 Santa Marta jul./dic. 2018
https://doi.org/10.25268/bimc.invemar.2018.47.2.747
Research Articles
Spatial and temporal phytoplankton distribution in the Gulf of Cariaco, Sucre State, Venezuela, February 2014 - January 2015
1
 http://orcid.org/0000-0003-2288-4874
1
http://orcid.org/0000-0002-1506-1792
1
http://orcid.org/0000-0002-0167-6665
1
http://orcid.org/0000-0002-2703-8696
2
http://orcid.org/0000-0002-3562-5604
1 Departamento de Biología Marina, Instituto Oceanográfico de Venezuela, Universidad de Oriente. Apdo. Postal 126, Cumaná, Sucre. Venezuela 6101. calvo_a@hotmail.com.
2 Departamento de Biología, Escuela de Ciencias, Universidad de Oriente. Apdo. Postal 245, Cumaná, Sucre. Venezuela 6101.
3 Instituto de Investigaciones Científicas. Universidad de Oriente, Boca de Río, Nueva Esparta, Venezuela.
4 Facultad de Ciencias del Mar, Universidad Estatal Península de Santa Elena, Ecuador.
Coastal phytoplankton is affected by natural and anthropic processes. To analyze the influence of some of these processes, the spatial and temporal distribution of phytoplankton in the Gulf of Cariaco, Sucre state, was evaluated. Samples (0-10 m) were collected with Niskin bottles (5 L) in seven stations between February 2014 and January 2015. Transparency (m), salinity (UPS), temperature (° C), chlorophyll concentration a (mg m-3), and phytoplankton abundance (org mL-1) were measured. A nonparametric analysis of variance and multivariate methods (PCA, CCA, and nMDS) were used to analyze the results. The 0 - 10 m stratum was homogeneous with respect to all variables except temperature which ranged from 20.1 to 29.1 °C (March and October, respectively).
Temporally, the variables were heterogeneous. Biomass fluctuated between undetectable (ND) and 17.5 mg m-3 (December and March). While microalgal abundance oscillated between 0.24 and 1.85 x 10³ org mL-1 (April and February). The community was dominated by diatoms, nanoflagellates, and coccolithophorids. The first two groups were associated with turbulent, nutrient-rich waters. The nMDS separated the community into the three periods previously described for the region. Likewise, the CCA detected that wind speed and temperature were the most influential variables on the phytoplankton community during upwelling and relaxation period, respectively. In the transition period, none of the variables studied affected the community. This is the first time that coccolithophores are reported as part of the dominant flora in the Gulf of Cariaco. This change suggests modifications in the oceanographic conditions of the study area.
KEYWORDS: Coastal upwelling; Southeastern Caribbean Sea; Planktonic community; Marine tropical microalgae; Coccolithophorids
El fitoplancton costero es afectado por procesos naturales y antrópicos. Para analizar la influencia de algunos de estos procesos se evaluó la distribución espacial y temporal del fitoplancton en el golfo de Cariaco, estado Sucre. Las muestras (0-10 m) fueron recolectadas con botellas Niskin (5 L) en siete estaciones entre febrero de 2014 y enero de 2015. Se midió transparencia (m), salinidad (UPS), temperatura (°C), concentración de clorofila a (mg m-3) y abundancia del fitoplancton (org ml-1). Se utilizó un análisis de varianza no paramétrico y métodos multivariados (ACP, ACC y nMDS) para analizar los resultados. El estrato 0 - 10 m fue homogéneo con respecto a todas las variables excepto la temperatura cuyo intervalo fue 20.1 - 29.1 °C (marzo y octubre, respectivamente). Temporalmente, las variables fueron heterogéneas. La biomasa fluctuó entre no detectable (ND) y 17.5 mg m-3 (marzo y diciembre). Mientras que, la abundancia microalgal osciló entre 0.24 y 1.85 x 10³ org mL-1 (abril y febrero). La comunidad fue dominada por diatomeas, nanoflagelados y cocolitofóridos. Los primeros dos grupos estuvieron asociados a aguas turbulentas ricas en nutrientes. El nMDS separó la comunidad en tres épocas descritas previamente para la región. Asimismo, el ACC detectó que la variable más influyente sobre la comunidad fitoplanctónica fue la velocidad del viento en la época de surgencia y la temperatura en la de calmas; en la de transición, ninguna de las variables estudiadas afectó la comunidad. Esta es la primera vez que se informa sobre la dominancia de los cocolitofóridos en la comunidad fitoplanctónica del golfo de Cariaco. Este cambio sugiere modificaciones en las condiciones oceanográficas del área de estudio.
PALABRAS CLAVE: Surgencia costera; Mar Caribe suroriental; Comunidad planctónica; Microalgas marinas tropicales; Cocolitofóridos
INTRODUCTION
In coastal areas, the abundance of phytoplankton is controlled by natural changes and anthropogenic activities that affect the marine environment (Martínez- López et al., 2001). This is because the neritic zone is exposed to pollution generated by solid and liquid wastes from commercial, domestic, industrial, port, maritime and tourist activities (Pinzón-Bedoya et al., 2007). In this sense, human activity alters the spatial and temporal dynamics of phytoplankton caused by natural factors and processes that occur at temporal scales that vary from femtoseconds to millennia (Reynolds, 1990; Gallegos and Neale, 2015). In addition, in the tropics, phytoplankton dynamics is controlled mainly by the supply of nutrients to surface layers (Lewis, 1992; Lewandoska et al., 2014).
These marine environments are traditionally considered oligotrophic with very low seasonal variability (Burford et al., 1995). However, in river mouths (Cloern et al., 2014; Davis et al., 2014) or where coastal upwelling phenomenon occurs (Philips and Badylak, 1996), the input of nutrients is high, and waters can be classified as mesotrophic or eutrophic. There may also be high seasonal variability.
This is the case of the Gulf of Cariaco (Sucre state, Venezuela), where biomass and phytoplankton abundance may increase in the calm season (rainfall), when surface runoff, river discharge and increased groundwater flow play an important role as nutrient sources (Novoa et al., 1998); as well as during the coastal upwelling season, when trade winds promote the upward movement of nutrient- rich subsurface waters (Ferraz-Reyes, 1983; Alvera- Azcárate et al., 2009, 2011). The Gulf is a water body that is influenced by the Northeast trade winds during the first part of the year and, is influenced by the Intertropical Convergence Zone (ITCZ) during the second half of the year (Quintero et al., 2004; López-Monroy and Troccoli- Ghinaglia, 2014). Considering its high productivity, this study proposes to evaluate the spatio-temporal variation in phytoplankton composition, abundance and, diversity in the Gulf of Cariaco.
MATERIALS AND METHODS
The Gulf of Cariaco is located in the northeastern region of Venezuela, between 10° 36' 00" - 10° 26' 20" N and 64° 13' 40'' - 63° 38' 20" W (Caraballo, 1982a).
Its general characteristics are described in Caraballo (1982a, 1982b). Samples were taken monthly at seven stations (georeferenced, using a Garmin GPS), on the surface and at 10 m depth using a Niskin bottle (5L) from February 2014 to January 2015 (Figure 1, Table 1). Water transparency was measured in situ with a Secchi disc (m), and salinity (UPS) and temperature (ºC) were measured with a multiparameter probe (Jenway 970 DO2 Meter). Measurements of chlorophyll a (chlor. a) and phaeopigments was performed according to the Lorenzen method, described and improved by Parsons et al. (1984), whereas the determination of microalgal abundance was carried out according to the Utermöhl sedimentation method that is described by Edler and Elbrächter (2010). Phytoplankton species were identified according to the works of Cupp (1943), Tomas (1997), Berard- Thierrault et al. (1999) and Rivera-Tenenbaum (2006). Figures of phytoplankton abundance are presented on a logarithmic scale (Log10) for better visualization. The coccolithophores Emiliania huxleyi and Gephyrocapsa oceanica are hereafter named Emiliania-Gephyrocapsa because optical microscopy does not allow for differentiation of their coccoliths.
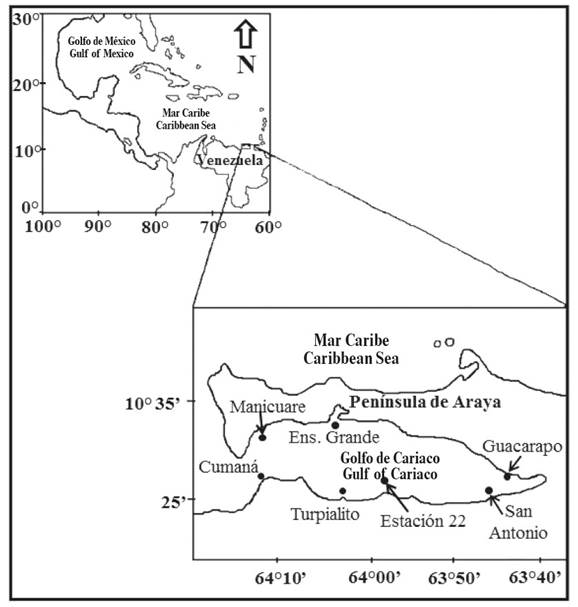
Table 1 Geographic locations of the sampling stations.
| Estaciones de muestreo Sampling stations | Coordenadas geográficas Geographical coordinates |
|---|---|
| Desembocadura del río Manzanares / Manzanares river mouth | 10° 28' 108" N - 64° 11' 954" O |
| Turpialito | 10° 26' 768" N - 64° 02' 065" O |
| Estación 22 / Station 22 | 10° 28' 300" N - 63° 58' 000" O |
| San Antonio | 10° 26' 666" N - 63° 47' 614" O |
| Guacarapo | 10° 29' 525" N - 63° 44' 629" O |
| Ensenada Grande del Obispo | 10° 34' 339" N - 64° 03' 134" O |
| Manicuare | 10° 32' 017" N - 64° 11' 717" O |
In addition, species diversity was calculated with the Shannon index (Krebbs, 1999). Wind speed data (average of the sampling day and the three previous days) were supplied by the meteorological station of the Antonio José de Sucre Airport, Cumaná, Sucre State.
Oceanographic periods were established by modifying the periods proposed by Rivas-Rojas et al. (2007). Samples corresponding to the upwelling period (February-May) presented a temperature of ≤ 24 °C, nitrite + nitrate concentrations between 1 and 7.5 µmol L-1 and phosphate concentrations between 0.5 and 1.2 µmol L-1. Samples from the transition period (June- August) were characterized by temperature values in the range 24 < X ≤ 26 °C, nitrite + nitrate concentrations from 0.5 to 4 µmol L-1 and phosphate concentrations from ND to 0.8 µmol L-1. Finally, during the calm season (September-January) the temperature was ≥ 26 °C, approximate nitrite + nitrate concentrations varied between 0.5 - 1 µmol L-1 and phosphate concentrations ranged from 0.3 to 1 µmol L-1. The transition period corresponds to the secondary upwelling period that is described by Rueda-Roa et al. (2018).
The temporal and spatial differences in the variables were analyzed with the nonparametric variance analysis proposed by Kruskall-Wallis (Boyer et al., 1997) because the distribution of the data did not meet the assumptions of normality and homocedasticity. The relationships between variables were determined using Principal Components Analysis (PCA) from a multiple correlation matrix (Johnson and Wichern, 1992). The relationships between phytoplankton and the other variables for each period were interpreted using Canonical Correspondence Analysis (CCA, Ter Braak and Verdonschot, 1995). With respect to seasons, differences in the structure of the phytoplankton community were stablished with non-parametric Multidimensional Scaling (nMDS, Clarke and Warwick, 2001).
RESULTS
Table 2 shows the basic statistics of the variables measured in the Gulf of Cariaco from February 2014 to January 2015. The lowest average wind speed (1.67 m s-1) was detected in October (calm season), while the highest (6.67 m s-1) was detected in April (upwelling season), both in 2014. Significant differences in this variable were observed with respect to months and seasons (KW =90 and 27.85, p < 0.05; respectively Figure 2 A and B). Water temperature exhibited a behavior similar to the average wind speed, showing differences with respect to months and seasons (KW = 136.41 and 127.66, p < 0.05; respectively Figure 2 C); in addition, it varied significantly in relation to depth and localities (KW = 8.14 and 13.03, p < 0.05; respectively, Figure 2D, localities). The lowest temperature value (20.1 ºC) was measured at 10 m in Guacarapo (March 2014; upwelling period), while the highest (29.1 ºC) was measured at the surface in Ensenada Grande del Obispo (November 2014; calm season). The other variables presented no significant differences correlated to depth or location (Table 3).
Table 2 Basic statistics of the physical, chemical and biological variables measured in the Gulf of Cariaco from February 2014 to January 2015. N: sample size; S: standard deviation; H': Shannon-Wiener (diversity) index. The average wind speed represents the average of the sampling day and the three previous days.
| Variables | N | Promedio Average | S | Mín | Máx |
|---|---|---|---|---|---|
| Velocidad promedio del viento (m s-1) Average wind speed | 12 | 5.851 | 1.718 | 3.34 | 9.17 |
| Transparencia (m) Transparency | 81 | 7.226 | 3.494 | 1.50 | 19.50 |
| Salinidad (UPS) Salinity | 165 | 36.316 | 2.698 | 11.00 | 38.86 |
| Temperatura del agua (°C) Water temperature | 166 | 24.300 | 2.285 | 20.06 | 29.10 |
| Conc. O disuelto (mg L-1) 2 Dissolved O Conc. (mg L-1) 2 | 116 | 4.342 | 2.357 | 0.85 | 12.83 |
| Conc. clor. a (mg m-3) Chlor. a conc. (mg m-3) | 158 | 2.934 | 3.020 | nd | 17.52 |
| Feopigmentos (mg m-3) Feopigments (mg m-3) | 156 | 0.789 | 0.705 | nd | 4.64 |
| Abund. total (org mL-1) Total abund. (org mL-1) | 166 | 242 | 272 | 24 | 1847 |
| H´(bits ind-1) H´(bits ind-1) | 166 | 2.116 | 0.764 | 0.38 | 3.74 |
| Equidad Equity | 166 | 0.615 | 0.175 | 0.13 | 0.99 |

Figure 2 Temporal and spatial distribution of the average wind speed (m s-1; A and B) and temperature (°C; C and D) in the Gulf of Cariaco, February 2014 - January 2015. Manz: Manzanares River mouth; Turp: Turpialito; E. 22: Station 22; S. An: San Antonio; Gua: Guacarapo; E. Gr: Ensenada Grande del Obispo; Mani: Manicuare.
Table 3 Variables that presented no significant spatial differences (p > 0.05).
| Variable Variable | Factor Factor | Valor del análisis (KW) Analysis value (KW) |
|---|---|---|
| Concentración de clorofila a | Profundidad / Depth | 0.66 |
| Chlorophyll a concentration | Localidades / Locations | 11.63 |
| Abundancia fitoplanctónica | Profundidad / Depth | 0.64 |
| Phytoplankton abundance | Localidades / Locations | 4.49 |
| Diversidad | Profundidad / Depth | 0.40 |
| Diversity | Localidades / Locations | 0.11 |
Regarding chlorophyll α concentrations, the lowest value (ND; the calm period, was observed in December at Turpialito (surface) and Manicuare (10 m), as well as at the Manzanares River mouth (surface), San Antonio (10 m) and Ensenada Grande (surface) in January 2015. The highest value (17.52 mg m-3) was obtained at San Antonio (10 m) in March (upwelling season). The maximum value coincided with a bloom of of Guinardia striata. This variable presented significant differences in relation to months and seasons (KW = 68.78 and 46.35, p < 0.05; respectively, Figure 3 A and B), but showed no variation in relation to depth or localities.
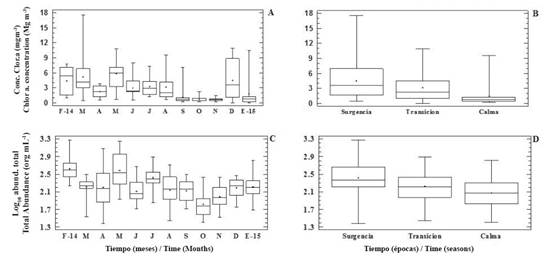
Figure 3 Temporal distribution chlor. α concentration (mg m-3; A and B) and total abundance (org mL-1; C and D) in the Gulf of Cariaco, February 2014 - January 2015.
Phytoplankton abundance showed a similar trend that chlorophyll concentration, varying significantly in relation to months and seasons (KW = 59.23 and 26.46, p < 0.05; respectively. Figures 3 C and D), but not by locality or depth. The range of abundance values was 0.2 - 1.8 x 10³ org mL-1. The lowest value was detected at depth of 10 m in San Antonio (April 2014), whereas the highest value was detected on the surface at the Manzanares River mouth (February 2014), both during the upwelling season.
The relative abundance of functional groups presented the following order of importance: diatoms > nanoflagellates > coccolithophores > dinoflagellates > cyanobacteria > "others" (Figure 4 A). Diatoms (42% of individuals) and nanoflagellates (35% of individuals) dominated alternately. Nanoflagellates dominated the community from February to April 2014 and were replaced by diatoms between May and July of the same year. Then, nanoflagellates dominated again from August to November and again were replaced by diatoms at the end of the study. Coccolithophores represented an important fraction of the total organisms and ranked second in terms of abundance in March, June and September 2014 (32% to 24%), as well as in January 2015 (30%). On the other hand, cyanobacteria and "others" presented the lowest abundance and showed no clear trend, thus they were combined in "Others".

Figure 4 Temporal distribution of the relative abundance (%, A) and diversity (bits ind-1, B and C) of phytoplankton in the Gulf of Cariaco, February 2014 - January 2015.
A total of 249 species were identified, of which 120 were diatoms, 90 dinoflagellates, 13 coccolithophorids, 6 cyanobacteria and 20 "others". Twenty-three of the identified taxa belonged to the resident species (Table 4). The species that dominated the community were: the diatoms Cylindrotheca closterium, Nitzschia longissima, Thalassionema nitzschioides, and Thalassiosira sp; the dinoflagellates Prorocentrum micans, and Scrippsiella trochoidea; and the coccolithophores Calciosolenia murrayi, and Emiliania-Gephyrocapsa.
Table 4 List of resident species (present in more than 20% of the samples) in the Gulf of Cariaco, February 2014 - January 2015. FO: Occurrence Frequency. Ab: abundance.
| Especies residents Resident species | F.A (%) OF (%) | Ab. (org ml-1) Ab. (org ml-1) |
|---|---|---|
| Diatomeas / Diatoms | ||
| Cylindrotheca closterium Ehrenberg | 47 | 279 |
| Chaetoceros sp. | 27 | 446 |
| Guinardia striata (Stolterfoth) Hasle | 25 | 4351 |
| Leptocylindrus danicus Cleve | 23 | 1483 |
| Navicula sp. | 30 | 107 |
| Nitzschia longissima (Brébisson) Ralfs | 53 | 348 |
| Pleurosigma sp. | 27 | 54 |
| Pseudo-nitzschia lineola (Cleve) Hasle | 25 | 494 |
| Pseudo-nitzschia pungens (Grunow ex Cleve) Hasle | 30 | 616 |
| Rhizosolenia imbricata Brightwell | 24 | 126 |
| Thalassionema nitzschioides (Grunow) Mereschkowsky | 45 | 1079 |
| Thalassiosira sp. | 54 | 550 |
| Dinoflagelados / Dinoflagellates | ||
| Ceratium gibberum Gourret | 22 | 45 |
| Dinophysis acuminata Claparède y Lachmann | 22 | 53 |
| Dinophysis caudata Saville-Kent | 22 | 26 |
| Gymnodinium sp. | 28 | 174 |
| Prorocentrum gracile Schütt | 28 | 41 |
| Prorocentrum micans Ehrenberg | 33 | 79 |
| Scrippsiella trochoidea (Ehrenberg) Kretschmann | 37 | 491 |
| Scrippsiella sp. | 34 | 270 |
| Tripos furca (Ehrenberg) Gómez | 28 | 105 |
| Cocolitofóridos / Coccolithophores | ||
| Calciosolenia murrayi Gran | 38 | 1156 |
| Emiliania-Gephyrocapsa | 72 | 4310 |
On the other hand, diversity fluctuated between 0.38 bits ind-1 (on the surface at Turpialito in November 2014, calm season) and 3.74 bits ind-1 (on the surface at Manicuare in June 2014, transition season). This variable presented significant differences with respect to months and seasons (KW = 54.38 and 40.45; p < 0.05; Figures 4 B and C, respectively), but showed no variation with respect to localities or depths.
The cumulative variance of the values of the variables in the first three PCA components during the upwelling period was 72% of the total (Table 5). The first component showed a positive correlation between average wind speed, temperature, diatom abundance, abundance of coccolithophores and total abundance; these variables correlated negatively with chlor. α concentration (Fig. 5 A). Likewise, the CCA of that period showed that the average wind speed had one the greatest impacts on the community structure (Fig. 5 B), followed by temperature and the chlor. α concentration in order of importance. The presence of diatoms G. striata and Th. nitzschiodes and the dinoflagellate Tripos furca was associated with these variables.
Table 5 Percentages of total variance explained by the first three components of the Principal Component Analysis (PCA) applied to the variables measured in the Gulf of Cariaco, February 2014 - January 2015.
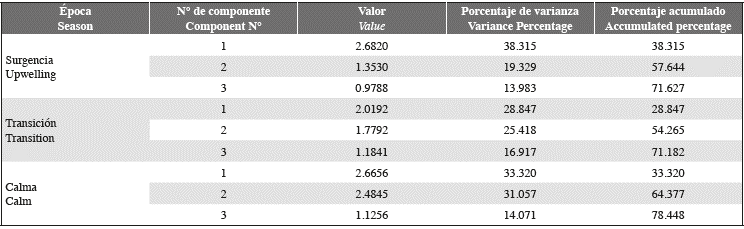
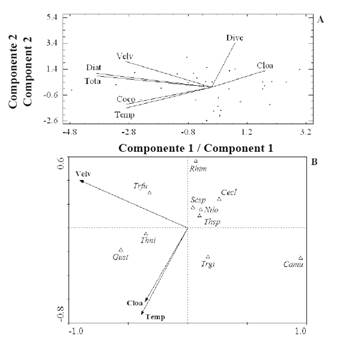
Figure 5 Orthogonal projection of some studied variables defined by the first two PCA components (A), and between these variables and the most abundant and frequent organisms of the CCA (B), for the upwelling season.
On the other hand, during the transition period (June-August 2014), it was determined that the cumulative variance of the values of the variables in the first three PCA components was 71% of the total (Table 5). The first component showed a positive correlation between the chlor. α concentration, diatoms, coccolithophores, and total abundance (Figure 6 A). The second component showed a positive correlation between the average wind speed and diversity. These variables correlated negatively with temperature. In the transition period, the concentration of chlor. α and temperature were positively associated with the abundance of the coccolithophore C. murrayi and dinoflagellates P. gracile and T. fusus in component 1 (Figure 6 B). The average wind speed was negatively associated with the variable and the species mentioned above.
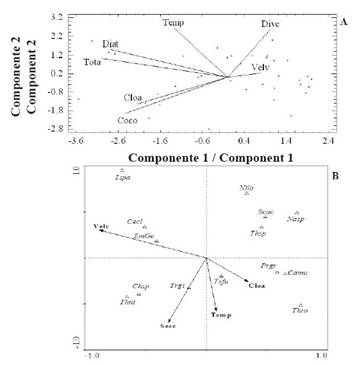
Figure 6 Orthogonal projection of some studied variables defined by the first two PCA components (A), and between these variables and the most abundant and frequent organisms of the CCA (B), for the transition period.
Finally, it was determined that the cumulative variance of values of the variables in the first three PCA components during the calm season (September 2014-January 2015) was 78% of the total (Table 5). This period showed a positive correlation between temperature, concentration of chlorophyll α, dinoflagellate abundance, and diversity. These variables correlated negatively with the diatom, coccolithophores, nanoflagellates, and total abundance (Figure 7 A). Likewise, CCA showed that diversity was the variable that most identified the community structure, followed by temperature and the average wind speed (Figure 7 B). Diatoms C. closterium, P. lineola, Thalassiosira sp. and dinoflagellates P. micans and S. trochoidea were strongly associated with diversity in the first component. On the other hand, the presence of the coccolithophore Emiliania-Gephyrocapsa and dinoflagellate P. gracile was strongly associated temperature and transparency.
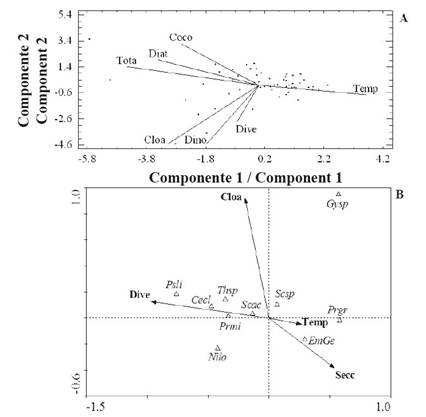
Figure 7 Orthogonal projection of some studied variables defined by the first two PCA components (A), and between these variables and the most abundant and frequent organisms of CCA (B), for the calm period.
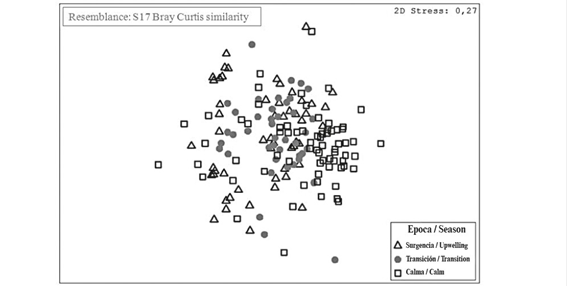
Although the MDS-ANOSIM detected significant differences among seasons (R = 0.216; p < 0.05), no evident difference was found (Table 6, Figure 8). This may be explained because the transition period is a subset of the upwelling and calm periods.
Table 6 Summary of the Analysis of Similarity (ANOSIM) applied to the multivariate data; seasons in the Gulf of Cariaco between February 2014 and January 2015 were considered as a factor.
| Grupos Groups | Estadístico R Statistic R | Nivel de significancia Significance level | Permutaciones Permutations | Numero >= observado Observed number ≥ |
|---|---|---|---|---|
| Surgencia - Transición Upwelling - Transition | 0.109 | < 0.05 | 999 | 0 |
| Surgencia - Calma Upwelling - Calm | 0.282 | < 0.05 | 999 | 0 |
| Transición - Calma Transition - Calm | 0.217 | < 0.05 | 999 | 0 |
DISCUSSION
Although the records of the hydrographic and phytoplankton data in the transition period formed a subset of the measurements carried out in the upwelling and calm periods, the data distribution was suggestive of seasonality. This was demonstrated by the differences between the relation of the variables expressed in the PCA, which caused variations in the community structure, as well as by the difference between seasons shown in the CCA, which showed differences in the relationships between the variables and the dominant species in each season.
During the upwelling period, the highest wind speed, lowest temperature, and phytoplankton abundance were observed. Authors including Alvera-Azcárate et al. (2009, 2011), Jury (2017) and Rueda-Roa et al. (2018) have noted that these characteristics are common during the first months of the year when trade winds act with greater intensity, causing coastal upwelling to occur.
Pigment concentration and phytoplankton abundance values measured in this study are within the usual range reported for this season (0.01 - 43.06 mg Chlor. α m-3 and 0.02 - 2.32 × 10³ org mL-1; Ferraz-Reyes, 1983 and Rivas-Rojas et al., 2007; La Barbera-Sánchez et al., 1999 and Pirela-Ochoa et al., 2008). However, the phytoplankton composition is different with that recorded by Ferraz-Reyes (1976), Gómez-Carvajal et al. (2000), Rivas-Rojas et al. (2007), and Pirela-Ochoa et al. (2008), who found that diatoms dominated the community exclusively during the upwelling season. In addition, those authors established that coccolithophores were occasional members of the community. However, this study determined that coccolithophore C. murrayi and the Emiliania-Gephyrocapsa complex accounted for a portion of the dominant organisms.
The change in the conformation of the dominant group from diatoms to diatoms/coccolithophores during the upwelling period agrees with Taylor et al. (2012) for the CARIACO time-series station (CARIACO), located approximately 50 km east of the Gulf of Cariaco. The authors established that at this period during 1996-2004, diatoms outnumbered the other groups, whereas from to 2004 onwards, diatoms and coccolithophores were co- dominant and exhibited similar numbers.
Astor et al. (2013) quantified a pH fluctuation from 8.113 to 8.014 in CARIACO from 1996 - 2008. Although the authors reported that pH tended to decrease during this period, it is considered that the variation of pH (0.099 units) is much reduced to explain co-dominance of diatoms and coccolithophorids during the upwelling season. In this sense, Beaufort et al. (2011) noted that the response of coccolithophorids to the increase in partial pressure of CO2 in the Chilean upwelling zone is contradictory. The reduction of up to 0.4 pH units resulted in the substitution of slightly calcified Emiliania huxleyi specimens for other highly calcified specimens. Likewise, Alvites Gutiérrez (2016) indicated that in Peruvian waters, the level of calcification and distribution of coccolithophores is related to the intensity of coastal upwelling and the distribution of water masses that modify key factors such as temperature, pH, oxygen, and nutrients. According to the author, the abundance of coccolithophores increased toward the intermediate and oceanic stations where the pH reached more alkaline values; the water column presented a greater stratification and warmer waters and the N/P values increased.
Therefore, consistent with Taylor et al. (2012), the change in the community structure of phytoplankton during the upwelling period is attributed to the warming of surface water and the weakening of its intensity. These conditions decrease the supply of nutrients to the euphotic layer, negatively impacting diatom growth. The presence of turbulent waters with a lower nutrient content would favor the increase in abundance of coccolithophores at the expense of diatoms. However, it is necessary to perform a study to compare the current concentrations of nutrients with those of the 1970s and 1980s in order to obtain validation.
In addition, it has been suggested that continental drainage during the rainy season has a significant impact on the contribution of the silica that is necessary for diatom growth during the upwelling season (Elguezabal Méndez, M. A. Universidad de Oriente, Cumaná, Venezuela. 2003. Pers. Com.). Therefore, it is necessary to investigate the relationship between precipitation and the presence of diatoms. The northeastern region of Venezuela is semiarid and land drainage could represent a significant contribution of silica to the system. Such information could show another impact of global warming in the region.
Even though dinoflagellates contributed less to the phytoplankton composition of the gulf during the upwelling period, P. micans and S. trochoidea accounted for part of the most abundant species at the end of that period. In relation to this, Ferraz-Reyes et al. (1987) noted that several species of dinoflagellates were abundant in the Gulf of Cariaco during the upwelling season.
The positive correlation between average wind speed, temperature, diatoms, coccolithophorids and total abundance not only showed that both groups of microalgae provided the highest numeric contribution but also that both were favored by the presence of turbulent subsurface waters of lower temperature, as mentioned by Rivas-Rojas et al.
(2007). On the other hand, the negative association of these variables in relation to chlor. α suggests that the increase in chlorophyll concentration was the response to the entry of a greater amount of nutrients, caused mainly by upwelling (Shang et al., 2004; Goschen et al., 2015).
The fact that wind speed was one of the most influential variables on phytoplankton community was due to the deepening of the mixed layer. This controls the entrance of nutrients into the water column and the permanence of phytoplankton in the illuminated layer, among other variables (Raymont, 2014; Zhang et al., 2016). The association between G. striata and the concentration of chlor. α suggests that this diatom, whose total abundance during this season was high, provided the greatest amount of chlor. α.
In the transition period, the average wind speed decreased progressively, whereas the temperature increased. This behavior has been described by several researchers (Gómez-Carvajal et al., 2000; Quintero et al., 2004; Rueda-Roa et al., 2018) who, despite not indicating the existence of a transition period, stated that this trend is typical during the second half of the year in the northeast part of the country. The values of chlor. α measured during this period are within the range (ND -17.34 mg chlor. α m-3, Rivas-Rojas et al., 2007;Soto et al., 2015) registered for this season, showing the same pattern as the variables that were previously described.
Likewise, phytoplankton abundance is within the range (0.05 - 3.27 × 10³ org.mL-1) described by Rivas- Rojas et al. (2007) and Calvo-Trujillo et al. (2015) for this season. The community was mainly composed of diatoms, nanoflagellates, and coccolithophores. This composition is similar to that described for the previous season, which suggests that even during the transition period, the wind intensity was sufficient to maintain diatoms suspended in the water column. This is corroborated by the inclusion of diatoms such as N. longissima and Th. nitzschiodes within the dominant species. Gómez-Carvajal et al. (2000), Rivas-Rojas et al. (2007), and Pirela-Ochoa et al. (2008) established that these diatoms were part of the dominant functional group throughout the year at San Luis beach and at the island of Cubagua. This difference in the role of N. longissima and Th. nitzschiodes could represent a variation in the prevailing environmental conditions in the northeast of Venezuela in the last decade. Such variation could only be confirmed with the implementation of a time-series station in the gulf.
Diversity not only presented the maximum values of the study during this season, but the values were also higher than those reported by Margalef (1972) for neritic waters and higher than the intervals reported in Los Roques archipelago and San Luis beach (Sánchez- Suárez, 1994 and Rivas-Rojas et al., 2007, respectively). The decrease in wind speed allows the coexistence of species that grow in turbulent waters with species that grow in stratified waters, and therefore diversity was greater. This was corroborated by the PCA that was applied to the season in question.
On the other hand, CCA showed that even though the average wind speed did not directly influence the community, the turbulence produced was sufficient to maintain a well-mixed water column. Likewise, the fact that dinoflagellates P. gracile and T. furca were strongly associated with the chlor. α concentration suggests that the locomotive capacity of these species allowed for a greater permanence in the illuminated area for their growth (Balech, 1977; Harrison et al., 2015).
Finally, during the calm season, the environmental variables exhibited a behavior typical of the Venezuelan northeast (Rueda-Roa et al., 2018). The period is characterized by weakening of the trade winds and passage of the ITCZ over the region, both of which control rain patterns in the north part of the country (Quintero et al., 2004).
Concentration of chlorophyll (ND - 12.39 mg chlor. α m-3; Pirela-Ochoa et al., 2008 and Salazar-Gómez et al., 2011, respectively), abundance (0.05 - 2.37 x 10³ org mL-1; Rivas-Rojas et al., 2007 and La Barbera-Sánchez et al., 1999; respectively) and diversity (0.29 - 3.8 bits ind- 1, Sánchez-Suárez 1994 and Rodríguez-Centeno et al., 2010, respectively) are typical for the season. Likewise, the dominance of nanoflagellates was observed from the beginning to the middle part of this season. This dominance is attributed to its various forms of nutrition as indicated by Rivas-Rojas et al. (2007), and more recently by Calvo- Trujillo et al. (2015). In addition, flagella provide it a certain locomotion in the stable water column, which allows it to migrate and thus obtain a greater quantity of nutrients (Tomas, 1997).
Between December 2014 and January 2015 a change community composition occurred. Numerically, diatoms dominated the community again, which was caused by the increase in wind intensity and turbulence that occurred during the upwelling season. However, the concentration of nutrients available should have been low, which explains the positive correlation between temperature and the abundance of dinoflagellates, a common event during the calm season. In addition, the association between the concentration of chlor. α and the dinoflagellates suggest that these contributed the largest fraction of the pigment in this period. Moreover, the fact that these variables are associated in an opposite way to the abundance of diatoms, coccolithophorids and total organisms confirms the presence of nutrient-poor waters with low abundance and phytoplankton biomass. In the area, this event has been reported by Ferraz-Reyes et al. (1987).
The results indicated that the oceanographic and atmospheric processes of the Gulf of Cariaco allow for dividing the study into three different seasons: upwelling, transition (upwelling and calm) and calm. Each period features its own physicochemical and biological characteristics (phytoplankton in general) that result from variation in the intensity of these processes. It may be possible to distinguish a fourth season, the transition between calm and upwelling, but this requires a more prolonged study.
CONCLUSIONS
The temporary changes in the hydrographic variables corresponded to what is considered typical for the Gulf of Cariaco. These changes were caused by the action of the trade winds during the first part of the year, as well as by the contribution of fresh water and nutrients during the rainy season in the second half of the year. Even though the dominant species identified in the present work agrees with that established in previous investigations in the Gulf of Cariaco, a change in hegemony during the upwelling season was detected. The coccolithophorids C. murrayi and Emiliania-Gephyrocapsa were not only present in all samples but also dominated the phytoplankton community during the upwelling season.
ACKNOWLEDGMENTS
This research was funded by FONACIT as part of the project entitled "Evaluation of phytoplankton and the possible effect of global warming on its composition in the littoral zone of the Gulf of Cariaco, Venezuela" (PEII N° 2013001650). The authors would like to thank Lina Charzeddine and Jesús Sulbarán, whose collaboration made the execution of this work possible.
REFERENCES
Alvera-Azcárate, A., A. Barth and R.H. Weisberg. 2009. A nested model of the Cariaco Basin (Venezuela): description of the basin’s interior hydrography and interactions with the open ocean. Ocean Dynamics, 59: 97-120. [ Links ]
Alvera-Azcárate, A ., A. Barth, R.H. Weisberg, J.J. Castañeda, L. Vandenbulcke and J.M. Beckers. 2011. Thermocline characterization in the Cariaco basin: A modeling study of the thermocline annual variation and its relation with winds and chlorophyll-a concentration. Cont. Shelf Res., 31: 73-84. [ Links ]
Alvites Gutiérrez, D.A. 2016. Variabilidad espacial y calcificación de las comunidades de cocolitofóridos en el sistema de afloramiento costero frente al Callao-Perú. Tesis Ciencias del Mar, Univ. Peruana Cayetano Heredia, Perú. 150 p. [ Links ]
Astor, Y.M., L. Lorenzoni, R. Thunell, R. Varela, F. Muller-Karger, L. Troccoli, G.T. Taylor, M.I. Scranton, E. Tappa and D. Rueda. 2013. Interannual variability in sea surface temperature and fCO2 changes in the Cariaco Basin. Deep-Sea Res. II, 93: 33-43. [ Links ]
Balech, E. 1977. Introducción al fitoplancton marino. Editorial Universitaria de Buenos Aires, Buenos Aires. 211 p. [ Links ]
Beaufort, L., I. Probert, T. de Garidel-Thoron, E.M. Bendif, D. Ruiz-Pino, N. Metzl, C. Goyet, N. Buchet, P. Coupel, M. Grelaud, B. Rost, R.E.M. Rickaby and C. de Vargas. 2011. Sensitivity of coccolithophores to carbonate chemistry and ocean acidification. Nature, 476: 80-83. [ Links ]
Bérard-Therriault, L., M. Poulin y L. Bossé. 1999. Guide d'identification du phytoplancton marin de l' estuaire et du Golfe du Saint-Laurent. CNRC. Ottawa. 387 p. [ Links ]
Boyer, J., R. Fourqurean and R. Jones. 1997. Spatial characterization of the water quality in Florida Bay and Whitewater Bay by multivariate analyses: Zones of similar influence. Estuaries, 20: 743-758. [ Links ]
Burford, M., R. Rothlisberg and Y. Wang. 1995. Spatial and temporal distribution of tropical phytoplankton species and biomass in the Gulf of Carpentaria, Australia. Mar. Ecol. Progr. Ser., 118: 255-266. [ Links ]
Calvo-Trujillo, A., J. Díaz-Ramos, S. Subero-Pino, L. Charzeddine-Charzeddine, K. Rincones-Reyes, L. Troccoli-Ghinaglia, M. Elguezabal-Méndez, B. Marín y B. Márquez. 2015. Variación a corto plazo del fitoplancton en la bahía de Turpialito, Golfo de Cariaco, Venezuela, durante la época de lluvias. Bol. Inst. Oceanogr. Ven., 54: 13-24. [ Links ]
Caraballo, M. 1982a. El golfo de Cariaco. Parte I. Morfología y batimetría. Estructura y tectonismo reciente. Bol. Inst. Oceanogr. Ven ., 21: 13-35. [ Links ]
Caraballo, M. 1982b. El golfo de Cariaco. Parte IV: Los cambios del nivel del mar. La actividad tectónica y el origen del Golfo. Tipos de costas, perspectivas de hidrocarburos. Bol. Inst. Oceanogr. Ven ., 21: 85-99. [ Links ]
Clarke, K.R. and R.M. Warwick. 2001. Change in marine communities: An approach to statistical analyses and interpretation. 2nd ed. Primer-E, Plymouth, UK. 120 p. [ Links ]
Cloern, J.E., S.Q. Foster and A.E. Kleckner. 2014. Phytoplankton primary production in the world's estuarine-coastal ecosystems. Biogeosciences, 11: 2477-2501. [ Links ]
Cupp, E. 1943. Marine plankton diatoms of North America. Bull. Scripps Inst. Oceanogr., 5, 283 p. [ Links ]
Davis, K.A., N.S. Banas, S.N. Giddings, S.A. Siedlecki, P. MacCready, E.J. Lessard, R.M. Kudela and B.M. Hickey. 2014. Estuary-enhanced upwelling of marine nutrients fuels coastal productivity in the US Pacific Northwest. J. Geophys. Res. Oc., 119: 8778-8799. [ Links ]
Edler, L. and M. Elbrächter. 2010. The Utermöhl method for quantitative phytoplankton analysis: 13-20. In: Bengt, K., C. Cusack and E. Bresnan (Eds.). Microscopic and molecular methods for quantitative phytoplankton analysis. UNESCO, Paris. 110 p. [ Links ]
Ferraz-Reyes, E. 1976. Ciclo anual del fitoplancton en zonas de bancos naturales y de cultivo de mejillón Perna perna en el oriente de Venezuela. Bol. Inst. Oceanogr. Ven ., 15: 119-132. [ Links ]
Ferraz-Reyes, E. 1983. Estudio del fitoplancton de la Cuenca Tuy-Cariaco, Venezuela. Bol. Inst. Oceanogr. Ven ., 22:111-124. [ Links ]
Ferraz-Reyes, E., E. Mandelli y G. Reyes. 1987. Fitoplancton de La Laguna Grande del Obispo, Venezuela. Bol. Inst. Oceanogr. Ven ., 26: 111-124. [ Links ]
Gallegos, C.L. and P.J. Neale. 2015. Long-term variations in primary production in a eutrophic sub-estuary: contribution of short-term events. Est. Coast. Shelf Sci., 162: 22-34. [ Links ]
Gómez-Carvajal, E., J. Díaz-Ramos e I. Sánchez-Suárez. 2000. Abundancia y biomasa del fitoplancton de la playa San Luis, Cumaná, Venezuela (Junio 1995 - Mayo 1996). Ciencia, 8: 41-52. [ Links ]
Goschen, W.S., T.G. Bornman, S.H. Deyzel and E.H. Schumann. 2015. Coastal upwelling on the far eastern Agulhas Bank associated with large meanders in the Agulhas Current. Cont. Shelf Res ., 101: 34-46. [ Links ]
Harrison, P.J., A. Zingone, M.J. Mickelson, S. Lehtinen, N. Ramaiah, A.C. Kraberg and H. Jakobsen. 2015. Cell volumes of marine phytoplankton from globally distributed coastal data sets. Est. Coast. Shelf Sci ., 162: 130-142. [ Links ]
Johnson, R. and D. Wichern. 1992. Applied multivariate statistical analysis. Prentice-Hall, New York, 642 p. [ Links ]
Jury, M.R. 2017. Eastern Venezuela coastal upwelling in context of regional weather and climate variability. Reg. Stud. Mar. Sci., 18: 219-228. [ Links ]
Krebs, C. 1999. Ecological methodology. 2nd ed. Benjamin Cumming, San Francisco. 624 p. [ Links ]
La Barbera-Sánchez, A., J. Gamboa-Márquez y W. Senior. 1999. Fitoplancton del golfo de Cariaco, estado Sucre, Venezuela. Rev. Biol. Trop., 47: 57-63. [ Links ]
Lewandowska, A.M., D.G. Boyce, M. Hofmann, B. Matthiessen, U. Sommer and B. Worm. 2014. Effects of sea surface warming on marine plankton. Ecol. Let., 17: 614-623. [ Links ]
Lewis, M.R. 1992. Satellite ocean color observations of global biogeochemical cycles: 139-153. In: Falkowski, P.G., A.D. Woodhead and K. Vivirito (Eds.). Primary productivity and biogeochemical cycles in the sea. Springer Science, New York, 550 p. [ Links ]
López-Monroy, F. y L. Troccoli-Ghinaglia . 2014. Aproximación sobre la climatología de la isla de Margarita y su importancia en los procesos oceánicos. Saber, 26: 465-471. [ Links ]
Margalef, R. 1972. Regularidades en la distribución de la diversidad del fitoplancton en un área del mar Caribe. Inv. Pesq., 36: 241-264. [ Links ]
Martínez-López, A., R. Cervantes-Duarte, A. Reyes-Salinas y J. Valdez-Holguín. 2001. Cambio estacional de la clorofila “a” en la Bahía de la Paz, B.C.S., México. Hidrobiológica, 11: 45-52. [ Links ]
Novoa, D., J. Mendoza, L. Marcano y J. Cárdenas. 1998. El atlas pesquero marítimo de Venezuela. MAC-SARPA. VECEP. Caracas, 197 p. [ Links ]
Parsons, T., Y. Maita and C. Lally. 1984. A manual of chemical and biological methods of seawater analysis. Pergamon Press. Oxford, 173 p. [ Links ]
Philips, E. and S. Badylak. 1996. Spatial variability in phytoplankton standing crop and composition in a shallow inner-shelf lagoon, Florida Bay. Bull. Mar. Sci., 58: 203-216. [ Links ]
Pinzón-Bedoya, M., A. García-Castellanos y R. Casanova-Rosero. 2007. Seguimiento de la influencia de la marea, condiciones meteorológicas y factores antropogénicos sobre la variabilidad diaria de parámetros fisicoquímicos en la bahía de Tumaco (Colombia). Bistua: Rev. Fac. Cienc. Bás., 5: 5-16. [ Links ]
Pirela-Ochoa, E., L. Troccoli e I. Hernández-Ávila. 2008. Hidrografía y cambios en la comunidad del fitoplancton en la bahía de Charagato, isla de Cubagua, Venezuela. Bol. Inst. Oceanogr. Ven ., 47: 3-16. [ Links ]
Quintero, A., J. Bonilla, L. Serrano, M. Amaro, B. Rodríguez, G. Terejova e Y. Figueroa. 2004. Características ambientales de la bahía de Mochima y adyacencias de la cuenca de Cariaco, Venezuela. Bol. Inst. Oceanogr. Ven ., 44: 123-132. [ Links ]
Raymont, J.E. 2014. Phytoplankton: 203-258. In: Raymont, J.E. (Ed.). Plankton and productivity in the oceans. Oxford, New York, 496 p. [ Links ]
Reynolds, C. 1990. Temporal scales of variability in pelagic environments and the response of phytoplankton. Freshw. Biol., 23: 25-53. [ Links ]
Rivas-Rojas, T., J. Díaz-Ramos , L. Troccoli-Ghinaglia, S. Subero-Pino y A. Márquez. 2007. Variación diaria de algunas variables físico-químicas y de la biomasa del fitoplancton en una playa tropical, Cumaná, estado Sucre, Venezuela. Bol. Inst. Oceanogr. Ven ., 46: 13-21. [ Links ]
Rivera-Tenenbaum, D. 2006. Dinoflagelados e tintinídeos da região central da Zona Econômica Exclusiva Brasileira: guia de identificação. Mus. Nac., Rio de Janeiro, 287 p. [ Links ]
Rodríguez-Centeno, M., J. Díaz-Ramos , L. Charzeddine-Charzeddine , S. Subero-Pino y L. Troccoli-Ghinaglia. 2010. Biomasa y abundancia del fitoplancton en la isla La Tortuga, Dependencia Federal, Venezuela. Bol. Inst. Oceanogr. Ven ., 49: 77-86. [ Links ]
Rueda-Roa, D.T., T. Ezer and F.E. Muller-Karger. 2018. Description and mechanisms of the mid-year upwelling in the Southern Caribbean Sea from remote sensing and local data. J. Mar. Sci. Eng., 6(2): 36. [ Links ]
Rueda-Roa, D.T ., T. Ezer and F.E. Muller-Karger. 2018. Description and mechanisms of the mid-year upwelling in the Southern Caribbean Sea from remote sensing and local data. J. Mar. Sci. Eng ., 6(2): 36. [ Links ]
Salazar-Gómez, I., J. Díaz-Ramos , K. Rincones-Reyes , L. Charzeddine-Charzeddine , S. Subero-Pino , L. Troccoli-Ghinaglia, B. Márquez , B. Marín , A. Márquez y D. Hernández. 2011. Cambios diarios de la biomasa fitoplanctónica en la bahía de Mochima, Venezuela, durante la época de lluvias. Bol. Inst. Oceanogr. Ven ., 50: 69-77. [ Links ]
Sánchez-Suárez, I. 1994. Ecología y dinámica del fitoplancton en un arrecife coralino. Un estudio en los islotes Dos Mosquises, Parque Nacional Archipiélago Los Roques, Venezuela. Tesis. Doctorado. Facultad de Ciencias. Escuela de Biología. Universidad Central de Venezuela, Caracas, 152 p. [ Links ]
Shang, S.L., C.Y. Zhang, H.S. Hong, S.P. Shang and F. Chai. 2004. Short-term variability of chlorophyll associated with upwelling events in the Taiwan Strait during the southwest monsoon of 1998. Deep Sea Res. Part II: Trop. Stud. Oceanogr., 51: 1113-1127. [ Links ]
Soto P.G., L. Troccoli , J.R. Díaz, G. Martínez y R. Crescini. 2015. Variabilidad a corto plazo de la hidrografía y fitoplancton en la Ensenada de Turpialito, Venezuela. Bol. Inst. Oceanogr. Ven ., 54: 125-137. [ Links ]
Taylor, G., F. Muller-Karger, R.C. Thunell, M.I. Scranton , Y. Astor, R. Varela , L. Troccoli-Ghinaglia, L. Lorenzoni , K. A. Fanning, S. Hameed and O. Doherty. 2012. Ecosystem responses in the southern Caribbean Sea to global climate change. Proc. Nat. Acad. Sci., 109: 19315-19320. [ Links ]
Ter Braak, C. and P. Verdonschot. 1995. Canonical correspondence analysis and related multivariate methods in aquatic ecology. Aq. Sci., 57: 255-289. [ Links ]
Tomas, C. 1997. Identifying marine diatoms and dinoflagellates. Academic Press, New York. 858 p. [ Links ]
Zhang, Z., R. Lowe, G. Ivey, J. Xu and J. Falter. 2016. The combined effect of transient wind-driven upwelling and eddies on vertical nutrient fluxes and phytoplankton dynamics along Ningaloo Reef, Western Australia. J. Geophys. Res. Oc., 121: 4994-5016. [ Links ]
Received: December 12, 2017; Accepted: July 11, 2018
 Este es un artículo publicado en acceso abierto bajo una licencia Creative Commons
