


Services on Demand
Journal
Article
 text in
  Spanish (pdf)
 Article in xml format
 Article references
 Send this article by e-mail
Indicators
-
 Cited by SciELO
 -
 Access statistics
Related links
-
 Cited by Google
 -
 Similars in
SciELO
Similars in
SciELO -
 Similars in Google
Share

 Permalink
Boletín de Investigaciones Marinas y Costeras - INVEMAR
Print version ISSN 0122-9761
Bol. Invest. Mar. Cost. vol.48 no.1 Santa Marta Jan./June 2019 Epub Aug 30, 2019
https://doi.org/10.25268/bimc.invemar.2019.48.1.758
Research Articles
Long-term variation (2002-2016) in mesozooplankton density and composition indicates a regime change on Margarita Island (Venezuela)
1 Museo Marino de Margarita & Universidad de Oriente (Nueva Esparta) Venezuela. agomezgaspar@yahoo.com.
In the east of Margarita Island (Venezuela), the composition and density of mesozooplankton were studied for 15 years (2002 to 2016) in two fixed stations five miles from the coast. Samples (total 655) collected biweekly by hauls using net with a diameter of 1.7 m and a length of 3.5 m (mesh size of 400 microns) towed horizontally at a depth of 10 to 15 m for 20 minutes. The abundance of the main planktonic groups (21) was estimated by their density (ind/m3) by direct counting. In 13 groups: copepods, cladocerans, sergestoids Lucifer, brachyurans zoea, chaetognaths, mollusk larvae, cirripede larvae, penaeid mysis, pteropods and in the gelatinous plankton (salps, appendicularians, jellyfish, siphonophores) during the periods 2002-2004 and 2014-2016, lower values of annual density and representation were found, while in 2005-2013 the values were notoriously higher. The sardine eggs deviate from the indicated trend, since they were more abundant in years 2002-2004 and 2014-2016 and were lower in density between 2005 and 2013. This trend was more notable in its representation (%) in mesozooplankton. Due to the greater abundance of 13 zooplankton groups and their total density, it is confirmed that a regime shift occurred affecting ecosystem services such as sardine fishing, generating an approximately 10-year long crisis.
KEYWORDS: Zooplankton; Abundance; Composition; Regimen shift; Venezuela
En el este de isla Margarita (Venezuela) durante 15 años (2002 a 2016) se estudió la densidad y composición del mesozooplancton en dos estaciones fijas a cinco millas de la costa. Un total de 655 muestras se colectaron utilizando cada 15 días una red con diámetro de 1.7 m y longitud de 3.5 m (abertura de malla de 400 micras) arrastrada horizontalmente a profundidad de 10 a 15 m durante 20 minutos. La abundancia de 21 grupos planctónicos se estimó por su densidad (ind/m3) mediante contaje directo. En 13 grupos: copépodos, cladóceros, sergestidos Lucifer, zoeas de brachiura, chaetognatos, larvas de moluscos, larvas de cirripedio, mysis de peneidos, pterópodos y en el plancton gelatinoso (salpas, apendicularias, medusas, sifonóforos) se encontraron menores valores de densidad anual y de representación durante los períodos 2002-2004 y 2014-2016 mientras que en el período 2005-2013 sus valores fueron notoriamente mayores. Los huevos de sardina se apartan de la tendencia indicada, pues fueron más abundantes en 2002-2004 y 2014-2016 y tuvieron menor densidad y representación entre 2005 y 2013. La mayor abundancia de 13 grupos del mesozooplancton sugiere que ocurrió un cambio de régimen que afectó los servicios del ecosistema como la pesca de sardina, generando crisis pesquera durante aproximadamente 10 años.
PALABRAS CLAVE: Zooplancton; Abundancia; Composición; Cambio régimen; Venezuela
INTRODUCTION
In zooplankton, long-term time series (>10 years) provide information on how to understand the pelagic ecosystem and allow comparisons to assess changes and determine possible causes of time variations (Richardson, 2008; Church et al., 2013). To describe the different configurations of populations, communities or the ecosystem and thus their variations, the terms "regime change" is used to indicate the modifications in zooplankton composition and abundance (Möllman et al., 2015). As such, the change of ecological regime refers to the variation in the community and/or in species structure that are maintained for some time (Sheffer and Carpenter, 2003).
In the pelages of the photic zone, the trophic importance of plankton is fundamental (Roemmich and McGowan, 1995; Beaugrand, 2015), and it responds quickly to environmental changes, especially zooplankton, which is considered an indicator of climatic effects (Hays et al., 2005)- This explains why the temperature in surface waters affects plankton physiology, growth, height and intergenerational time (Peters, 1983; Mauchline, 1998). Furthermore, wind turbulence alters individual behavior, metabolism and trophic relationships (Mackenzie and Legget, 1991; Margalef, 1997; Alcaraz, 1997), resulting in climate impacting the entire ecosystem.
The abundance of plankton groups, their diversity and species assemblage report the state of the pelagic ecosystem (Beaugrand, 2005) better than the physical variables do (Perry et al., 2004). Environmental changes cause changes in zooplankton (Mackas et al., 2001; Beaugrand and Reid, 2003) and indicate regime change (De Young et al., 2008; Scheffer, 2009; Mölmann and Diekmann, 2012; Möllman et al, 2015) as presented worldwide (Hare and Mantua, 2000; Oguz et al., 2003; Peterson and Schwing, 2003; Alheit and Niquen, 2004; Cury and Shannon, 2004; Alheit et al.) Ecosystem modification is not always pronounced, but may be mild and/or persistent, with variation in feedback and notable changes in services (Rocha et al., 2015), such as the collapse of fisheries (Worm et al., 2006; Jiao, 2009).
The Sardinella aurita sardine is included in the group of so-called "small pelagic" fish of notable trophic importance as food for predatory fish, birds, and mammals (Cury et al., 2000; Pikitch et al., 2014). It abounds in the upwelling ecosystems where it consumes plankton (Nikolioudakis et al., 2015). It is an omnivorous species that changes from particulate-feeding to filter-feeding (James, 1987; Van der Lingen et al., 2006; Garrido et al., 2007), has a short life cycle, and its populations have marked temporal fluctuations as a rapid response to changes in environmental conditions (Alheit et al., 2009; Deyle et al., 2013).
The most important fishing resource in Venezuela is the S. aurita sardine, which has been exploited for 90 years. Its capture began in 1927 (Guzmán et al., 2003) and in 1934; it began to be processes (canned) on Margarita Island (Gómez et al., 2008, 2014; Gómez, 2018). In 2003-2004, the national catch fluctuated around 200,000 tons. In 2005, it decreased appreciably giving rise to a sardine crisis lasting approximately 10 years, until, in 2016, the catches showed a relative recovery, reaching 100,000 tons (Insopesca inf. pers.). It is fished in the northeast of the country in Sucre and Nueva Esparta, in the latter of which, catches were 100,000 tons at the beginning of the century, decreasing by 50% by 2005 and 92% by 2006 (Gómez, 2006; Gómez et al., 2008) and continuing to decline in subsequent years (Gómez, 2015) until 2016 when around 42,000 tons were fished (Aprosardina. com. pers.). The sardine crisis is attributed to fishing communities for overfishing (González et al., 2007; Rueda, 2012; Mendoza, 2015), but ecological causes have been alluded to since the beginning of the crisis (Gómez, 2006, 2007; Gómez et al., 2008). Also, regional fertility decreased (Taylor et al., 2012; Gómez and Barceló, 2014; Gómez et al., 2014, 2012) affecting the sardine population, as has occurred in other marine areas with small pelagic fish resources.
The east of Margarita Island is an important area of capture for the main Venezuelan fishing resource, but since 2005, fishing has declined sharply, initiating a sardine crisis. Considering that this resource feeds on plankton, it was considered important to study the long-term density and composition of mesozooplankton (15 years), in order to better understand the regional ecology.
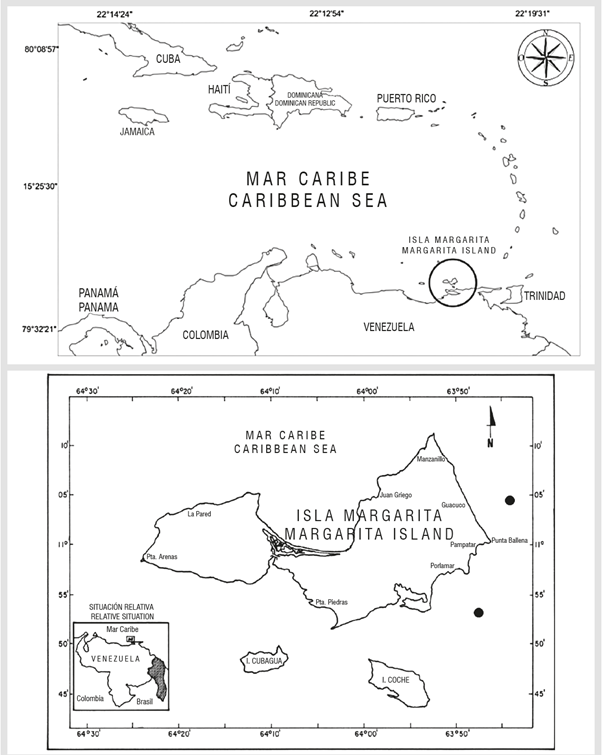
STUDY AREA
The northeastern region of Venezuela (Figure 1) includes the states of Sucre and Nueva Esparta, the latter formed by the islands Margarita, Coche, and Cubagua. It is the most productive marine region of the Caribbean Sea (Gómez, 1996. 2001; Rueda, 2012) mainly during the first months of the year due to the upwelling of subtropical waters, which, in turn, are the object of numerous oceanographic investigations (Gómez and Barceló, 2014). Margarita Island is located in the center of the regional upwelling (Gómez, 1996); it is surrounded by waters with exceptional productivity that give rise to a considerable fishing wealth (Margalef, 1965; Gómez, 2001).
MATERIALS AND METHODS
From mid-2002 to December 2016, two stations (Figure 1) located five miles off the eastern coast of Margarita (11° 03' 19'' N - 63° 45' 53'' W y 10° 52' 13'' N - 63° 50 29'' W), both with depths of up to 30 m were visited biweekly.
Samples were taken between 5:30 and 10 pm by hauls using net with a diameter of 1.7 m and a length of 3.5 m (mesh size of 400 microns) towed horizontally at a depth of 10 to 15 m for 20 minutes. It was estimated that an approximate volume of 650 m3 of water was filtered in each trawl (depending on the distance travelled by the vessel). In the first years, a flow meter was used to confirm relative constancy in the volume by trawl time and by precise field marks, for which all were adjusted to the same nominal volume. This situation is frequent in long time series such as the well-known WEC (West English Channel) off Plymouth, dating back to the early 20th century (Blackett et al., 2014). The samples are kept (in 5% formol) in the Margarita Marine Museum.
Using a Folsom plankton fractionator, the sample was subdivided into two parts. One was used to estimate the composition and density of the main zooplankton groups by means of a stereoscopic microscope (Zeiss M7), observing at least 10% of the known volume sub-sample extracted with a Stempel pipette, according to general guidelines (Boltovskoy, 1981). The other half of the sample was used to determine the total abundance (density, sedimented volume and dry weight) of zooplankton in the process. The results were compared by means of multivariate analysis and a Multiple Range Test and homogeneity of groups of years was determined. The statistical program Statgraphics® was used. The quotient of the square of the variation on total average was applied as a normality test. In one case, logarithmic transformation was performed (log n+1). Amphipods were excluded due to their low occurrence in the samples.
RESULTS
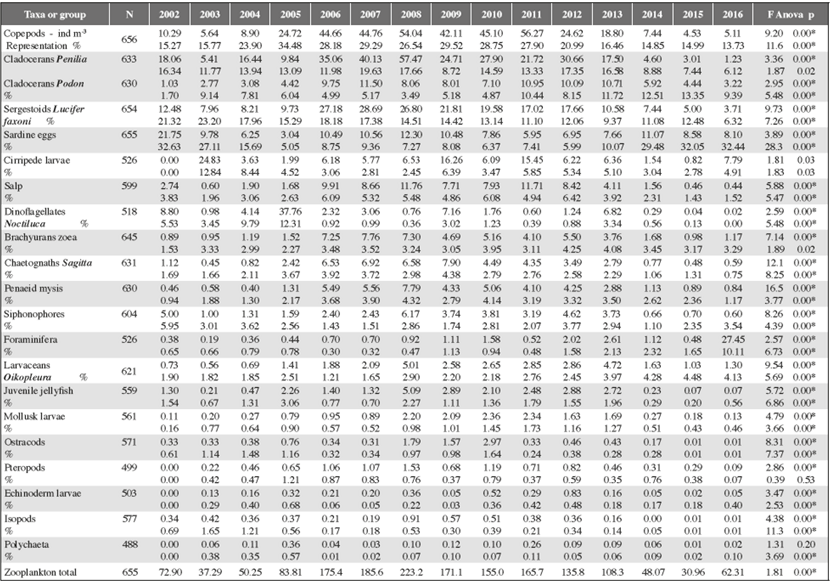
Sampling was carried out over 15 years (20022016), and 655 mesozooplankton samples were analyzed. The simple multifactorial variance analysis with transformed data indicated significant statistical difference between years of study (p < 0.01), but not between stations, which is why they were analyzed together. In 21 zooplankton groups, the density (ind/m3) and the percentage representation in the overall composition were quantified, as were the annual average and standard errors. Table 1 shows the average and the Anova between the years.
Table 1 Annual density (ind / m3) and percentage representation (%) of nocturnal zooplankton groups during 15 years of sampling in the southeast of Isla Margarita (Venezuela) and Anova (values F and p) between years of study (p<0,01 *significant). At the end the total zooplankton density.
Abundance of main groups
Copepods: the average annual density fluctuated between 4.53 and 56.27 ind/m3 (total 26.47 ± 2.54). Annual averages were lower in the years 2002-2004 and 2014-2016 (4.53 to 10.29 ind/m3), and higher (18.80 to 56.27 ind/m3) in the 2006 - 2013 period (Table 1). This interannual trend is generalized in most of the groups studied and is shown in Figure 2A. In addition, the Multiple Range Test confirms that the years 2002, 2003, 2004, 2013, 2014, 2015 and 2016 form a group with the lowest averages; 2005 and 2012 presented a break in the trend, and another group formed by years 2006, 2007, 2008, 2009, 2010 and 2011 showed higher averages. The annual average for zooplankton ranged between 13.73 to 34.48 % (total 22.71 ± 0.80). Annual averages were lower in the years 2002-2004 and 2014-2016 (up to 23.90%), and higher for 2006 and 2013 (up to 34.48%).
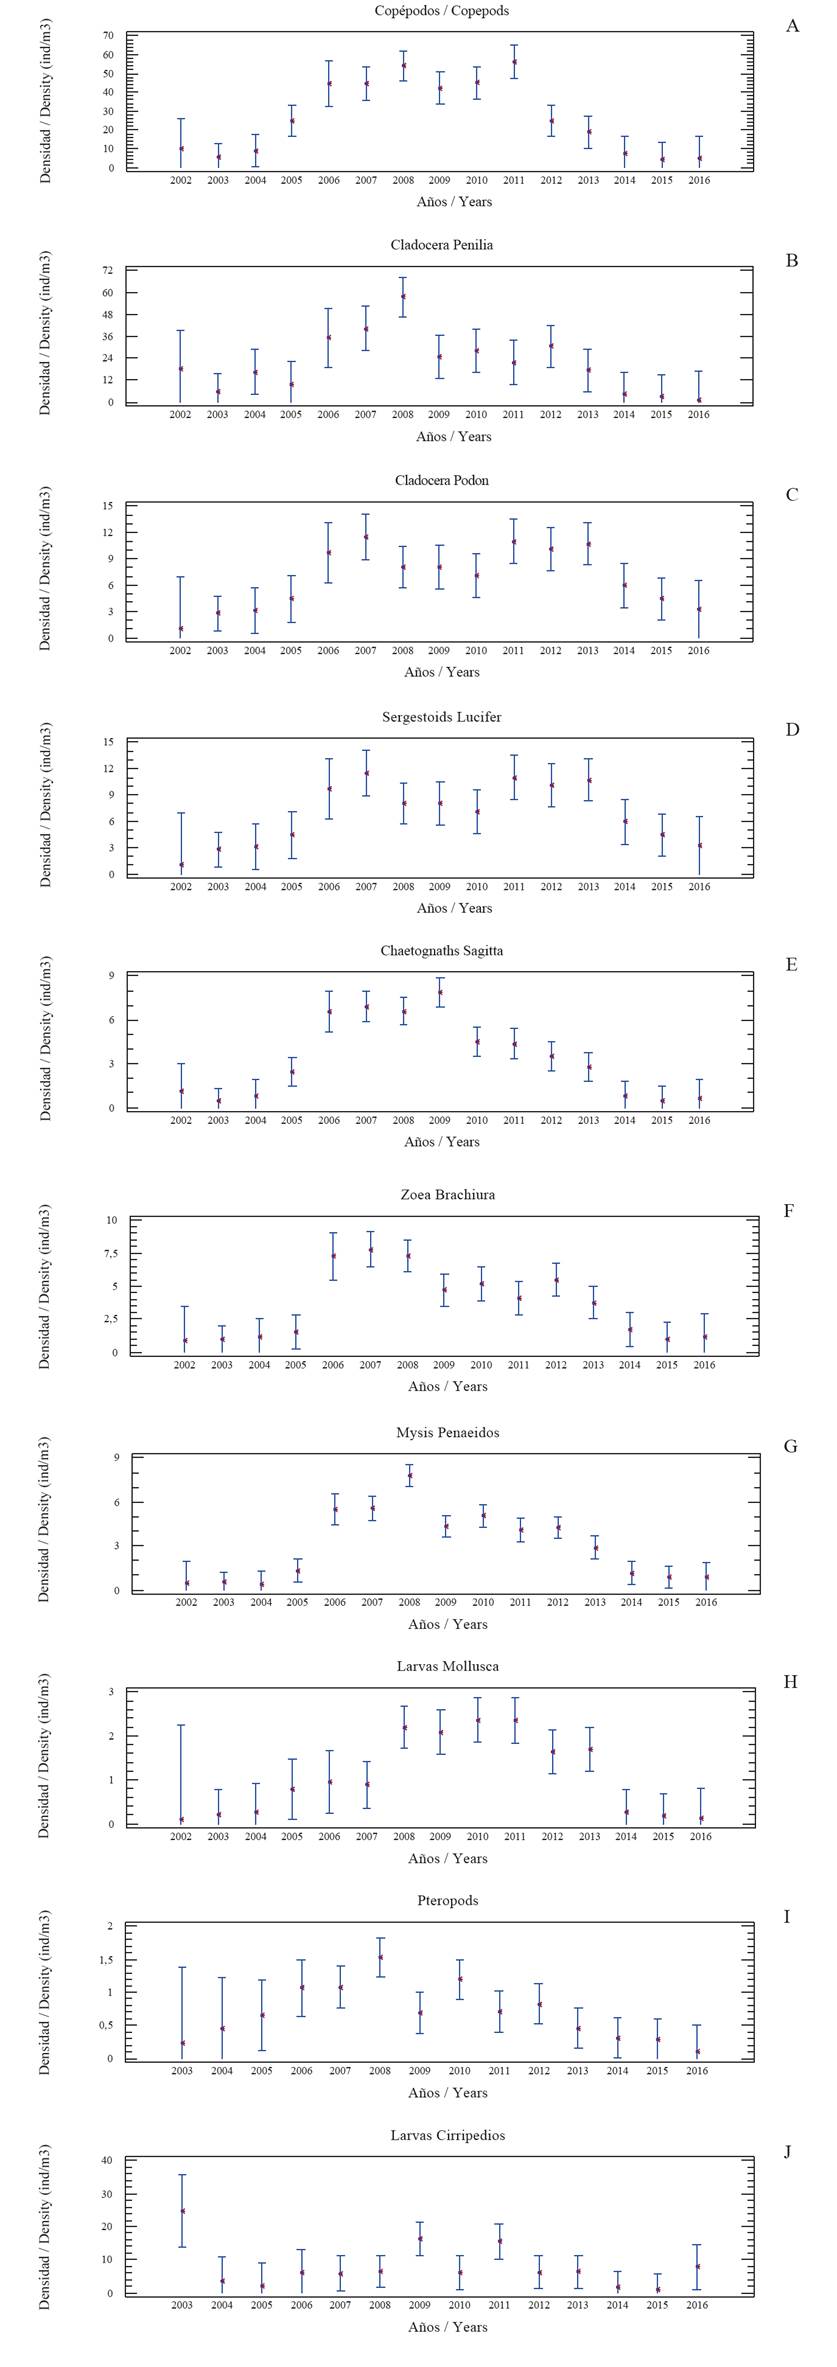
Figure 2 Annual abundance (ind/m3) of mesozooplankton east of Margarita Island, Venezuela (2002-2016). The figure shows averages (points) and confidence intervals (95%).
Cladocerans Penilia: the average annual density fluctuated between 1.23 and 57.47 ind/m3 (total 20.92 ± 3.48). Annual averages were lower in the years 20022005 and 2014-2016 (up to 18.06 ind/m3) and higher (up to 57.47) between 2006 and 2013 (Table 1). The trend is shown in Figure 2B. The Multiple Range Test shows that annual averages were lower in the years 2003, 2005. 2014, 2015 and 2016 and higher for the group made up by the years 2002, 2004, 2006, 2007, 2008, 2009, 2010, 2011, 2012 and 2013. The annual representation in zooplankton ranged between 6.12 and 17.66 % (total 12.56 ± 1.02).
Cladocerans Podon: the average annual density ranged between 1.03 and 11.50 ind/m3 (total 6.74 ± 0.77). Annual averages were lower in the years 2002-2004 and 2014-2016 (up to 5.92 ind/m3) and higher (up to 11.50) between 2006 and 2013 (Table 1). The trend is shown in Figure 2C. The Multiple Range Test indicates that annual averages were lower for the group made up of years 2002, 2003, 2016, 2004 and 2005 and higher for the group for 2014, 2006, 2008, 2010, 2009, 2011, 2012 and 2013. Annual representation in zooplankton ranged between 1.70 and 13.35% (total 7.60 ± 0.60).
Sergestoids Lucifer faxoni: the average annual density fluctuated between 3.71 and 28.69 ind/m3 (total 14.92 ± 1.04). Annual averages were lower in the years 2002-2004 and 2014-2016, (up to 12.48 ind/m3) and higher (up to 28.19) between 2006 and 2012 (Table 1). The trend is shown in Figure 2D. Multiple Range Test indicates that annual averages were lower for the group made up of years 2016, 2015, 2014, 2013, 2005, 2004, 2003 and 2002, and higher for the group formed by 2006, 2007, 2008, 2009, 2010, 2011 and 2012. Annual representation in zooplankton fluctuated between 6.32 and 23.20% (total 14.52 ± 0.65).
Chaetognaths Sagitta: the average annual density fluctuated between 0.48 and 7.90 ind/m3 (total 3.31 ± 0.29). Annual averages were lower in the years 2002-2004 and 2014-2016 (up to 1.12 ind/m3) and higher in (up to 7.90) between 2005 and 2013 (Table 1). The trend is shown in Figure 2E. The Multiple Range Test indicates that annual averages were lower for the group made up of years 2002, 2003, 2004, 2014, 2015, and 2016; 2005 and 2013 presented a break in the trend, and averages were higher for the 2006 to 2012 period. Annual representation in zooplankton ranged between 0.75 to 4.38 % (total 2.51 ± 0.14).
Brachyurans zoea: the average annual density ranged between 0.89 and 7.76 ind/m3 (total 3.59 ± 0.37). Annual averages were lower in the years 2002-2005 and 2014-2016 (up to 1.68 ind/m3) and higher (up to 7.76) between 2006 and 2013 (Table 1). The trend is shown in Figure 2F. The Multiple Range Test indicates that annual averages were lower for the group made up of years 2003, 2004, 2005, 2014, 2015 and 2016, (up to 1.68 ind/m3) and higher for the 2006, 2007, 2008, 2009, 2010, 2011, 2012 and 2013 group (up to 7.76). The trend is shown in Figure 2F. Annual representation in zooplankton ranged between 0.01 to 4.25% (average 3.25 ± 0.16).
Penaeid mysis: the average annual density fluctuated between 0.40 and 7.79 ind/m3 (total 3.00 ± 0.23). Annual averages were lower in the years 2002-2004 and 2014-2016 (up to 1.13 ind/m3) and higher (up to 7.79) between 2005 and 2013 (Table 1). The trend is shown in Figure 2G. The Multiple Range Test indicates that annual averages were lower for the group made up of years 2004, 2002, 2003, 2016, 2015 and 2014; 2005 and 2013 presented a break in the trend, and averages were higher for the group including the 2006 - 2012 period. Annual representation in zooplankton ranged between 0.94 and 4.32% (total 2.75 ± 0.20).
Mollusk (larvae): the average annual density fluctuated between 0.11 and 2.36 ind/m3 (total 1.07 ± 0.20). Annual averages were lower in the years (up to 0.27 ind/ m3) in 2002-2004 and 2014-2016, and higher (up to 2.36) between 2005 and 2013 (Table 1). The trend is shown in Figure 2H, and is coherent with the Multiple Range Test (transformed log n+1) because the years 2016, 2002, 2015, 2004, 2014, 2003 and 2004 form a group with lower averages and another group formed by 2006, 2013, 2012, 2009, 2011, 2008 and 2010 with higher averages. Annual representation in zooplankton ranged between 0.16 and 1.73% (total 0.84 ± 0.10).
Pteropods: the average annual density fluctuated between 0.09 and 1.53 ind/m3 (total 0.68 ± 0.20). Annual averages were lower in the years 2003 to 2005 and 2014 to 2016 (up to 0.65 ind/m3), and higher (up to 1.53) between 2006 and 2013 (Table 1). Figure 2I shows the indicated trend which coincides with the Multiple Range Test for which indicates that annual averages were lower for the group made up of years 2003, 2004, 2005, 2014, 2015 and 2016 and another group formed by the 2006 - 2013 period with higher averages. Annual representation in zooplankton ranged between 0.07 and 1.21% (total 0.59 ± 0.10).
Cirripede: the average annual density ranged between 0.83 and 24.83 ind/m3 (total 7.83 ± 1.68). Annual averages were lower in the years 2004-2005 and 2014-2015 (up to 1.63 ind/m3) and higher (up to 16.26) between 2006 and 2013 (Table 1). The annual average is shown in Figure 2J. Annual representation in zooplankton ranged between 2.45 and 12.84% (total 5.07 ± 0.62).
Sardine eggs: the annual average ranged between 3.04 y 21.75 eggs/m3 (total 9.39 ± 0.63). Annual averages were lower in the years 2004-2005 (up to 6.25 eggs/m3), and higher (up to 12.30) in the 2006 - 2009 period, and between 2010 and 2016 fluctuated between 5.95 and 11.07 eggs/m3 (Table 1). Figure 3A shows the annual variation. It is important to note that it does not present the same trend found for the other groups already mentioned and the Multiple Range Test does not clearly indicate the formation of groups of years. Annual representation in zooplankton ranged between 5.05 and 32.63% (total 15.84 ± 0.79) which is shown in Figure 3B. The highest values were found for 2002, 2003, 2014, 2015 and 2016, and the lowest in the 2005 - 2012 period. The years 2004 and 2013 presented a break in the trend. The Multiple Range Test confirmed the above in the sense that the 2005 - 2013 period forms a group with lower values, whereas another group with higher averages is made up by the years 2003-2004 and 2014-2016.
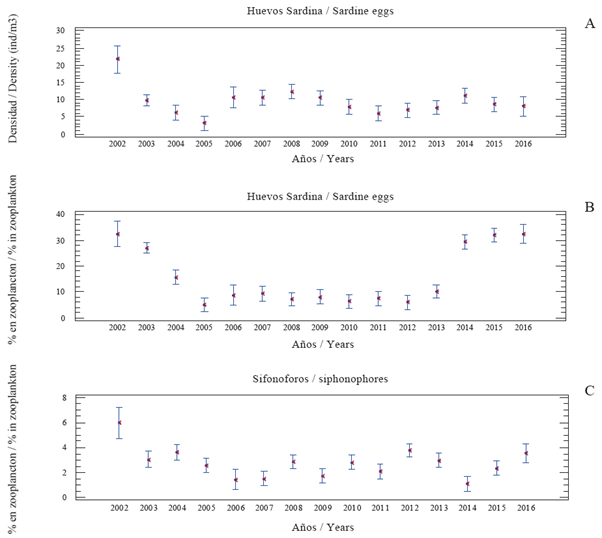
Figure 3 Annual abundance (ind/m3) of sardine eggs (A) and their representation in zooplankton (B) in the east of Margrita Island, Venezuela (2002-2016). Also shown is the representation (%) of siphonophores (C). The figure shows averages (points) and confidence intervals (95%).
Zoogelatinous plankton: is made up of jellyfish, siphonophores, ctenophores, uruchordates and pelagic tunicates or invertebrate chordates that include the salp, doliolidos and pyrosomas (Condon et al., 2012).
Salp: the average annual density fluctuated between 0.44 and 11.76 ind/m3 (total 5.31 ± 0.69). Annual averages were lower in the years (up to 1.90 ind/m3) 2002 to 2005 and 2014 to 2016, and higher (up to 11.76) between 2006 and 2013 (Table 1). The trend is shown in Figure 4A. The Multiple Range Test indicates that annual averages were lower for the group made up of years 2016, 2015, 2014, 2013, 2005, 2004, 2003 and 2002, and higher for 2012, 2011, 2010, 2009, 2008, 2007 and 2006. Annual representation in zooplankton ranged between 1.43 y 6.42% (3.99 ± 0.29 %).
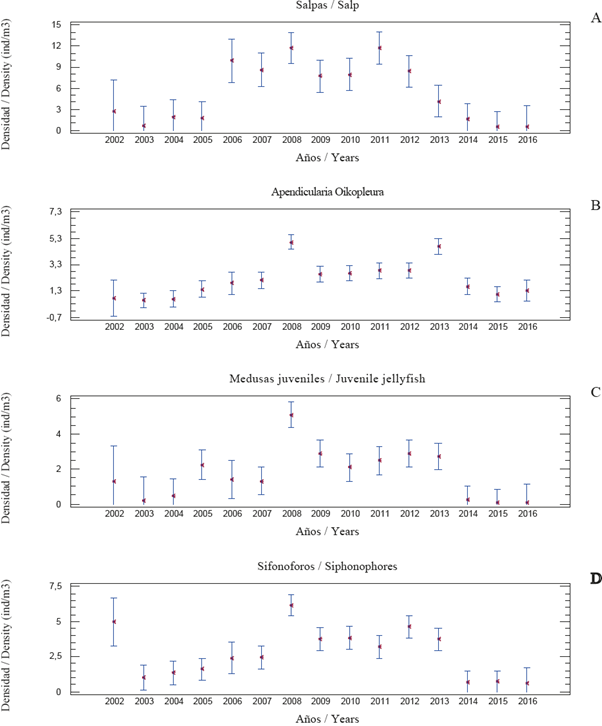
Figure 4 Annual abundance (ind/m3) of gelatinous plankton in the east of Margarita Island, Venezuela (2002-2016). The figure shows averages (points) and confidence intervals (95%).
Larvaceans Oikopleura: the annual average fluctuated between 0.56 and 5.01 ind/m3 (total 2.13 ± 0.18).
Annual averages were lower in the years 2002 - 2004 and 2014 - 2016 (up to 1.63 ind/m3), and higher (up to 5.01) between 2006 and 2013 (Table 1). The trend is shown in Figure 4B and is coherent with the Multiple Range Test forming 2003, 2004, 2002, 2015, 2016, 2005 and 2014 as a group with lower averages, and another group formed by 2006, 2007, 2009, 2010, 2011, 2012, 2013 and 2008 with higher averages. Annual representation in zooplankton ranged between 1.21 and 4.48 % (total 2.69 ± 0.17).
Jellyfish: the average annual density fluctuated between 0.07 and 5.09 ind/m3 (total 1.70 ± 0.26). Annual averages were lower in the years 2002-2004 y 2014-2016 (up to 1.30 ind/m3), and higher (up to 5.09) between 2005 and 2013 (Table 1), The trend is shown in Figure 4C and is coherent with the Multiple Range Test forming a group for 2016, 2015, 2014, 2004, 2003 and 2002 with lower averages and another group formed by the 2005 - 2013 period with higher averages. Annual representation in zooplankton ranged between 0.20 y 3.06% (total 1.28 ± 0.13).
Siphonophores: the annual average ranged between 0.60 y 6.17 ind/m3 (total 2.73 ± 0.24). Annual averages were lower (up to 5.00 ind/m3) in years 20022005 and 2014-2016, and higher (up to 6.17) between 2006 and 2013 (Table 1). The trend is shown in Figure 4D and coincides with the Multiple Range Test, because 2016, 2015, 2014, 2003, 2004 and 2005 form a group with lower averages, and another group is formed by 2007, 2011, 2013, 2009, 2010, 2012, 2002 and 2008 with higher averages. Annual representation in zooplankton ranged between 1.10 and 5.95% (total 2.75 ± 0.17).
In other taxa recorded (isopods, ostracods, foraminifera, echinoderms and polychaetes), the general trend observed in the 13 groups mentioned above is not clearly presented and they showed very low density and representation values in the zooplankton (Table 1).
DISCUSSION
It was considered appropriate to mention the total density of mesozooplankton. The annual average ranged between 30.96 and 223.27 ind/m3 (total 113.73 ± 7.18 ind/ m3), and it should be noted that in years 2002-2004 and 2014-2016 lower averages were found (30.96 to 72.90 ind/ m3) while these were higher (83.81 to 223.2) in the 2006 to 2013 period (Table 1). Figure 5 shows the annual variation, and the Multiple Range Test indicates that 2002, 2003, 2004, 2014, 2015, and 2016 form a homogeneous group; 2005 and 2013 presented a break in the trend, and the 2006 to 2012 period forms another group with homogeneous averages. This also occurs in 13 zooplankton groups as follows: copepods, cladocerans (Penilia and Podon), sergestoids Lucifer, brachyurans zoea, chaetognaths Sagitta, mollusk larva, cirripede, Penaeid mysis, pteropods and gelatinous plankton (salp, larvaceans Oikopleura, jellyfish, siphonophores).
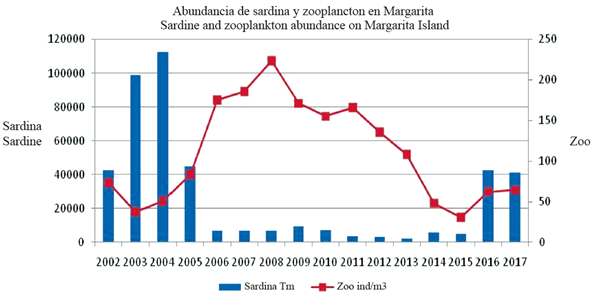
Figure 5 Abundance of zooplankton (mg/m3) and sardine capture (tons) on Margarita Island, Venezuela.
In the east of Venezuela, the first works carried out on zooplankton mention the remarkable abundance of copepods that constitute up to 64.7% (Legaré, 1961b); however, in the east of Margarita Island they have smaller representation and in this work they constituted 22.71% ratifying previous studies in which their representation varied between 22.66% and 33.12% (Gómez and Hernández, 2008; Gómez, 2006). The same occurs with the second most important group, the cladocerans, which represented 20.2%, but in the Gulf of Cariaco they constitute up to 35.93% (Legaré, 1961a). It is therefore confirmed that Margarita Island differs in the percentage composition of the most numerically important groups of regional zooplankton. It has been stated that this is caused by the consumption of species such as sardines (Gómez, 2006), especially during their first stages when they are selective and then when they feed by filtration (Gómez, 2015). The third and fourth groups in terms of importance were the sergestoids Lucifer faxoni and the chaetognaths Sagitta, both with representation and density close to those found in previous works (Hernandez and Gomez, 2014; Gomez and Hernandez, 2008). In nearby areas, Sagitta rank third in zooplankton density (Urosa, 1978). Other groups whose representation and abundance are indicated in the present work (Table 1) constitute less than 10% of mesozooplankton, but it should be mentioned that brachyurans zoea and cirripede larval states were very abundant in some collections, as also cited in other studies (Zoppi, 1961; Legaré, 1961b; Urosa, 1980; Hernández and Gómez, 2014). Thus, in the east of Margarita, the composition and abundance of mesozooplankton differs from previous works of lesser temporal scope which cite that with the exception of copepods, the other groups constitute less than 10% of zooplankton (Cervigón and Marcano, 1965).
It should be noted that during the years 2002 to 2005, the dinoflagellate Noctiluca scintillans was high in density and representation (up to 37.76 ind/m3 and 12.31%) but was very rare during the 2006 to 2016 period (Table 1). This phagotrophic species ingests anything from bacteria up to fish larvae (Nakamura, 1998) and is abundant after the proliferation of diatoms (De la Cruz et al., 2005), 2003; Kiorboe, 1998; Tiselius and Kiorboe, 1998). Therefore, its scarcity in the years of the Venezuelan sardine crisis can be related to weak upwelling intensity, unlike previous decades (1960s) when Noctiluca was very abundant and characteristic in the upwelling area (Margalef, 1965).
The east of Margarita is the most important spawning area of the S. aurita sardine. Its eggs were counted because they are present throughout the year (Gómez, 2015) and dominate widely, compared to those of other species or families that are rare and scarce. Sardine eggs were more abundant in the years 2002-2004 and 2014-2016 and had a lower density during the 2005 to 2013 period. The trend is most clearly observed in its percentage representation, which was high in 2002 and 2003 but much lower during the sardine crisis (years 2005 to 2013). As a result, it is not as abundant and well represented as the 13 mesozooplankton groups mentioned above.
It should also be noted that since 2014, the representation of sardine eggs has increased significantly and in later years a relative recovery of sardine catches occurred (Figure 5). The above is interesting because the high values in the abundance of eggs leads to an increase in sardine catches in the following year, confirming that the best way to qualify the abundance of sardine eggs is by their representation in the plankton. This was proposed previously (Gómez 2015, 2018) in order to have an idea of the potential recruitment of the sardine resource and/or an indirect estimate of its abundance the following year. Sardine eggs and siphonophores show a similar trend in their representation (%) in zooplankton (Figures 3B, 3C), the explanation may be of a trophic type because siphonophores are highly predatory of eggs and larvae of small pelagic (Purcell, 1981; Purcell et al, 2007) as well as chaetognaths and euphausiids (Re, 1987; Krautz et al., 2007; Eloire et al., 2010), which together with ctenophores, siphonophores and jellyfish form the group of carnivorous zooplankton (Hirst et al., 2007).
Since 2005, in the diurnal and nocturnal samples, the abundance of zooplankton has been higher and sardine capture lower (Gómez and Hernández, 2008; Hernández and Gómez, 2014). This may be due to zooplankton having had less predation, unlike the years 2003-2004, when the density was lower due to sardine consumption, which was very abundant in the area (Gómez and Hernández, 2008). Therefore, it is possible to consider that in the 2005 to 2013 period, a possible change of regime occurred, due to the greater abundance of the total zooplankton and that this is also confirmed for 13 mesozooplankton groups.
Regime change modifies trophic ecosystem structure, community composition and abundance, and causes population variation of fish species exploited in response to oceanic changes (Polovina 2005) with variations in zooplankton (Blanco et al., 2006; Mackas et al., 2001; Landry et al., 2001). In the western Atlantic, regime changes lead to increased density of zooplankton (Sameoto, 2001), especially copepods (Kane, 2007) and species substitution (Pershing et al., 2005). In the North Sea, long time series (1970 to 2008) indicate changes approximately every 10 years that affected the plankton community (Alvarez-Fernandez et al., 2012); these fluctuations are caused by environmental variability (Rykaczewsky and Checkley, 2008).
The present study also indicates that the possible regime change occurred over about 10 years, and previous ecological investigations confirmed marked environmental modifications (higher temperature, decreased nutrients, primary production and biomass of phytoplankton) that affected aquatic fertility (Gómez, 2015, 2016; Gómez and Barceló, 2014; Gómez et al., 2012, 2014, 2016). This is a consequence of not very intense upwelling given the weakening of the trade winds (Pinckney et al., 2015; Taylor et al., 2012) during the years of the Venezuelan sardine crisis. It is known that in areas with strong and relatively permanent upwelling, phytoplankton form the predominant diet for sardines, but when upwelling is weak, zooplankton predominates (Blaxter and Hunter, 1982) and it is characteristic that exploited fish populations display fluctuations in biomass due to environmental variability (Rykaczewsky and Checkley, 2008). In addition, in California, studies confirm that sardine fluctuations began to occur 2000 years before commercial fishing commenced (Baumgartner et al., 1992).
During the Venezuelan sardine fluctuation years, the increased abundance of zooplankton (Figure 5) may have been caused by a shortage of filtering fish such as sardines. But it is also possible that planktonic production was different from that of previous years (2003 and 2004) when minimum surface temperatures of 21.6 °C were determined (Gómez, 2006) which indicate the rise of subtropical waters and intense upwelling, as is known (Okuda, 1978.1981) and accepted (Astor et al., 2004. 2003; Gómez, 2006; Gómez et al., 2012, 2008). Intense upwelling favors the larger phytoplankton, which would be appropriate for sardines, especially for young recruits who change their diet from selective to filtering (Gómez 2015, 2018). During the sardine crisis, the emergence was weak in intensity, favoring small-sized phytoplankton, which may be inappropriate as food for sardine recruits and adults, which consequently almost collapsed. In addition, during the 2005-2013 period, the representation of sardine eggs in zooplankton was low (Table 1 and Fig. 3B).
Studies in eastern Venezuela (Estación Cariaco) confirm changes in the composition of regional phytoplankton, with a predominance of small diatoms (Astor et al., 2013) and a reduction of more than five times in the abundance of large diatoms in microplankton (size >20 um). This suggests a reorganization of phytoplankton and is a direct response to the decreased intensity of the upwelling (Pinckney et al., 2015). It is therefore possible that the abundance of small diatoms was important in the sardine crisis, perhaps because, due to its size, the predominant phytoplankton was not suitable for feeding juveniles and adults. But the density of zooplankton was higher, confirming a possible change of ecological regime.
In upwelling in the Pacific Ocean, the average size of phytoplankton cells changes with the El Niño phenomenon, making smaller sizes more common during these events (Polovina and Woodworth, 2013). In California, the size of the zooplankton is related to the intensity of the upwelling, demonstrating how a physical mechanism acts on fish and on an interannual and/or decadal scale relates environmental changes to sardine production (Rykaczewsky and Checkley, 2008). Small cells have a competitive advantage when nutrients are scarce (Margalef, 1978; Falkowski and Oliver, 2007) while excess nutrients favor larger-sized phytoplankton (Moloney and Field, 1991). Thus, the temporal variability of small or large plankton affects planktophagous fish populations (Brosset et al., 2016), as may be the case for sardines in Venezuela.
It can be considered that in the northeast of Venezuela, the waters have not been very fertile since mid-2005 due to weak trade winds between 2006 and 2010, propitiating a reduction in the upwelling and an increased photic zone (Pinckney et al., 2015). This led to a low discharge of the Orinoco River, the spatial contraction of its plume, and the reduction of its regional impact. Also in 2005, the lowest estimates (satellite) of primary production in the eastern Caribbean were obtained (López et al., 2013), coinciding with the most intense drought of the last 100 years in the Amazon region, (air temperatures from 3 to 5 °C higher than normal). The causes of the exceptional drought, not related to El Niño, were driven by the abnormally warm tropical North Atlantic, which reduced the intensity of the northeastern trade winds (Marengo et al., 2008). Drought was more severe in 2010 than it was in 2005 (Lewis et al., 2011).
As a result, it is possible that the critical weather events of 2005 and 2010 also had a marked influence in the area of Venezuela's upwelling. Likewise, in 2007 and 2008 on Margarita Island the waters of the Orinoco River were not perceptible (Gómez, 2016) and until 2012-2013, marine fertility remained low when compared to 2003-2004 (Gómez et al., 2016). Between 2005 and 2014, the variation in environmental conditions caused a regime change that affected sardine abundance for about 10 years.
CONCLUSIONS
For 15 years, the abundance of 21 mesozooplankton groups was determined, in 13 groups: copepods, cladocerans (Penilia and Podon), sergestoids Lucifer, brachyurans zoea, chaetognaths Sagitta, mollusk larvae, cirripede, penaeid mysis, pteropods, and in the gelatinous plankton (salp, larvaceans Oikopleura, jellyfish, siphonophores) higher density and representation values were found in the 2005 to 2013 period, while these were lower in 2002-2004 and 2014-2016.
The temporal variation in the abundance of mesozooplankton and its composition suggest that between 2005 and 2014 there was a regime change in the east of Margarita Island, which affected the Venezuelan sardine resource.
Sardine eggs were abundant in years 2002-2004 and 2014-2016 but less so between 2005 and 2013. This trend is most notable in the composition (%) of zooplankton being under-represented during the sardine crisis (2005 to 2013).
ACKNOWLEDGEMENTS
The sardine fishermen of Morro de Porlamar have been providing boats for sampling -conducted with the help of fisherman Mr. Simplicio Rosales- since 2002. Thanks are due to the Asociación de Productores de Sardina de Nueva Esparta (Aprosardine) and the Instituto Socialista de la Pesca (Insopesca) of the Ministry of Fisheries and Aquaculture for providing sardine catch figures. Many thanks also to the evaluators for their valuable suggestions.
REFERENCES
Alcaraz, M. 1997. Copepods under turbulence: grazing, behavior and metabolic rate. Scientia Marina, 61(Suppl 1): 177-195. [ Links ]
Alheit, J. and M. Niquen. 2004. Regime shifts in the Humboldt Current ecosystem. Prog. Oceanogr., 60: 201-222. [ Links ]
Alheit, J ., C. Möllmann, J. Dutz, G. Kornilovs, P. Loewe, V. Mohrholz and N. Wasmund. 2005. Synchronous ecological regime shifts in the central Baltic and the North Sea in the late 1980s. ICES J. Mar. Sci., 62: 1205-1215. [ Links ]
Alheit, J ., C. Roy and S. Kifani. 2009. Decadal-scale variability in populations. 64-87 p. In: Checkley, D., J. Alheit, Y. Oozeki, C. Roy (Eds.). Climate change and small pelagic fish. Cambridge University Press, Cambridge. 392 p. [ Links ]
Alvarez-Fernández, S., H. Lindeboom and E. Meesters. 2012. Temporal changes in plankton of the North Sea: community shifts and environmental drivers. Mar. Ecol. Prog. Series, 462: 21-38. [ Links ]
Astor, Y., F. Muller-Karger y M. Scranton. 2003. Seasonal and interannual variation in the hydrography of the Cariaco Basin: implications for basin ventilation. Continental Shelf Res., 23: 125-144. [ Links ]
Astor, Y ., F. Muller-Karger , R. Bohrer, L. Troccoli y J. García. 2004. Variabilidad estacional e interanual del carbono inorgánico disuelto y nutrientes en la fosa de Cariaco. Mem. Soc. Cienc. Nat. La Salle., 161-162: 235-252. [ Links ]
Astor, Y ., L. Lorenzoni, R. Thunell, R. Varela, F. Muller, L. Troccoli , G. Taylor, M. Scranton , E. Tappa and D. Rueda. 2013. Interannual variability in sea surface temperature and fCO2 changes in the Cariaco Basin. Deep Sea Research Part II, 93: 33-43. [ Links ]
Baumgartner, T., A. Soutar and V. Ferreira-Bartrina.1992. Reconstruction of the history of Pacific sardine and northern anchovy populations over the past 2 millennia from sets of the Santa-Barbara Basin, California. CalCOFI Rep., 33: 24-40. [ Links ]
Beaugrand, G. 2005. Monitoring pelagic ecosystems using plankton indicators. ICES J. Mar. Sci ., 62: 333-338. [ Links ]
Beaugrand, G. 2015. Theoretical basis for predicting climate-induced abrupt shifts in the oceans. Phil. Trans. R. Soc. B 370, 20130264. (doi:10.1098/ rstb.2013.0264). [ Links ]
Beaugrand, G. and P. Reid. 2003. Long-term changes in phytoplankton, zooplankton and salmon linked to climate change. Global Change Biology, 9: 801-817. [ Links ]
Boltovskoy, D. 1981. Atlas del zooplancton del Atlántico Sudoccidental y métodos de trabajo con el zooplancton marino. INIDEP, Mar del Plata. 936 p. [ Links ]
Blackett, P. Licantro and S. Coombs. 2014. Long-term variability of the siphonophores Muggiaea atlantica and M. kochi in the Western English Channel. Prog. Oceanogr ., 128: 1-14. [ Links ]
Blanco, L., F. Alvarez and J. Cabal. 2006. Changes in the zooplankton community associated with the hydrography off the northwestern Iberian Peninsula. ICES J. Mar. Sci ., 63 :799-810. [ Links ]
Blaxter, J. and J. Hunter. 1982. The biology of clupeoid fishes. Adv. Mar. Biol., 20: 1-223. [ Links ]
Brosset, P., B. Le Bourg, D. Costalago, B. Banaru, E. Van Beveren, J. Bourdeix, J. Fromentin, F. Menard and C. Saraux. 2016. Linking small pelagic dietary shifts with ecosystem changes in the Gulf of Lyons. Mar. Ecol. Prog. Series , 554: 157-171. [ Links ]
Cervigón, F. y P. Marcano. 1965. Zooplancton. En: Estudios sobre el ecosistema pelágico del N.E. de Venezuela. Mem. Soc. Cienc. Nat. La Salle , 25(70, 71 y 72): 263-358. [ Links ]
Church, M., M. Lamas and F. Muller . 2013. Sea change: charting the course for biogeochemical ocean time-series research in a new millennium. Deep Sea Research Part II , 93: 2-15. [ Links ]
Condon, R., W. Graham, C. Duarte, K. Pitt, C. Lucas, S. Haddock, K. Sutherland, K. Robinson, M. Dawson, M. Decker, C. Mills, J. Purcell, A. Malej, H. Mianzan, S. Uye, S. Gelcich and L. Madin. 2012. Questioning the Rise of Gelatinous Zooplankton in the World's Oceans. BioScience, 62(2): 160-169. [ Links ]
Cury, P. and L. Shannon. 2004. Regime shifts in upwelling ecosystems: observed changes and possible mechanisms in the northern and southern Benguela. Prog. Oceanogr ., 60: 223-243. [ Links ]
Cury, P ., A. Bakun, R. Crawford, A. Jarre, R. Quiñones, L. Shannon and H. Verheye. 2000. Small pelagiques in upwelling systems: patterns of interaction and structural changes in "waspwaist" ecosystems. ICES J. Mar. Sci ., 57: 603-618. [ Links ]
De la Cruz, J., P. Ajani., H. Middleton and M. Suthers. 2003. Population growth and transport of the redtide dinoflagellate Noctiluca scintillants in the coastal waters off Sydney, Australia, using cell diameter as a tracer. Limnol. Oceanogr., 48: 656-674. [ Links ]
Deyle, E., M. Fogarty, C. Hsieh, L. Kaufman, A. McCall, S. Munch, C. Perreti, H. Ye and G. Sugihara. 2013. Predicting climate effects on Pacific sardine. Proc. Nat. Acad. Sci., USA., 110: 6430-6435. [ Links ]
De Young, B., M. Barange, G. Beaugrand, R. Harris, R. Perry, M. Scheffer y F. Werner. 2008. Regime shifts in marine ecosystems: detection, prediction and management. Trends Ecol. Evol., 23: 402-409. [ Links ]
Eloire, D., P. Sommerfield, D. Conway, C. Halsband, R, Harris and D. Bonnet. 2010. Temporal variability and composition of zooplankton at station 14 in the Western channel: 20 years of sampling. J. Plankton Res., 32: 657-679. [ Links ]
Falkowski, P. and M. Oliver. 2007. Mix and match: How climate selects phytoplankton. Nat. Rev. Microbiol., 5: 813-819. [ Links ]
Garrido, S., A. Marcalo, J. Zwolinsky and C. van der Lingen. 2007. Laboratory investigations on the effect of prey size and concentration on the feeding behavior of sardine Sardinapilchardus. Mar. Ecol. Prog. Series , 330: 189-199. [ Links ]
Gómez, A. 1996. Causas de la fertilidad marina en el nororiente de Venezuela. Interciencia, 21(3): 140-146. [ Links ]
Gómez, A. 2001. Recursos pesqueros: Caribe. Investigación y Ciencia, 301: 36-38. [ Links ]
Gómez, A. 2006. Caracterización ecológica del caladero de pesca más importante de Venezuela (Pampatar-La Isleta, Isla de Margarita). Museo Marino Margarita Inf. Final Fondo Nal Invest. Cient. Técn. Ven. (Fonacit Proy. 2000001372). Min. Cienc. Tecnol, Caracas. 648 p. [ Links ]
Gómez, A. 2007. Producción primaria al sureste de la isla de Margarita, Venezuela. Bol. Inst. Oceanogr. Venezuela. Univ. Oriente, 46 (2): 97-105. [ Links ]
Gómez, A. 2015. Crisis de la pesca de sardina en Venezuela: abundancia de huevos de sardina Sardinella aurita en el este de Isla Margarita. Once años de estudio (2002-2013) y comentarios sobre muestreo, reproducción y desarrollo. Bol. Inst. Oceanogr. Venezuela. 54 (2): 95-108. [ Links ]
Gómez, A. 2016. Densidad de huevos de sardina Sardinella aurita, abundancia de zooplancton e hidrografía en la Península de Araya y sur de Isla Margarita, Venezuela. Bol. Invest. Mar. Cost., 45(1): 57-72. [ Links ]
Gómez, A. 2018. Análisis del manejo de la crisis de sardina Sardinella aurita en Venezuela y comentario sobre artes de pesca y estadísticas. Bol. Invest. Mar. Cost ., 47 (1): 85-106. [ Links ]
Gómez, A. y A. Barceló. 2014. Crisis de la pesca de sardina en Venezuela: hidrografía y nutrientes al este de la isla de Margarita, una década de estudio (2003-2012). Bol. Inst. Oceanogr. Venezuela ., 53(2): 185-203. [ Links ]
Gómez, A . e I. Hernández. 2008. Abundancia interanual del zooplancton nocturno en la costa este de isla Margarita, Venezuela. Bol. Inst. Oceanogr. Venezuela . Univ. Oriente , 47(2): 91-102. [ Links ]
Gómez, A ., E. Izaguirre y O. Gómez. 2008. Ecología de caladeros, aspectos biológicos y pesca (2003-2006) de sardina Sardinella aurita (Pisces: Clupeidae) en Nueva Esparta, Venezuela. Bol. Inst. Oceanogr. Venezuela . Univ. Oriente ., 47(2): 113-128. [ Links ]
Gómez, A ., A. Barceló y E. Mata. 2012. Condiciones hidrográficas (2007-2009) al sur de isla Margarita y Península de Araya como indicio de disminución de la fertilidad regional y posible afectación del recurso sardinero venezolano. Bol. Inst. Oceanogr. Venezuela . 51 (2): 173-186. [ Links ]
Gómez, A ., E. Mata y O. Gómez . 2014. Crisis de la pesca de sardina en Venezuela: variación de la biomasa del fitoplancton en el este de Margarita, una década de estudio (2003-2012). Bol. Inst. Oceanogr. Venezuela ., 53 (1): 25-36. [ Links ]
Gómez, A ., E. Mata y A. Barceló . 2016. Ecología costera al sureste de Isla Margarita, Venezuela (abril 2012 - mayo 2014). Bol. Invest. Mar. Cost ., 45(2): 269-288. [ Links ]
González, W., N. Eslava y E. Gómez. 2007. Parámetros poblacionales de la sardina (Sardinella aurita) del sureste de la Isla de Margarita, Venezuela. Bol. Centro Invest. Biol., Univ. Zulia, Venezuela, 41(4): 457-470. [ Links ]
Guzmán, R., P. Freón y J. Mendoza. 2003. La pesquería de sardina en el oriente de Venezuela, su variabilidad espacio-temporal: periodo 1973-1989. 426-449 p. En: Freón, P. y J. Mendoza (Edits.). La sardina (Sardinella aurita), su medio ambiente y explotación en el oriente de Venezuela. IRD Editions, Paris, 549 p. [ Links ]
Hare, S. y N. Mantua. 2000. Empirical evidence for North Pacific regime shifts in 1977 and 1989. Prog. Oceanogr ., 47: 103-145. [ Links ]
Hays, G., A. Richardson y C. Robinson. 2005. Climate change and marine plankton. Trends Ecol. Evol ., 20: 337-344. [ Links ]
Hernández, I. y A. Gómez. 2014. Patrones de abundancia y composición del zooplancton costero a varias escalas temporales en un ciclo de surgencia estacional en la Isla de Margarita, Venezuela. Interciencia , 39 (2): 122-128. [ Links ]
Hirst, A., D. Bonnet and R. Harris . 2007. Seasonal dynamics and mortality rates of Calanus helgolandicus over two years at a station in the English Channel. Marine Ecology Progress Series, 340: 189-205. [ Links ]
James, A. 1988. Are clupeoids macrophagist herbivorous or omnivorous? A review of the diets of some commercially important clupeids. S. Afr. J. Mar. Sci., 7: 161-177. [ Links ]
Jiao, Y. 2009. Regime shift in marine ecosystems and implications for fisheries management, a review. Rev. Fish Biol. Fish. 19: 177-191. [ Links ]
Kane, J. 2007. Zooplankton abundance trends in Georges Bank, 1977-2004. ICES J. Mar. Sci ., 64: 909-919. [ Links ]
Kasai, H. y T. Ono. 2007. Has the 1998 regime shift also occurred in the oceanographic conditions and lower trophic ecosystem of the Oyashio region? J. Oceanogr., 63: 661-669. [ Links ]
Kiorboe, T. 1998. Intensive aggregate formation with low flux during an upwelling-induced diatom bloom. Limnol. Oceanogr ., 43: 104-116. [ Links ]
Krautz, M., L. Castro and M. González. 2007. Interaction of two key species in the Humbolt current: euphausiid predation on anchoveta eggs estimated by immunoassays. Mar. Ecol. Prog. Ser., 335:175-185. [ Links ]
Landry, M., H. Al-Mutairi, K. Self, S. Christensen and S. Nunnery. 2001. Seasonal patterns in mesozooplankton in abundance and biomass at station ALOHA, Deep-Sea Research Part II, 48: 2037-2061. [ Links ]
Legaré, H. 1961a. Algunos eufausiáceos del Golfo de Paria y Delta del Orinoco, al oriente de Venezuela. Bol. Inst. Oceanogr. 1(1-2): 131-148. [ Links ]
Legaré, H. 1961b. Estudios preliminares del zooplancton en la región de Cariaco. Bol. Inst. Oceanogr ., 1(1-2): 191-218. [ Links ]
Lewis, S. P. Brando, O. Phillips, G. van der Heijden and D. Nepstad. 2011. The 2010 Amazon drought. Science, 331(6017):554. [ Links ]
López, R., J. López, J. Morell, J. Corredor and C. Del Castillo. 2013. Influence of the Orinoco river on the primary production of eastern Caribbean surface waters. J. Geophys. Res. Oceans. 118(8): 4617-4632. [ Links ]
Mackas, D., R. Thomson and M. Galbraith. 2001. Changes in the zooplankton community of the British Columbia continental margin, 1985-1999, and their covariation with oceanographic conditions. Can. J. Fish. Aquat. Sci., 58: 685-702. [ Links ]
Mackenzie, B. and W. Legget. 1991. Quantifying the contribution of small-scale turbulence to the encounter rates between larval fish and their zooplankton prey: effects of wind and tide. Mar. Ecol. Prog. Ser ies , 73: 149-160. [ Links ]
Marengo, J., C. Nobre, J. Tomasella, M. Oyama, G. Sampaio de Oliveira, R. de Oliveira, H. Camargo, L. Alves and I. Brown. 2008. The drought of Amazonia in 2005. J. Climate., 21(3): 495-516. [ Links ]
Margalef, R. 1997. Turbulence and marine life. Scientia Marina , 61(Suppl. 1): 109-123. [ Links ]
Margalef, R . 1978. Life-forms of phytoplankton as survival alternatives in an unstable environment. Oceanol. Acta, 1: 493-509. [ Links ]
Margalef, R. 1965. Composición y distribución del fitoplancton. En: Estudios sobre el Ecosistema Pelágico del N.E. de Venezuela. Mem. Soc. Cienc. Nat. La Salle , 25 (70,71,72): 139-206. [ Links ]
Mauchline, J. 1998. The Biology of Calanoid Copepods. Academic Press, San Diego. 710 p. [ Links ]
Mendoza, J. 2015. Rise and fall of Venezuela industrial and artisanal marine fisheries: 1950-2010. Fisheries Centre. The University of British Columbia. Working Paper Series 2015-27. 15 p. [ Links ]
Möllmann, C. and R. Diekmann. 2012. Marine ecosystem regime shifts induced by climate and overfishing: a review for the Northern Hemisphere. Adv. Ecol. Res., 47: 303-347. [ Links ]
Möllman, C., C. Folke, M. Edwards and A. Conversi. 2015. Marine regime shifts around the globe: theory, drivers and impacts. Phil. Trans. R. Soc ., B370: 20130260. [ Links ]
Moloney, C. and J. Field. 1991. The size-based dynamics of plankton food webs. 1. A simulation-model of carbon and nitrogen flows. J. Plank. Res,13: 1003-1038. [ Links ]
Nakamura, Y. 1998. Biomass, feeding and production of Noctiluca scintillans in the Seto Inland Sea, Japan. J. Plankton Res ., 20: 2213-2222. [ Links ]
Nikolioudakis, N., S. Isauri and S. Somarakis. 2015. Trophodynamics of anchovy in a non-upwelling system: direct comparison with sardine. Mar. Ecol. Prog. Series , 500: 215-229. [ Links ]
Oguz, T., T. Cokacar, P. Malanotte-Rizzoli y H. Ducklow. 2003. Climatic warming and accompanying changes in the ecological regime of the Black Sea during 1990s. Glob. Biogeochem. Cycles, 17: 1088. [ Links ]
Okuda, T. 1978. Condiciones hidroquímicas de las aguas superficiales de la Fosa de Cariaco y áreas adyacentes. FAO Fisheries Report, No. 200: 349-362. [ Links ]
Okuda, T. 1981. Análisis hidroquímicos de la Bahía de Pozuelo y sus áreas adyacentes, Venezuela. Bol. Inst. Oceanogr . Venezuela . 20 (1 y 2): 11-22. [ Links ]
Perry, R., H. Batchelder, D. Mackas, S. Chiba, E. Durbin, W. Greve and H. Verheye . 2004. Identifying global synchronies in marine zooplankton populations: issues and opportunities. ICES J. Mar. Sci ., 61: 445-456. [ Links ]
Pershing, A., C. Greene, J. Jossi, I. O'Brien, J. Broadziak and B. Bailey. 2005. Interdecadal variability in the Gulf of Maine zooplankton community with potential effects on fish recruitment. ICES J. Mar. Sci ., 62: 1511-1523. [ Links ]
Peters, R. 1983. The ecological implications of body size. Cambridge University Press, Cambridge. 330 p. [ Links ]
Peterson, W. and F. Schwing. 2003. A new climate regime in northeast pacific ecosystems. Geophys. Res. Lett., 30: 1896. (doi:10.1029/2003gl017528). [ Links ]
Pikitch, E., K. Rountos, T. Essington, C. Santoraand others. 2014. The global contribution of forage fish to marine fisheries and ecosystems. Fish. Fish., 15: 43-64. [ Links ]
Pinckney, J., C. Benitez, R. Thunell , F. Muller , L. Lorenzoni , L. Troccoli and R. Varela . 2015. Phytoplankton community structure and depth distribution changes in the Cariaco Basin between1996 and 2010. Deep-Sea Resarch Part I, 101: 27-37. [ Links ]
Polovina, J. 2005. Climate variation, regimen shifts, and implications for sustainable fisheries. Bull. Mar. Sci., 76: 233-244. [ Links ]
Polovina, J. and P. Woodworth. 2013. Declines in phytoplankton size in the subtropical oceans estimated from satellite remotely-sensed temperature and chlorophyll 1998-2007. Deep Sea Research Part II , 77-80: 82-88. [ Links ]
Purcell, J. 1981. Dietary-composition and diel feeding patterns of epipelagic siphonophores. Mar. Biol., 65: 83-90. [ Links ]
Purcell, J., S. Uye and W. Lo. 2007. Anthropogenic causes of jellyfish blooms and their direct consequences for humans: a review. Mar. Ecol. Prog. Ser ., 350: 153-174. [ Links ]
Re, P. 1987. Ecology of the planktonic phase of the anchovy Engraulis encrasicholus (Linnaeus, 1758) within Mira estuary (Portugal). Inv. Pesq., (4): 581-598. [ Links ]
Richardson, A. 2008. In hot water: zooplankton and climate change. ICES J. Mar. Sci ., 65: 279-295. [ Links ]
Rocha, J., J. Yletyinen, R. Biggs, T. Blenckner y G. Peterson. 2015. Marine regimen shifts: drivers and impacts on ecosystem services. Phil.Trans. R. Soc., B370: 20130273. [ Links ]
Roemmich, D. y J. McGowan. 1995. Climatic warming and the decline of zooplankton in the California current. Science, 267: 1324-1326. [ Links ]
Rueda, D. 2012. On the spatial and temporal variability of upwelling in the southern Caribbean Sea and its influence on the ecology of phytoplankton and of Spanish sardine (Sardinella aurita). Ph.D. Thesis Univ. South Florida, USA. 168 p. [ Links ]
Rykaczewsky, R. and D. Checkley. 2008. Influence of ocean winds on the pelagic ecosystems in upwelling region. Proc. Nat. Acad. Sci.USA.,105: 1960-1970. [ Links ]
Sameoto, D. 2001. Decadal changes in phytoplankton color index and selected calanoid copepods in continuous plankton recorder data from the Scotian shelf. Can. J. Fish. Aquat. Sci ., 58:749-761. [ Links ]
Scheffer, M. 2009. Critical transitions in nature and society. Princeton, NJ. Princeton University Press. 384 p. [ Links ]
Scheffer, M. and S. Carpenter. 2003. Catastrophic regime shifts in ecosystems: linking theory to observation. Trends Ecol. Evol ., 18:648-656. [ Links ]
Taylor, G., F. Muller -Karger , R. Thunell , M. Scranton , Y. Astor, R. Varela , L. Troccoli , L. Lorenzoni , K. Fanning, S. Hameed and O. Doherty. 2012. Ecosystem responses in the southern Caribbean Sea to global climate change. Proc. Nat. Acad. Sci. USA., 109 (47): 19315-19320. [ Links ]
Tiselius, P. and T. Kiorboe. 1998. Colonization of diatom aggregates by the dinoflagellate Noctiluca scintillans. Limnol. Oceanogr ., 43: 154-159. [ Links ]
Urosa, L. 1978. Fluctuación cualitativa y cuantitativa del Phylum Chaetognata en Golfo de Cariaco, entre 1976 y 1977 y relación con aspectos hidrográficos. Tesis de Postgrado Universidad de Oriente, Instituto Oceanográfico, Cumaná, Venezuela, 112 pp. [ Links ]
Urosa, L. 1980. Nauplii balanomorfos y variación diurna de la temperatura de la ensenada de Turpialito, Venezuela. Bol. Inst. Oceanogr . Venezuela , 19(1-2): 73-92. [ Links ]
Van der Lingen, C., L. Hutchings and J. Field . 2006. Comparative trophodynamics of anchovy Engraulis encrasicolus and sardine Sardinops sagax in the southern Bengala: are species alternations between small pelagic fish trophodynamically mediated?. S. African J. Mar. Sci., 28: 465-477. [ Links ]
Weijerman, M., H. Lindeboom and A. Zuur. 2005. Regime shifts in marine ecosystems of the North Sea and Wadden Sea. Mar. Ecol. Prog. Ser . 298, 21-39. [ Links ]
Worm, B., E. Barbier, N. Beaumont, J. Duffy, C. Folke , B. Halpern, J. Jackson, H. Lotze, F. Micheli, S. Palumbi, E. Sala, K. Selkoe, J. Stachowicz and R. Watson. 2006. Impacts of biodiversity loss on ocean ecosystem services. Science, 314: 787-790. [ Links ]
Zoppi, E. 1961. Distribución vertical del zooplancton en el golfo y extremo Este de la Fosa de Cariaco. Bol. Inst. Oceanogr ., Venezuela, (1): 219-248. [ Links ]
Received: October 29, 2018; Accepted: May 06, 2019
 Este es un artículo publicado en acceso abierto bajo una licencia Creative Commons
