


Services on Demand
Journal
Article
 text in
  Spanish (pdf)
 Article in xml format
 Article references
 Send this article by e-mail
Indicators
-
 Cited by SciELO
 -
 Access statistics
Related links
-
 Cited by Google
 -
 Similars in
SciELO
Similars in
SciELO -
 Similars in Google
Share

 Permalink
Boletín de Investigaciones Marinas y Costeras - INVEMAR
Print version ISSN 0122-9761
Bol. Invest. Mar. Cost. vol.48 no.2 Santa Marta July/Dec. 2019 Epub Dec 11, 2019
https://doi.org/10.25268/bimc.invemar.2019.48.2.767
Research Articles
Evaluation in vitro of biofilm formation with marine bacteria from Colombian Caribbean
1 Universidad Nacional de Colombia - Sede Caribe - Instituto de Estudios en Ciencias del Mar-Cecimar, Atte. Invemar, Calle 25 # 2-55, El Rodadero, Santa Marta, Colombia. sslopezp@unal.edu.co; sezeas@unal.edu.co.
2 Instituto de Investigaciones Marinas y Costeras - Invemar [Marine and Coastal Research Institute]. Calle 25 # 2-55 El Rodadero, Santa Marta, Colombia. javier.gomez@invemar.org.co.
Biofilm formation is an important process for marine bacterial communities because this mechanism favors adaptation to variations in environmental conditions. The objective of this study was to evaluate the biofilm formation of bacteria isolated from marine sediments under in vitro conditions. For this, biofilm quantification assays were performed using two methods, violet crystal and reduction of the XTT dye; In addition, the viability of the bacteria was evaluated by Live / Dead staining. Subsequently, the strains evaluated were identified using the 16S RNA marker. The results showed that the isolates belong to the genus Bacillus, all in different ranges were able to form films and strains B. safensis 64181 and Bacillus sp 64186 were selected which indicated greater production of this. Tests at different temperatures showed that for the strains selected the best temperature was 28 ° C. In addition, a mixed culture was carried out with these isolates, resulting in differences in the density of the biofilm and less changes in its metabolic activity in temperature variation experiments. From the results we can infer that bacterial consortiums can favor resistance to environmental variations in biofilms formed by bacteria of the genus Bacillus.
KEYWORDS: Marine Bacteria; Bacillus; Biofilms; Sediments
La formación de biopelículas es un proceso importante para las comunidades bacterianas marinas debido a que este mecanismo favorece la adaptación a variaciones en las condiciones ambientales. El objetivo de este estudio fue evaluar la formación de biopelículas de las bacterias aisladas de sedimentos marinos en condiciones in vitro. Para esto se realizaron ensayos de cuantificación de biopelículas usando dos métodos, cristal violeta y reducción del colorante XTT; además se evaluó la viabilidad de las bacterias mediante la tinción Live/Dead. Posteriormente las cepas evaluadas fueron identificadas usando el marcador 16S ARN. Los resultados mostraron que los aislados pertenecen al género Bacillus todos en diferentes rangos fueron capaces de formar películas y se seleccionaron las cepas B. safensis 64181 y Bacillus sp 64186 las cuales indicaron mayor producción de esta. Los ensayos a diferentes temperaturas demostraron que para las cepas seleccionadas la mejor temperatura fue de 28°C. Además se realizó un cultivo mixto con estos aislados obteniendo como resultado diferencias en la densidad de la biopelícula y menos cambios en la actividad metabólica de la misma en los experimentos de variación de temperatura. A partir de los resultados podemos inferir que los consorcios bacterianos pueden favorecer la resistencia a variaciones ambientales en las biopelículas formadas por bacterias del género Bacillus.
PALABRAS CLAVES: Bacterias marinas; Bacillus; Biopelículas; Sedimentos
INTRODUCTION
Bacteria exist in the aquatic environment in two forms or states: a) pelagic, free floating, and b) bacteria in biofilms, forming sessile colonies (Nazar, 2007). Biofilms are communities of microorganisms that grow included in a matrix of exopolysaccharides and adhered to an inert surface or living tissue. In principle, the formation of a biofilm is established as part of the processes that can occur in the quorum sensing (QS) mechanism (Díaz et al., 2011). The bacteria maintain a permanent communication between them, within the different environments or microenvironments where they remain and coexist. Communication mechanisms allow them to recognize when a threshold or level of presence is reached to develop new functions, especially social, symbiotic and permanent recognition behavior, useful for new tasks (Nowak, 2009).
Natural biofilms in many environments are often characterized by high cell density and high diversity of microbial species, which allow close cell-cell interactions within or between species, leading to inevitable intra and inter-species interactions, including cooperation and competition (Kolenbrander et al., 2002). These interactions can play very important roles in maintaining microbial homeostasis in a biofilm community (Kuramitsu et al., 2007).
In the colonization processes of submerged clean substrates that involve adhesion, from dissolved molecules, to bacteria, diatoms and invertebrates, some factors are involved that can favor or hinder adhesion; by the driving forces, which can be primary or secondary. The first is related to the relative abundance of each type of molecule and microbiota in the water column (Lau et al., 2002), while the secondary driving forces are the physical, chemical and behavioral interactions between the encrustants. An example of this is the interactions between surface-associated bacteria and invertebrate larvae that seek to settle (Rodríguez and Epifanio, 2000). A punctual case is that of the Hydroides elegans polychaete, which depends on the bacteria for its settlement, which through the production and subsequent expulsion to the medium of communication molecules contribute to the polychaete being able to select the area to settle; the bacteria that have been related to this process are the Gram positive of the genera Bacillus, Brevibacterium, Micrococcus and Staphylococcus; and of the Gram negative of the genera Alteromonas, Pseudoalteromonas and Vibrio (Hadfield, 2011; Lau et al., 2002). The interaction between bacteria and benthic eukaryotes has been demonstrated even with paleontological evidence that reveals a relationship between metazoans and biofilms very early in their evolution; therefore, bacterial signal receptors in invertebrate larvae are very old and possibly unique (Hadfield, 2011).
Bacteria play an important role in marine environments, including participation in the biogeochemical cycles of sulfur, nitrogen and carbon (Paerl and Pinckney, 1996; Hawley et al., 2017) supplying materials and energy at higher trophic levels (Azam et al., 1983; de Carvalho and Caramujo, 2012). Roseobacter species are recognized as the main surface colonizers in aquatic environments, due to their rapid response to the presence of nutrients in the biochemical conditioning stage of the substrate and biofilm formation (Dang et al., 2008). In fact, it has been found that these bacteria are the most important microbes on marine surfaces to initiate colonization; These cells can determine the structure and function of mature biofilms (Dang et al., 2008; Dang and Lovell, 2016). They colonize natural, artificial surfaces, accelerate corrosion (Little et al., 2008), favor biofouling (Cao et al., 2011), and can influence the buoyancy of polyethylene plastic (Lobelle and Cunliffe, 2011).
However, Lee et al. (2018) suggest that in the marine environment the composition of bacterial communities changes over time; the primary colonizers are characterized by being little abundant in it, but fast growing and populations vary according to the surface and available nutrients. For these reasons, it is very important to know the bacterial communities associated with marine sediments and evaluate their ability to form biofilms under in vitro culture conditions that allow to establish hypothesis about their development in natural environments.
STUDY AREA
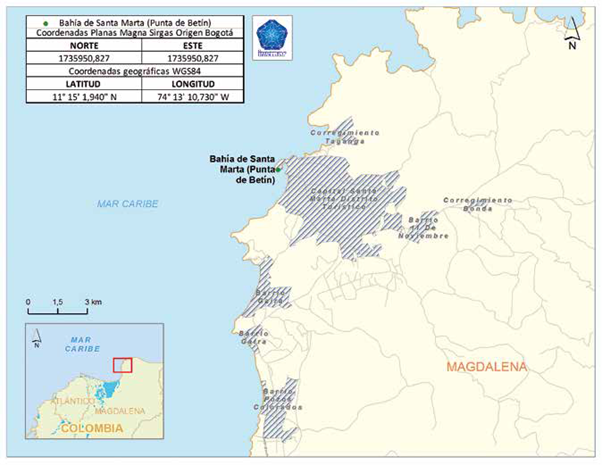
Punta de Betín is located on the Colombian Caribbean coast and belongs to the Santa Marta area, department of Magdalena. It is a rocky peninsula of steep slopes, located north of Santa Marta bay, so it is directly affected by the discharge of fresh water (Manzanares river and submarine emissary) and the port (grains and coal dust) (Martínez and Acosta, 2016). The sampling station was located at the following coordinates 11 ° 15'01.94''N; 074 ° 13'10.73'W, collecting samples at three depths 5, 10 and 15 m (Figure 1)
MATERIALS AND METHODS
Sample collection.
The samples were collected in Punta Betín (Santa Marta Bay) with a Van Veen dredger of 14 cm in diameter with a sampling area of 0.08 m2 and autonomous diving, taking the surface sediment layer in triplicate in a range of 5 to 15 meters deep. The collected samples were stored in sterile bottles lined with aluminum foil to protect them from light and stored in a plastic refrigerator with ice at approximately 4 ° C, to be transported to the marine natural products area of the Marine Bioprospecting Laboratory of Invernar -LabBIM for its processing.
Growth and isolation of marine bacteria
The collection of cultivable bacteria from the different samples was carried out using solid media with a high concentration of nutrients, such as Trypticase soy agar with 1 % NaCl (TSA-I), Marine Agar (AM), ISP2 Agar with 1 % NaCl, and Actinobacteria Agar (Difco) enriched with salts (Raver, 2000). Twenty grams of sample sediment were added to sterile Petri dishes and then heat-treated in an oven at 50 °C for 60 minutes to remove the plant microbiota from the sample (Rocha et al., 2013). Serial dilutions (1/10, 1/100 and 1/1000) were then made in peptone water supplemented with sterile artificial seawater (1:1) and inoculated into agar plates incubating them at 26°C for a period of 15-20 days (León et al, 2007; Romero and Otero 2010; Torres et al, 2012).
Conservation of strains
The strains were isolated from the sediment in nutritive broth supplemented to 1% NaCl and 20% glycerol (V/V), and then conserved in axenic cultures. The cultivated strains were coded and stored at a temperature of -80 °C. Based on the concept that antimicrobial production is regulated by quorum sensing mechanisms, in this work only eleven strains were evaluated that showed biological activity against resistant microorganisms of clinical interest in trials performed by INVEMAR's Marine Bioprospecting Laboratory. Finally, their coding was based on their molecular identification. The strains were deposited in the Museum of Marine Natural History of Colombia - Makuriwa of INVEMAR, which assigned the following codes for the identified strains: 64093, 64094, 64095, 64096, 64097, 64100, 64101, 64181, 64186, 64170 and an unidentified isolate 64156.
Reactivation of strains
The reactivation of the isolates evaluated in this work was carried out from a defrosting process that consisted of moving from -80 ° C to -20 ° C and leaving the strains for two hours at this temperature, then they were switched to 4 ° C and kept 1 hour at that temperature. Subsequently, 100 μl (using the mass growth technique) were inoculated in Petri dishes with TSA agar at 28 ° C for 48 hours; They were finally kept at 4 ° C for use during this study.
Genetic identification
The genetic identification of the eleven strains was realize on a culture in TSA agar incubated at 28 ° C for 48 hours.
DNA extraction
DNA extraction was performed using the Invitrogen PureLink Genomic DNA kit. Elution was performed in a final volume of 50 μl. At the end of the extraction process, it was performed by spectrophotometry at wavelengths of 260/280 nm in a Nanodrop (Thermo Fisher Scientific) equipment.
Amplification of the RNA 16S marker
The crude obtained DNA was used as a template in the amplification of the 16S region by polymerase chain reaction (PCR) (Dashti et al., 2009; Sowmya et al., 2012). The 16S gene was amplified using universal primers 27F (5'-AGA GTT TGA TCM TGG CTC AG-3 ') and 1492R (5'-GGT TAC CTT GTT ACG ACT T-3') (Weisburg et al., 1991), which amplify a fragment of approximately 1500 base pairs (bp).
The PCR conditions were: initial denaturation of the DNA at 94 ° C for 3 min, 35 cycles of amplification, denaturation at 94 ° C for 30 S, annealing of the primer at 50 ° C for 30 S, extension of the primer at 72 ° C for 2 min, followed by a final extension at 72 ° C for 8 min (T-100 Bio-Rad thermal cycler). The PCR products were migrated in 1% agarose gel (w / v) at 100 V for 80 minutes, 1X TBE buffer and 1 ll of EZ-vision loading buffer (AMRESCO). The results were visualized by exposure to ultraviolet light and photographed with a digital capture system (ENDUROTM GDS - LABNET). Additionally, the identity of some isolates of the genus Bacillus was complemented at the species level by amplification of the coding gene for chaperonin groEL using initiators 550F (5'-GAGCTTGAAGTKGTTGAAGG-3 ') and 1497R (5'-TGAGCGTGTWACTTTTGTWG-3') (Rooney et al., 2009).
RNA 16S marker sequencing
The amplification product was subjected to sequencing reaction by the Sanger / capillary method and reading both chains to ensure the reliability of sequencing. This was done at the facilities of Corpogen, a corporation in Bogotá.
Assembly and Classification based on the 16S marker
The sequences obtained were purified from the ends with low quality bases and assembled with the eBioX version 1.5.1 program. The final sequence was analyzed by comparison with the sequences deposited in the BLAST server database of the National Center for Biotechnology Information (NCBI) and the rRNA Database Project (RDP II).
The coding sequences for the 16S rRNA were aligned with the SINA program (SILVA Incremental Aligner v1.2.11), which uses a combination between the k-mer sequences and the partial order alignment (POA) in order to maintain a high precision (Pruesse et al., 2012). The sequence identity was compared with the reference sequences hosted by SILVA RDP, Greengenes and SILVA, using the lowest common ancestor method (ACB) and looking for five of the closest sequences with a minimum identity of 0.97.
Phylogenetic analysis
The phylogenetic analysis was initially carried out with a distance analysis of the ten sequences obtained during the sequencing process and performing a search in the databases with reported sequences of the Bacillus genus for the 16S RNA marker. For the construction of the tree, the MEGA 7 software was used with the maximum likelihood method with 1000 Bootstrap replicas, following the Hasegawa, Kishino and Yano (1985) evolution model.
Induction of biofilm formation and experimental design
For the induction to the formation of biofilms in the eleven strains studied, a pre-circle of each of the strains in trypticase soy broth (TSB), and in microbiological bottles was made, adding 5 ml of the culture medium plus 200 μl of the strain and left under stirring for 24 h at 28 ° C. Subsequently, the absorbance at a 600 nm wavelength was measured with a Multiskan Go (Thermo Scientific) spectrophotometer, to confirm that the absorbance was not greater than 0.2 in order to have all strains in the same concentration to perform the test.
The biofilm formation was carried out in 96-well flat bottom plates and in each well 100 ¡A of the strain and 100 μl of fresh TSB medium was added, incubating all strains initially at 28 ° C and under static conditions, to induce the formation of the biofilm for 24, 48, 72 hours. Subsequently, two strains with greater biofilm formation (64181 and 64186) were selected to perform tests at different temperatures (26, 28 and 30 ° C) for 48 hours. As a negative control, a strain of Staphylococcus aureus ATCC 43300 was used, which was grown under the same conditions as the strains studied. Five repetitions were performed for each strain, including the negative control, and each quantification experiment was replicated three times. All this for both methods (Violet Crystal, XTT). In the graphs presented, the last two digits of the five utilized are used as the code of each strain.
Staining with violet crystal
The quantification of biofilm formation at the 24, 48 and 72 hour assays was carried out with violet crystal staining; for this, the culture medium was extracted from the wells and three washes were carried out with 200 μl of 1X PBS; then a sterile water wash was performed and stained with 200 μl of violet crystal at a concentration of 0.2%; 15 minutes were expected and the dye was extracted to perform again two washes with 200 μl of sterile water, allowing to dry in the open air; then a solution of 10% acetic acid, 50% ethanol and 40% water (v / v / v) was added to dilute the violet crystal and finally the absorbance at a wavelength 540 nm was measured to the 24 tests, 48 and 72 h.
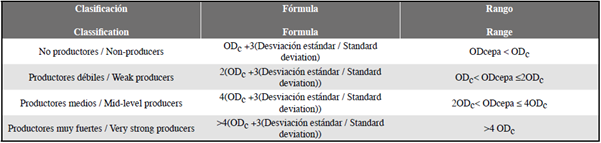
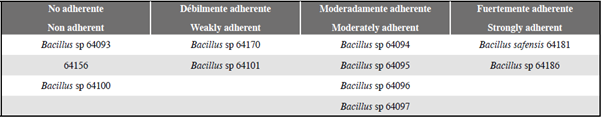
The statistical analysis performed on the data was the mean, standard deviation and the optical density (OD) formula of the control was applied to classify the strains according to the biofilm formation; This was done with the test results at 48 h. The selected categories were non-producers, weak producers, medium producers, and very strong producers (Table 1) (Stepanović et al., 2000).
Staining and quantification of metabolic activity Reagent preparation
For the quantification of the biofilm metabolic activity, the reduction of the tetrazolium chloride-XTT dye (Sigma-Aldrich) was used as a method by cellular respiration. For this, a mixture of XTT and menadione was prepared. The XTT was prepared at 1 mg / ml and dissolved in 1X PBS then filtered through a 0.22 μm filter. Menadione was prepared at a concentration of 400 mM and dissolved in acetone for subsequent filtration at 0.22 μm. The XTT / Menadiona mixture was performed at a 5: 1 ratio.
XTT staining was initiated by washing the biofilms with 200 μl of 1X PBS (3 washes) to eliminate plankton bacteria that might be in the wells; 200 μl of PBS and 12 μl of XTT / Menadione reagent were then added and the microplate was incubated at 30 ° C for two hours, without being exposed to light and absorbance was measured at 490 nm. Dye reduction is a measure of metabolic activity.
Cell Viability - Live/Dead Staining
Biofilm formation assays were performed on glass coverslips for 24 h for strains 64181 and 64186 and for the mixed assay. To carry out the above, the sterile coverslips were placed in Petri dishes with 5 ml of fresh culture and 20 μl of the medium with the strains, incubating them at 28 ° C for the development of the biofilm. After time, the coverslips were washed with 1X PBS and stained with the LIVE / DEAD® Viability Kit (Invitrogen) system, leaving them in incubation for 15 to 20 min at room temperature. The formation of the biofilms was visualized by means of an epifluorescence microscope, which allowed to recognize by means of the Live / Dead staining the cells that were alive (green - yellow) and the dead cells (red).
Statistical analysis
The statistical analysis of the data was first performed with the Excel software to make the graphs of averages and standard deviations for each experiment. Subsequently the inferential analysis of the data was done with the R software; First, the data of each experiment were tested for normality and homogeneity of variances; then, according to these results, in order to compare the means between treatments (strains, times, temperatures), ANOVA analysis of variance was performed in the case of parametric data and Kruskal Wallis for non-parametric data; in each case, tests of multiple comparisons Tukey and Nemenyi were performed respectively with a p ≤ 0.05.
RESULTS
Molecular identification
Phylogenetic analysis from the sequences of the 16S RNA gene allowed them to be classified within the genus Bacillus; however, it was only possible to identify strain 64181. Until this species, the groEL marker was used (Rooney et al., 2009), a fragment that codes for a protein that allows to tolerate thermal changes in Bacillus species. This marker indicated that said strain corresponds to the species Bacillus safensis with a 100% identity percentage (Figure 3).
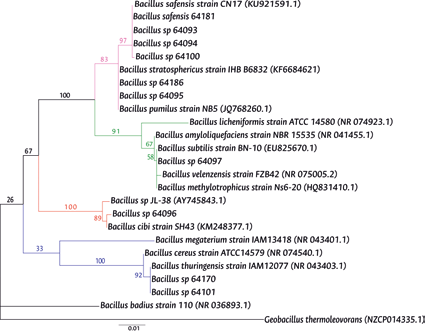
Figure 2 Maximum likelihood tree representing the phylogenetic relationship of the strains studied based on the 16S RNA gene. Bootstrap values are shown as a percentages. The access code in GenBank is indicated in parentheses. Blue branches represent the Bacillus cereus group, red branches represent the Bacillus cibi group, green branches represent the Bacillus subtilis group, pink branches represent the Bacillus pumilus group.
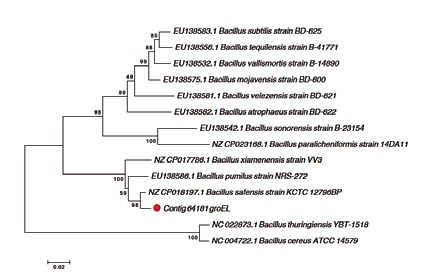
Figure 3 Neighbor joining tree representing the phylogenetic relationship of the species Bacillus safensis strain 64181 (red dot) based on the groEL gene. Bootstrap values are shown in percentages.
The other strains analyzed were grouped according to the maximum likelihood tree in the Bacillus subtilis, Bacillus cereus and Bacillus pumilus groups. For example, strain 64097 was located close to the reference sequences of the Bacillus subtilis group, forming a brother group with bootstrap value of 83, while strains 64101, 64170 formed sibling groups with the reference sequences of the Bacillus cereus group, both with Bacillus thuringiensis strain IAM12077 (NR043403.1) with bootstrap value of 92 and strain 64096 with Bacillus cibi strain SH43 (KM248377.1) showing a bootstrap of 89. The remaining isolates were located in the Bacillus pumilus group, which It was divided into two clades, one with bootstrap of 97 and the other with 83 (Figure 2).
Induction of biofilm formation
General test with violet crystal staining
The tests for the induction to biofilm formation, performed for all strains at 24 and 48 hours showed that under static conditions and at a temperature of 28 °C, bacilli isolated from marine sediments are mostly forming different biofilms, standing out B. safensis 64181 and Bacillus sp 64186 as the ones with the highest adherence and Bacillus sp 64093, Bacillus sp 64100 and 64156 were excepted, which showed no adherence (Table 2). This classification was made from two cuts on the absorbance values obtained from the results of the violet crystal test at 48 hours, at which time the greater formation of biofilm by the bacteria was evidenced; As a negative control, S. aureus bacteria was used because it is a bacterium with biofilm formation capacity that is less than 37 °C difficult to perform this process.
It is important to note that the optical density (O.D) of the isolates was compared with that of the negative control and was considered biofilm forming when this absorbance was greater than 0.4 (Figure 4).
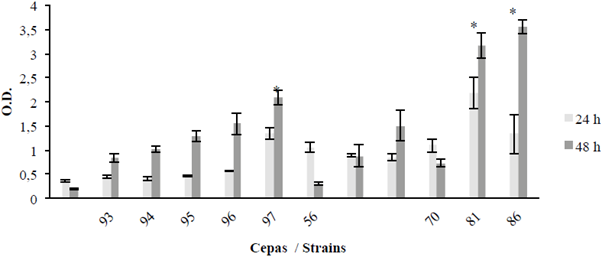
Figure 4 Biofilm formation at 24 and 48 hours; strains 64093, 64094, 64095, 64096, 64097, 64156, 64100, 64101, 64170, 64181 and 64186, using the S. aureus (SA) strain as a control. Optical density (O.D.); the bar is ± 1 standard error and the asterisks show significant differences between the strains and the control, only for 48 hours (p ≤ 0.05).
Regarding the comparison of the behavior of all strains between 24 and 48 h at 28 °C and under static conditions, most strains increased the biomass from 24 to 48 h, with the exception of strains 64156 and 64170 (Figure 4). The significant differences shown in the following graph correspond to strains 64097, 64181 and 64186 with respect to the negative control (-) (p ≤ 0.05) at 48 h.
Biofilm formation strains 64181 and 64186
According to the results, B. safensis 64181 and Bacillus sp 64186, were the ones with the highest biofilm formation (Table 2 and Figure 4), therefore they were quantified separately and together (mixed culture) at 24, 48 and 72 hours, after this time thre were inconveniences for absorbance reading due to the high biomass formation, which made it difficult to obtain the optical density (OD) of the test. For the mixed biofilm assay, it was observed that biofilm formation was inferior to that shown by the treatment of each individual strain, although the fact that growth conditions were the same for all treatments (Figure 5). In relation to the experiments carried out at different temperatures for B. safensis 64181, Bacillus sp 64186 and joints (mixed culture) (Figure 6), it was determined that at 26 °C and 30 °C there are significant differences (p ≤ 0.05) in biofilm formation with respect to the temperature of 28 °C.
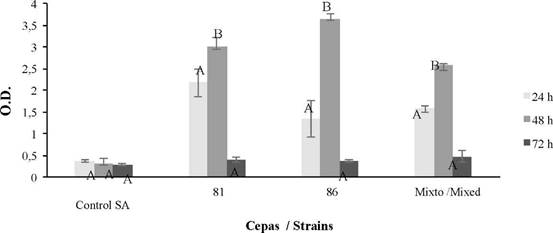
Figure 5 Biofilm formation at 24, 48 and 72 hours for strains 64181, 64186 and mixed culture, using the S. aureus (SA) strain as the control. For optical density (O.D.), the average bar indicates ± 1 standard error and the letters represent equal times, separately for the control, strains, and mixed (p ≤ 0.05).
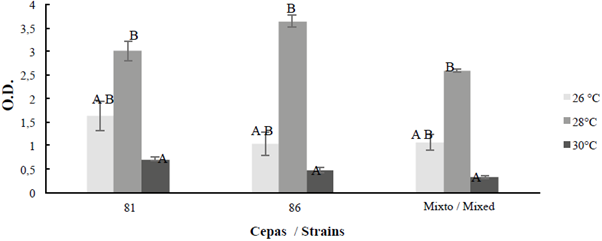
Figure 6 Biofilm formation at 26, 28 and 30 °C during 48 hours for the strains with the highest formation: B. safensis 64181, Bacillus sp 64186 and mixed (M). For optical density (O.D.); the average bar indicates ± 1 average standard error and the letters indícate temperatures equal to each other, separately for strains and mixed (p ≤ 0.05).
General assay for metabolic activity with XTT
In order to determine the metabolic activity of the biofilm, XTT assays were also performed on all strains and the negative control (-), observing that all have a metabolic activity above 0.6 and in some increases from 24 to 48 h, it is highlighted again that the strains with the highest activity were 64097, 64181 and 64186 (Figure 7). Again, trials with each strain showed that the greatest metabolic activity occurs at 48 hours, with the activity lasting up to 96 h. Group A (64097, 64181 and 64186) was different from 64095, 64096 and 64156 at 24 h, group B (control) was different from 64096 at 48 h and Group C (64097, 64181 and 64186) was significantly different from strains 64095, 64096 and 64156 at 48 h (p ≤ 0.05).
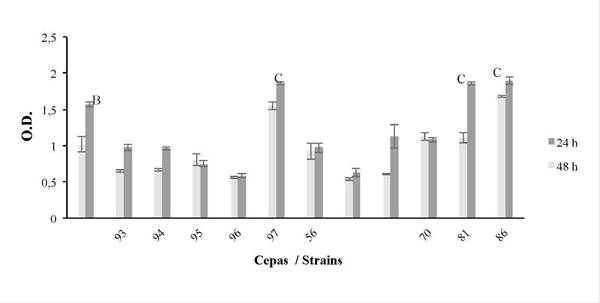
Figure 7 Metabolic activity during biofilm formation at 24 and 48 h (XTT method), for strains 64093, 64094, 64095, 64096, 64097, 64156, 64100, 64101, 64170, 64181, 64186, using the S. aureus (SA) strain as the control. The response variable was optical density (O.D.). The average bar ± 1 standard error and the letters indícate the result of múltiple statistical comparisons between strains, separately for each time. See text (p ≤ 0.05).
Metabolic activity of B. safensis 64181 and Bacillus sp 64186
The comparison of the metabolic activity in the biofilms of B. safensis 64181 and Bacillus sp 64186 over time, allowed to identify the hours at which the metabolism of the bacteria is most active, observing that at 48 h its maximum activity is reached metabolic in in vitro experiments and then after 72 h begins to decrease. It was also observed that in the mixed trial there is little variation between 48 and 72 hours, unlike the individual strains that showed a decrease in cellular metabolic activity (Figure 18).
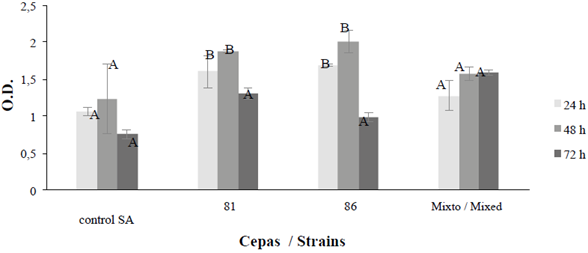
Figure 8 Biofilm formation at 24, 48 and 72 hours for B. safensis 64181, Bacillus sp 64186 and mixed strains, using the S. aureus (SA) strain as a control. Optical density (O.D.); the average bar indicates ± 1 standard error and the letters indicate equal times, separately for control, strains and mixed (p ≤ 0.05).
LIVE/DEAD cell viability staining
Regarding biofilm formation on coverslips, bacteria were found to be alive in all experiments (LIVE / DEAD staining). It was observed that Bacillus sp 64186 showed a large area coverage, covering most of the surface; however, in some areas it was visualized that the bacteria agglomerated to continue forming the biofilm (Figure 10 e and f).
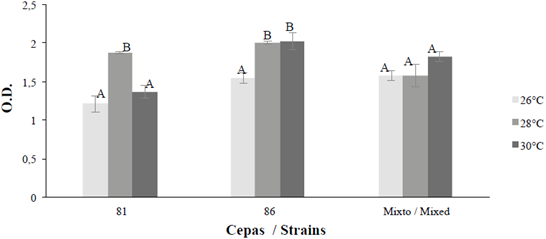
Figure 9 Biofilm formation at 26, 28 and 30 oC for 48 hours for the strains with the highest formation B. safensis 64181, Bacillus sp 64186 and mixed (M). The response variable is optical density (O.D.). The average bar indicates the ± 1 standard error and the letters show equal temperatures for strains and mixed (p ≤0.05).
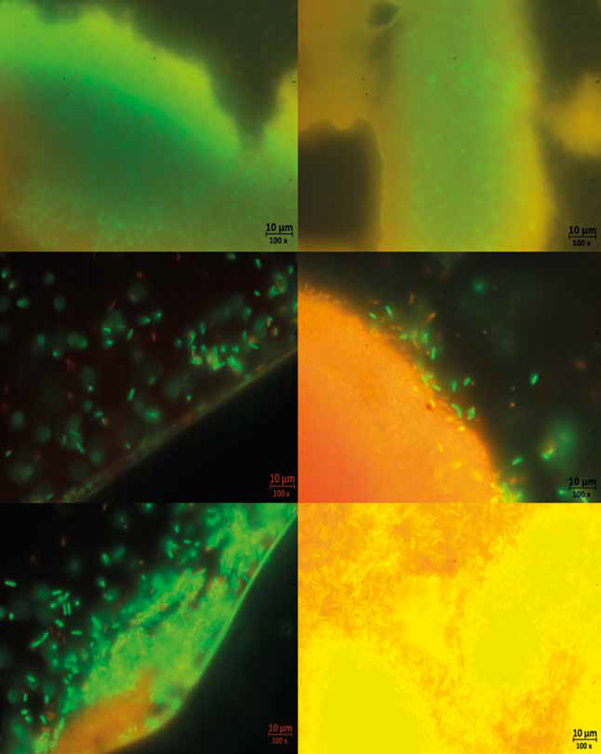
Figure 10 Live/Dead staining of the biofilms after 24 hours of culture on cover slides. a. biofilm of strain 64181; b. biofilm with channel-like formations, strain 64181; c and d. mixed biofilms, bacteria adhering to the matrix; e. bacteria forming clusters, strain 64186; f. Biofilm of strain
Even in the test with B. safensis 64181 (Figure 10 a) it was observed that it did not adhere to the glass, and the biofilm formed in the liquid-air interface making it difficult to visualize in the microscope; despite this, it was possible to see a matrix where living bacteria were immersed with cell-free spaces that appeared to be forming channel-like structures (Figure 10b). Finally, the mixed biofilm was observed denser than the previous ones and with a large number of bacteria adhered to the matrix, which had a structure that presented pores and showed that the live bacteria continued to adhere to it (Figure 10 c and d).
DISCUSSION
Strain identification
Molecular identification determined that all isolates belong to the Phylum Firmicutes, family Bacillaceae. The phylogenetic analysis showed that they belonged to the genus Bacillus, locating the strains in different groups such as Bacillus cereus, Bacillus pumilus and Bacillus subtilis with an identity percentage of around 99% with the NCBI reference strains. The nearby strains were used for máximum likelihood phylogenetic analyses. However, the use of other markers such as gyrB and XRE is recommended (Helgason et al, 2000; Punina et al, 2013; Wei et al, 2019) to identify all strains up to the species taxonomic lev el (Helgason et al., 2000; Punina et al, 2013; Wei et al, 2019).
Based on the results of the identification of the strains studied, we conclude that this was influenced by the selective process carried out with sediment samples in which we sought to favor the growth of Gram positive bacteria, especially actinobacteria, in order to identify their antimicrobial activity and study the processes derived from cell communication quorum sensing such as biofilm formation. Although, in this study, a methodology was designed that consisted of using 20 g of marine sediment to be treated with heat at 50°C, for 60 minutes, in order to eliminate the accompanying vegetative microbiota in the sample, isolates belonging to the genus Bacillus were obtained, which present resistance structures such as endospores, allowing them to tolerate temperatures up to approximately 60 °C (Kristjansson, 1992). In general, many studies support the use of heat treatments to inhibit the growth of rapidly growing Gram-negative bacteria (Leiva et al., 2015; Matobole et al., 2017), decontamination of sediment samples (Kim, 2013), or selective treatments to support the growth of microbial groups (Bredholt et al., 2008).
Biofilm formation
To assess the ability to form biofilms of strains isolated from marine sediment, induction and quantification tests were performed using different methods. The first, violet crystal, allowed to measure indirectly each of the strains and thus classify them according to the capacity of adhesion, starting from the comparison of each strain with the negative control S. aureus, which according to Martínez and Arévalo (2010) shows decrease in biofilm formation at temperatures below 37 ° C. Therefore, strains whose absorbance was less than the negative control were considered non-adherent (Table 2). This method also allowed to evaluate, depending on the biomass, different growth conditions. The second method, quantification by reduction of the XTT, provided information on the metabolic activity of the cells in the biofilm.
Biofilm formation was evaluated at 24 and 48 hours for all 11 isolates, among these the species that showed the most biomass and metabolic activity were Bacillus sp 64097, B. safensis 64181 and Bacillus sp 64186, the last two being selected to produce the greater amount of biomass, these during the tests at different times (24, 48, 72 h), showed that they were more metabolically active at 24 and 48 hours; however, the biofilms were denser at 48 h.
This is explained because each microorganism produces different amounts of exopolysaccharides, which also tend to increase as time goes by, from the beginning of the irreversible adhesion phase of the bacteria to the surface until the mature biofilm (Leriche et al., 2000). According to Flemming and Wingender (2010), microorganisms represent less than 10% of the dry mass, while the matrix can represent more than 90% in most cases. However, their formation depends on the ability of bacteria to detect environmental signals; for example, the availability of nutrients (Costerton et al., 1995; Adams and McLean, 1999; Costerton et al., 1999), which are depleted over time, making it difficult to diffuse through the matrix in the biofilm, which generates a gradient that affects the metabolic activity of cells.
For metabolic activity, the results with respect to time show that there are differences between the test of each and together (Mixed). The mixed biofilm over time showed no variation, possibly because the formation of a micro-consortium allows the cells to be in a more dynamic matrix that benefit them to achieve homeostasis, due to the heterogeneity of substances that it presents, and thus adapt to environmental changes or nutrient depletion (Sutherland, 2001; Flemming and Wingender, 2010).
The differences between the amount of biomass and the metabolic activity of the bacteria in relation to the temperature for the monospecies assay, indicates that at 28 ° C the denser biofilm is evidenced, while at the other temperatures the opposite happens, despite being metabolically active, suggesting that temperature may affect other stages of biofilm development such as irreversible adhesion and thus take longer to generate a denser matrix. The mixed test shows a less dense biofilm than those produced by the individual species for each temperature, possibly the high synthesis of |3-galactosidases enzymes by strain 64181 identified as B. safensis affects the polysaccharides that make up the mixed matrix (Nath et al., 2012).
In studies with mixed biofilms in natural marine environments, it has been shown that as the temperature increases, the metabolic activity of the biofilm increases (Rao, 2010), as happened with the mixed biofilm test at 30 ° C, which increased its metabolic activity with respect to the other temperatures (Figure 9), in addition Yang et al (2013) showed that Bacillus strains at high temperatures had a higher plant growth rate than the biofilm.
Complementary to biofilm assays, the cell viability observed at 24 hours by means of LIVE / DEAD staining (Figure 10), allowed to visualize some biofilm structures and particular characteristics of their formation; for example, species B. safensis 64181 did not adhere to glass and formed the biofilm at the liquid-air interface. In many investigations it has been affirmed that the adhesion of the bacteria to the surfaces is directly proportional to the roughness of the same (Characklis and Marchall, 1990). However, irreversible adhesion of bacteria depends on other factors such as the interaction between the nature of the material and the cell; for example, the type of hydrophobic interaction that occurs between the bacteria and the surface could help it overcome repulsive forces and irreversibly join it (Donlan, 2002).
Despite this, these statements are contradictory in the literature, because there are no standardized methodologies to measure the nature of the materials, although it is suggested that microorganisms adhere more quickly to hydrophobic and non-polar surfaces such as Teflon, polystyrene and other plastics, than hydrophilic materials such as glass or metals (Soler, 2018). In many Gram-positive bacteria, such as those of the Bacillus genus, the bacterial surface is characterized by being hydrophobic and having an affinity to these materials.
As for the biofilms of Bacillus sp 64186 and the mixed one, a dense matrix was observed that presented in some areas clusters of bacteria and in some cases the staining was visualized red. This is because the matrix composition is formed by extracellular DNA (eDNA), which has commonly been considered a remnant of the lysed cells, although it occurs in some cases in very high quantities (Whitchurch et al., 2002; Flemming et al., 2007). Allesen-Holm et al. (2006) found that in Pseudomonas aeruginosa, the eDNA that was part of the matrix was derived from genomic DNA, and that it was organized in such a way that it served as a grid-shaped support structure for the biofilm; therefore, it is attributed a structural role.
ACKNOWLEDGEMENTS
To the Marine and Coastal Research Institute "José Benito Vives De Andréis" -Invernar; to Universidad Nacional de Colombia Sede Caribe; to the Ministry of Environment and Sustainable Development -MADS, for financing this project. This research was framed in the project "Search for active substances of microorganisms of coastal marine environments" for their potential application in next fields: health, industry, agriculture and environment (File RGE 0158-5), framework contract for access to genetic resources and derived product No. 123, held between the Ministry of Environment and Sustainable Development -MADS and Invemar. Also to the Marine Bioprospecting Line of the Program for the Valuation and Use of Marine Resources where the project was carried out. Contribution Cecimar N° 494 and Invemar N° 1236.
REFERENCES
Adams, J. L and R. C. McLean. 1999. Impact of rpoS deletion on Escherichia coli biofilms. Appl. Environ. Microbiol., 65:4285-1287. [ Links ]
Allesen-Holm, M., J.S. M. K. Webb, K. Staffan, M. S0ren, M. Givskov and T. Tolker-Nielsen. 2006. A characterization of DNA release in Pseudomonas aeruginosa cultures and biofilms. Mol. Microbiol., 59:114-1128. [ Links ]
Azam, F., T. Fenchel, J. G. Field, J. S. Gray, L. A. Meyer-Reil and F. Thingstad. 1983. The ecological role of water-column microbes in the sea. Mar. Ecol. Prog. Ser., 10: 257-263. [ Links ]
Bredholt, H., E. Fjíervik, G. Johnsen and S.B. Zotchev. 2008. Actinomycetes from sediments in the Trondheim Fjord, Norway: diversity and biological activity. Mar. Drugs, 6:12-24. [ Links ]
Cao, S., J. Wang, H. Chen and D. Chen. 2011. Progress of marine biofouling and antifouling technologies. Chin. Sci. Bull., 56: 598-612. [ Links ]
Characklis, W. G., G.A. McFeters and K.C. Marshall. 1990. Physiological ecology in biofilm systems. John Wiley, New York. 816 p. [ Links ]
Costerton, J.W., Z. Lewandowski, D.E. Caldwell, D.R. Korber and H.M. Lappin-Scott. 1995. Microbial biofilms. An. Rev. Microbiol., 49:711-15. [ Links ]
Costerton, J.W ., P.S Stewart and P. Greenberg.1999. Bacterial biofilms: A common cause of persistent infections. Science, 80:1318-22. [ Links ]
Dang, H., and C.R. Lovell. 2016. Microbial surface colonization and biofilm development in marine environments. Microbiol. Mol. Biol. Rev., 80: 91-138. [ Links ]
Dang, H ., Li, T., M. Chen and G. Huang. 2008. Cross-ocean distribution of Rhodobacterales bacteria as primary surface colonizers in temperate coastal marine waters. Appl. Environ. Microbiol ., 74: 52-60. [ Links ]
Dashti, A.A., M.M. Jadaon, A.M. Abdulsamad and H.M. Dashti. 2009. Heat treatment of bacteria: A simple method of DNA extraction for molecular techniques. Kuwait Med. J., 41: 117-122. [ Links ]
De Carvalho, C.R. and M.J. Caramujo. 2012. Lipids of prokaryotic origin at the base of marine food webs. Mar. Drugs , 10: 2698-2714. Donlan, M. R. 2002. Biofilms: Microbial Life on Surfaces. Emerg Infect Dis, 8: 881-890. [ Links ]
Flemming, H.-C. and J. Wingender. 2010. The biofilm matrix. Nat. Rev. Microbiol, 8: 623-632. [ Links ]
Flemming, H.-C ., T. R. Neu and D.J . Wozniak. 2007. The EPS Matrix: The «House of Biofilm Cells». J Bacteriol., 22: 7945-7947. [ Links ]
Hadfield, M.G. 2011. Biofilms and marine invertebrate larvae: what bacteria produce that larvae use to choose settlement sites. An. Rev. Mar. Sci., 3: 453-470. [ Links ]
Hasegawa M., H. Kishino and T.A. Yano. 1985. Dating of the human ape splitting by a molecular clock of mitochondrial-DNA. J. Mol. Evol., 22:160-174. [ Links ]
Hawley, A.K., M.K. Nobu, J.J. Wright, W.E. Durno, C. Morgan-Lang and B. Sage. 2017. Diverse Marinimicrobia bacteria may medíate coupled biogeochemical cycles along eco-thermodynamic gradients. Nature, 8: 1507p. [ Links ]
Helgason, E., O.A. Okstad, D.A. Caugant, H.A. Johansen and A. Fouet. 2000. Bacillus anthracis, Bacillus cereus, and Bacillus thuringiensis-one species on the basis of genetic evidence. Appl. Environ. Microbiol., 66: 2627-2630. [ Links ]
Kim, S.K. 2013. Marine microbiology: bioactive compounds and biotechnological applications. Willey-VCH, 580p. [ Links ]
Kolenbrander, E., N. Andersen, S. Blehert, G. Egland, S. Foster and J. Parmer. 2002. Communication among oral bacteria. Microbiol. Mol. Biol. Rev ., 66: 486-505. [ Links ]
Kristjansson, J. 1992. Thermophilic Bacteria. CRC, New York. 52 p. [ Links ]
Kuramitsu, K., X. He, R. Lux, H. Anderson and Y. Shi. 2007. Interspecies interactions within oral microbial communities. Microbiol. Mol. Biol. Rev ., 71: 653-670. [ Links ]
Lau, S., K.C. Mak, K.F. Chen and P.Y. Qian. 2002. Bioactivity of bacterial strains isolated from marine biofilms in Hong Kong waters for the induction of larval settlement in the marine polychaete Hydroides elegans. Mar. Ecol. Prog. Ser ., 226: 301-310. [ Links ]
Lee, J.W., J.H. Nam, Y.H. Kim, K.H. Lee and D.H. Lee. 2008. Bacterial communities in the initial stage of marine biofilm formation on artificial surfaces. J. Microbiol., 46: 174-182. [ Links ]
Leiva, S., P Alvarado, Y. Huang, J. Wang and I. Garrido. 2015. Diversity of pigmented Gram-positive bacteria associated with marine macroalgae from Antarctica. FEMS Microbiol. Let., 362: 206. [ Links ]
Leriche V. and P.S. 2000. Use of an enzyme-linked lectinsorbent assay to monitor the shift in polysaccharide composition in bacterial biofilms. Appl Environ Microbiol, 66:1851-1856. [ Links ]
León, J., L. Liza, I. Soto, D. Cuadra, L. Patiño and R. Zerpa. 2007. Actinomycetes bioactivos de sedimento marino de la costa central del Perú. Rev. Per. Biol., 14: 259-270. [ Links ]
Little, B.J., J.S. Lee and R.I. Ray. 2008. The influence of marine biofilms on corrosion: a concise review. Electrochim. Acta, 54: 2-7. [ Links ]
Lobelle, D y M. Cunliffe. 2011. Early microbial biofilm formation on marine plastic debris. Mar. Pollut. Bull., 62: 197-200. [ Links ]
Martínez, S. y A. Acosta. 2016. Cambio temporal en la estructura de la comunidad coralina del área de Santa Marta - Parque Nacional Natural Tayrona (Caribe colombiano). Bull. Mar. Coast. Res., 34:161-191. [ Links ]
Martínez-Díaz, J. y C. Arévalo-Ferro. 2010. Evaluación de un bioensayo para medir la inhibición de biopelículas bacterianas. Universidad Nacional de Colombia, Bogotá. 103 p. [ Links ]
Matobole, R.M., L.J. van Zyl, S. Parker-Nance, M. T. Davies-Coleman and M. Trindade. 2017. Antibacterial activities of bacteria isolated from the marine sponges Isodictya compressa and Higginsia bidentifera collected from Algoa Bay, South Africa. Mar. Drugs , 15: 47. [ Links ]
Nath, A., S. Sarkar, M. Maitr, C. Bhattacharjee and R. Chowdhury. 2012. An experimental study on production of intracellular p-galactosidase at different conditions by batch process using isolated Bacillus safensis (JUCHE 1) and characterization of synthesized p-galactosidase. J. Inst. Eng. India, 93: 55-60. [ Links ]
Nazar, J. 2007. Biofilms bacterianos. Rev. Otorrinolaring. Cir. Cab. Cuello, 67: 161-172. [ Links ]
Nowak, M. and P. Kurnatowski. 2009. Biofilm caused by fungi structure, quorum sensing, morphogenetic changes, resistance to drugs. Wiad Parazytol., 55:19-25. [ Links ]
Paerl, H.W and J.L. Pinckney. 1996. A mini-review of microbial consortia: their roles in aquatic production and biogeochemical cycling. Microbiol. Ecol., 31: 225-247. [ Links ]
Pruesse E., J. Peplies and O.F. Glockner, 2012. SINA: Accurate high-throughput multiple sequence alignment of ribosomal RNA genes. Bioinformatics, 28: 1823-1829. [ Links ]
Punina, N.V., V.S. Zotov, A.L. Parkhomenko, T.U. Parkhomenko and A.F. Topunov. 2013. Genetic diversity of Bacillus thuringiensis from different geo-ecological regions of Ukraine by analyzing the 16S rRNA and gyrB genes and by AP-PCR and saAFLP. Acta Nat., 5:90-100. [ Links ]
Rao, T. 2010. Comparative effect of temperature on biofilm formation in natural and modified marine environment. Aquatic Environ., 44: 463-478. [ Links ]
Raver, J. 2000. Interspecific Transfer of Streptomyces giant linear plasmids in sterile attended soil microcosms. Appl. Environ. Microbiol ., 66: 529-534. [ Links ]
Rocha, L.C., J.R. de Oliveira, B. Vacondio, G.N. Rodrigues, M.H. Seleghim and A.L. Porto. 2013. Bioactive marine microorganisms for biocatalytic reactions in organic compounds. 453-190. In: Se-Kwon, Kim. (Ed.). Marine Microbiology, Wiley-VCH, Weinheim, Germany. 549 p. [ Links ]
Rodriguez, R.A. and C.E. Epifanio. 2000. Multiple cues for induction of metamorphosis in larvae of the common mud crab Panopeus herbstii. Mar. Ecol., 195:221-229. [ Links ]
Romero, M y A. Otero. 2010. Interceptación de señales de comunicación bacteriana tipo N-acilhomoserín lactonas (AHLs) en bacterias aisladas del medio marino. Universidad de Santiago de Compostela, Santiago de Compostela, España. 220 p. [ Links ]
Rooney, A.P., N.P.J. Price, C. Ehrhardt, J.L. Swezey and J.D. Bannan. 2009. Phylogeny and molecular taxonomy of the Bacillus subttilis species complex and description of Bacillus subttilis subsp. In a quosorum subsp. nov. INT J SYST EVOL MICR, 59: 2429-2436. [ Links ]
Soler Arango, J. 2018. Inactivación de biofilms de Pseudomonas aeruginosa mediante plasma frío a condiciones atmosféricas. Universidad Nacional de la Plata, La Plata, Argentina. 208 p. [ Links ]
Sowmya, N., M.S. Thakur and H.K. Manonmani. 2012. Rapid and simple DNA extraction method for the detection of enterotoxigenic Staphylococcus aureus directly from food samples: comparison of PCR and LAMP methods: Rapid and simple DNA extraction method. J. Appl. Microbiol., 113: 106-113. [ Links ]
Stepanović, S., D. Vukovic, I . Dakic, B. Savic and M. Svabic-Vlahovic. 2000. Quantification of biofilm in microtiter plates: overview of testing conditions and practical recommendations for assessment of biofilm production by staphylococci. J. Microbiol. Meth., 175-179. [ Links ]
Torres-Beltrán, M.F., Cardoso-Martínez, N. Millán-Aguiñaga, A. Becerril-Espinosa e I. Soria-Mercado. 2012. Evaluación del golfo de California como una fuente potencial de actinobacterias marinas bioactivas. Rev. Cienc. Mar., 38: 609- 624. [ Links ]
Wei, S., R. Chelliah, B. Park, S.H. Kim, F. Forghani, M.S. Cho and D.H Oh. 2019. Differentiation of Bacillus thuringiensis from Bacillus cereus group using a unique marker based on real-time PCR. Front Microbiol., 10:883. [ Links ]
Weisburg, W.G., S.M. Barns, D.A. Pelletier and D.J. Lane. 1991. 16S ribosomal DNA amplification for phylogenetic study. J. Bacteriol., 173: 697-703. [ Links ]
Whitchurch, C.B., P.C. Ragas and J.S. Mattick. 2002. Extracellular DNA required for bacterial biofilm formation. Science, 295:1487. [ Links ]
Yang, Q., D. Wilson, X. Chen y L. Shi. 2013. Investigación experimental de las interacciones entre el campo de la temperatura y la bioincrustación en una corriente de aguas residuales tratadas sintéticamente. Biofouling, 29: 513-23. [ Links ]
Received: December 14, 2018; Accepted: July 24, 2019
 Este es un artículo publicado en acceso abierto bajo una licencia Creative Commons
