


 texto en
  Inglés (pdf)
 Articulo en XML
 Referencias del artículo
 Enviar articulo por email
 Citado por SciELO
  Citado por Google
  Similares en
SciELO
Similares en
SciELO  Similares en Google
 Permalink
INTRODUCTION
The first oceanographic studies of the Caribbean Sea were made in the 1920s (Nielsen, 1925; Jacobsen, 1929). The general circulation, the water masses, and their origin were studied between 1933-1934 (Parr, 1937), mentioning a possible occurrence of upwelling in the southeast of the Caribbean. Years later, its stratification and movement were studied (Wüst, 1963, 1964; Gordon, 1967). In 1958, hydrographic observations near the north coast of South America indicated that in eastern Venezuela the surface temperature was lower than in the north and center of the Caribbean. This was the initial evidence of water upwelling (Richards, 1960) and based on salinity and dissolved oxygen in sections from the coast to 13 °N and from 62° to 69 °W. A few years later, the presence of upwelling was verified in the Guajira of Colombia (Gordon, 1967; Perlroth, 1971; Corredor, 1977; Fajardo, 1979), where several studies have been carried out based on indirect measurements and in situ data from cruise ships that have taken into consideration temperature and salinity (Andrade and Barton, 2005; Paramo et al., 2011; Bastidas-Salamanca et al., 2017; Murcia-Riaño et al., 2017).
The hydrographic and chemical conditions of the Venezuelan Caribbean were discussed by Richards (1960) and the influence or distribution of the waters of the Orinoco River by Gade (1961). The relationship between upwelling and wind with currents and bottom topography was studied by Fukuoka (1962, 1963, 1965a) and the relationship between water masses and the Amazon and Orinoco rivers by Ljoen and Herrera (1965), who determined the transport towards the north of the surface water, by the ascent of deep waters to the north of Margarita Island. The maximum upwelling occurs ~90 km from the coast where divergence forms (Gordon, 1967). The lower coastal temperature is caused by upwelling related to the wind (Fukuoka et al., 1963; Fukuoka, 1964) and also by a countercurrent to the east, from the coast to ~13 °N and 63 to 64 °W, facilitated by bottom topography (Fukuoka, 1965b). In the east-west direction, the upwelling covers the state of Sucre, with the peninsulas of Paria and Araya, and the state of Nueva Esparta (Margarita, Coche, Cubagua islands) to the vicinity of La Tortuga Island (61° 50'-65° 25' W) and the western basin of the Cariaco fossa, where the upwelling is less intense (Okuda et al., 1974).
According to Okuda (1978, 1981), in eastern Venezuela three water masses are identified: Surface (temperature: > 24 °C; salinity: < 36.7), Subtropical (temperature: 21 to 24 °C; salinity: > 36.7) and Subsurface (temperature: < 21 °C; salinity: 36.7). If the winds have a speed of > 6 m/s, they cause an intense upwelling (Herrera and Febres, 1975) and Subsurface Waters emerge. Meanwhile, moderate winds raise Subtropical Waters (Okuda, 1981). The waters rise from depths between 90 and 175 m and are noticeable up to 150 km off the coast (Herrera and Febres, 1975); the thermocline is between 16 and 26 m (Margalef, 1969). It is also mentioned that, in the middle of the year, another upwelling of less intensity occurred in this region (Rueda-Roa et al., 2018).
In the last century, since the 1970s, eastern Venezuela has been investigated from a geological, physical, chemical, and biological point of view is perhaps the best known marine region in the Caribbean. Until at least 2015, multidisciplinary projects were carried out commissioned by the oil industry (Liñero-Arana et al., 2009). In the Cariaco Trench (eastern basin), from 1995 to 2017 -a period that, due to its duration, has been unique in the Caribbean- a station (10.50 °N, 64.66 °W) called Cariaco was sampled to study biogeochemical and ecological processes (Müller-Karger et al., 2019).
The rise of deep waters that reach the surface is upwelling in the strict sense, which can be considered synonymous with high aquatic productivity; it is about waters rich in inorganic nutrients that use microalgae that rapidly increase their biomass and thus favor a greater proliferation of secondary producers and a great abundance of fishery resources usable by other aquatic organisms and by the man who catches them. The main upwellings of the southern Caribbean occur in two areas (Figure 1): east of Venezuela (63-65 °W) and west (70-73 °W) in the Colombian Guajira (Rueda-Roa, 2012). Upwelling has also been identified between Santa Marta and the Tayrona National Natural Park (Paramo et al., 2011; Murcia-Riaño et al., 2017).
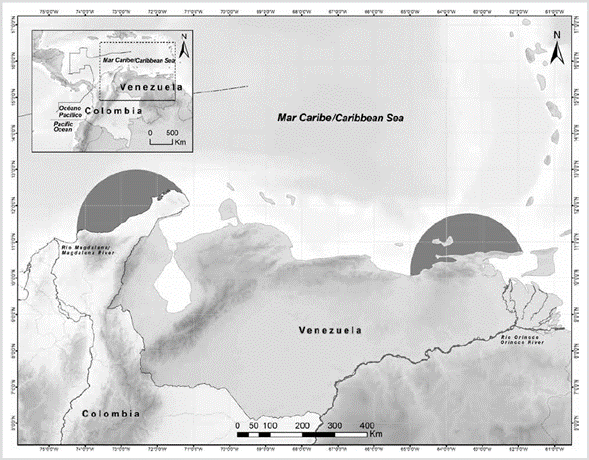
Figure 1 Map of the southern Caribbean showing the upwelling areas of Colombia and Venezuela, roughly defined by the presence of the sardine Sardinella aurita.
Fisheries assessment studies in the southern Caribbean, financed by the European Economic Community (R/V Nansen) and carried out in 1988, estimated biomass of 1 580 000 tonnes (t) of small pelagic fish, mainly sardines, in addition to anchovies, carangids, scombrids, and barracudas (Stromme and Saetersdal, 1989). 78 % is present in eastern Venezuela and 18 % in Guajira de Colombia (Rueda-Roa, 2012). However, in Venezuela, the actual sardine catch figures are much lower because the maximum official production is 200 232 t per year (Gómez et al., 2008, 2014; Mendoza, 2015; Rueda-Roa et al., 2017). In 2005, the sardine crisis began: national fishing decreased by 50 % and more than 90 % on the island of Margarita. For about a decade the catches were less than 50 000 t. It has been verified that the crisis may be the consequence of a change in the ecological regime, due to low-intensity upwellings (Gómez, 2018a, 2019).
In Colombia, although there is limited fishing information in the upwelling area, in 1988 the presence of 100 000 t of small pelagic fish was estimated in La Guajira (Stromme and Saetersdal, 1989) and in 1997 evaluations estimated 15 680 t (Paramo and Viaña, 2002). In this region, the local oceanography is modulated by the intensity of the seasonal upwelling and its dynamics can influence the distribution and abundance of the resources (Paramo et al., 2003).
In Venezuela, national fish production has fluctuated between 250 000 and > 500 000 t at the beginning of this century. In 2010 it decreased to 167 600 t (Mendoza, 2015) due to the sardine crisis that began in 2005 (Gómez, 2018a, 2019). In the northeastern region, more than 60 % of the national production and the Caribbean Sea are captured (Gómez, 1996, 2001). In Colombia, fishing figures in the Caribbean reached 22 000 t in 2014 and 23 500 t in 2018, of which the Guajira contributed less than 400 t from artisanal fishing (Carlos J. Polo, pers. comm.). In eastern Venezuela, trophic models estimate a biomass of 122 t/km2/year (Mendoza, 2003); in La Guajira, 68 t/km2/year (Criales-Hernández et al., 2006).
As can be seen, in the two coastal upwellings, fishing production is very unequal. This review raises and discusses the probable causes of this inequality, although this phenomenon has its main cause in the northeast trade winds that affect both countries. Compared with eastern Venezuela, during the 1998-2009 period, the wind speed in La Guajira was 1.3 times stronger (Rueda-Roa, 2012) and the upwelling of waters is theoretically more intense. Therefore, the abundance of fish such as sardines or related should be greater and, in general, there should be a higher fish production than in Venezuela, but this does not happen. It has been proposed that in the southern Caribbean Subtropical Water feeds upwelling, which is why it is assumed that in foci with similar temperatures there must be the same nutrient content (Rueda-Roa, 2012) as was proposed decades ago (Corredor, 1977, 1979). However, that does not seem to be the reality. Aspects related to the wind, the hydrography of emerging waters, the concentration of nutrients, the biomass of the phytoplankton, the importance of the continental shelf, the contribution of rivers, and the presence of islands, among other factors, are mentioned. Also, the upwelling indices and hypotheses of upwelling intensification due to global warming, inclusive, are discussed.
From both sources, but especially from the Colombian one, since the end of the 20th century, numerous articles have been published that use data obtained through satellite technology, which have greater spatial coverage and periodicity and are optimal for dynamic studies. However, the complex processes of oceanic atmosphere-surface interaction make geophysical data on ocean color obtained from space produce great uncertainty; The results are an approximation and must be validated with field observations (Bastidas-Salamanca et al., 2017).
Several oceanographic processes converge in La Guajira. It is a region influenced by the Caribbean current and the Panama-Colombia cyclonic turn that affects the area through the Darien Countercurrent, also known as Colombia (Andrade, 2001). The area has been characterized by satellite images, which associate surface temperature with chlorophyll concentration (Bernal et al., 2010; Ruiz-Ochoa, 2011; Sarmiento-Devia et al., 2013; Alonso et al., 2015; Gutiérrez -Leones et al., 2015; Santos et al., 2016; Bastidas-Salamanca et al., 2017; Beier et al., 2017; Dueñas-Lagos et al., 2017; Murcia-Riaño et al., 2017; Montoya et al., 2018; Del Rosario et al., 2019; Correa-Ramírez et al., 2020, among others).
1. WINDS
The meteorology of the Caribbean can be described in terms of wind and rainfall, as well as the space-time variability determined by changes in atmospheric pressure in the intertropical convergence zone (ITCZ) of the trade winds, a low-pressure belt near Ecuador that controls the regimes of precipitation and winds (Andrade and Barton, 2013). In the dry season (December to June) or windy, the ITCZ is in a more equatorial position (0-5 °S) and the northern trade winds dominate the area. Since July, the ITCZ moves to a more northern latitudinal position, up to 10-12 °N, and encourages rainfall (Aparicio, 2003).
Colombian Guajira. During 1987-1988, the wind field in the central Caribbean was characterized by satellite data. Near the coast, maximum values of > 9 m/s occur. There is also information about the annual periodicity of winds (dry season) from December-March, another period with slightly strong wind (July-August), and the rainy season (September-November) with the weak wind (Andrade, 1993). Most of the year, the wind is directed towards the west, but, when it is strongest (December-March), the direction changes towards the southwest, parallel to the coast; the maximum velocity appears towards 15 °N (Andrade and Barton, 2005). The wind direction is aligned with the coast and the sheld, which leads to Ekman transport off the coast and the upwelling of Subsurface Waters in the coastal zone (Andrade et al., 2003; Andrade and Barton, 2005; Lonin et al., 2010). The intensity of the wind is greater than in other upwellings in the world: 7.2 m/s in Benguela; 7.8 m/s in California; 6.8 m/s in NW Africa; 5.7 m/s in Peru and 9.5 m/s in La Guajira (Chávez and Messié, 2009). The above suggests that the Guajira is the western edge system that could produce the highest upwelling volume per unit area in the world (Paramo et al., 2011).
Between 1992-1999, the dynamics of the atmosphere and the ocean were studied with in situ measurements and remote sensing (Andrade and Barton, 2013). The presence of a zonal atmospheric cell (2000 km in east/west extension) made up of the northeast trade winds, which take the form of a jet wind at the surface level, was demonstrated. The position of the cell favors lush vegetation and desert areas on the continental coast for relatively short distances. During the dry season, the trade winds have a daily speed between 8 and 15 m/s with a southern component; in April-June, the winds weaken - being the "transition season"; during July-August, the winds intensify again -this period is called "verano". In the rainy season (August-October), the ITCZ moves north and allows the southern trade winds (winds ~4 m/s) to cross Central America and reach the Colombia basin, where they interact with the northeast trade winds and they cause atmospheric instability that can lead to the formation of tropical cyclones in the Caribbean. Between December-March, the jet wind reaches a speed of ~12 m/s towards the west, but with a southerly component; in May, the wind decreases (< 8 m/s) and in July (summer) it increases to > 9 m/s. The weakest winds appear in October during the rains (Andrade and Barton, 2013).
In the period 1999-2008, between 69°-74° W strong winds occurred throughout the year (> 6 m/s); the maximums in June-July (> 9 m/s) and the minimums (6-7 m/s) in September-October. The strongest winds occurred between 74°-76° W, with maximums in December-April (> 11 m/s), a secondary maximum in July (> 9 m/s), and minimums during September-October (~5 m/s). It is mentioned that, in the southwestern Caribbean, the average wind was 8.23 m/s (Rueda-Roa, 2012; Rueda-Roa and Müller-Karger, 2013). During 1999-2009, Ekman pumping was positive near the coast, transport to the north and northwest, and the maximum magnitude to the east of the Colombia basin (Pareja et al., 2013). The mathematical morphology of the upwelling indicates its conduction through the ITCZ. Its relationship with the east-west component of the trade winds has a lag of four months. It is also related to the southern oscillation (Alonso et al., 2015).
Recent studies indicate that, in the months of intense winds, the upward movement of water is complete and clear on the surface. During the rainy season, the ascent can be partial, without the Subsurface Waters emerging.
The upwelling can be interrupted by short-term (days) atmospheric disturbances -such as cold fronts related to northerly winds (Northerners)- and by warm fronts associated with air masses from the eastern tropical Pacific, which generate favorable conditions for the downward flow (sinking) in the top layer. During these periods of relaxation, the mixed layer is warm (Montoya-Sánchez et al., 2018). In the rainy season, the wind is favorable to upwelling, but the upper layer of the ocean does not respond to the forcing of the wind, which does not have enough intensity and duration to raise deeper isotherms to the surface. Hence, geostrophic flows favor the flow of less dense waters towards the coast, which further inhibits the rise of cold waters (Montoya-Sánchez, 2019). The highest values of the upwelling index (258.6 m3/s per 100 m of coastline) are registered in February and then decrease in the last months of the year (19.8 m3/s in October), but in July it stands out a high value (237.6 m3/s). It has been suggested that, due to the maximum wind and upwelling index, it is possible to conclude that the main fertilization mechanism is advection from the east and not Ekman's transport (Murcia-Riaño et al., 2017).
Eastern Venezuela. Since the mid-1970s, wind speed values have been cited, whose speed must be > 6 m/s to cause upwelling. The maximum values occur from January to April, with another maximum in June-July and with minimum speeds in August-October. The winds come from the ENE and NNE, but with a southern component in August-November (Herrera and Febres, 1975). With the information from coastal stations (1969-1990), the average monthly velocity (> 4 m/s) occurs from January to May, with maximums of 5 m/s in March and < 4 m/s from June to December and minimums (3 m/s) in September-October (Aparicio, 2003). The data obtained (1950-1990) by merchant vessels (COADS and Nesdis) are considered underestimated; the realistic maximums and minimums are of the order of 7 and 5.5 m/s, respectively (Freón and Mendoza, 2003). From December to June, the wind predominates towards the west with maxima close to 6.5 m/s; the rest of the year they are more variable and can decrease to 5.1 m/s (Freón and Ans, 2003).
Between 1994-1997, the winds had an average speed of 7.8-8 m/s and upwellings predominated until April. In the rainy season (May-November), a weak upwelling or even sinking could occur in response to SSE winds with a velocity of ~5 m/s (Walsh et al., 1999). At the Cariaco station (November 1995-December 2001), the wind reached speeds of 8-9 m/s in February-March and minimums of < 4 m/s in September-October (Astor et al., 2004). Satellite products (1999-2008) of the southern Caribbean (68 °W) and near the coast (~25 km) indicate that the winds are stable in December-July (> 6 m/s) and lower (4-6 m/s) in August-November (Rueda-Roa, 2012).
Between 1996-2010, the weakening of the trade winds (-1.9%/year) was verified due to the migration of the ITCZ to the north (1.12 °N of latitude) from the high-pressure center of the Azores (descending branch of Hadley cells) and the eastern progression of the Atlantic centroid (upward branching of the Hadley cells). Between 19962009, its position in March has changed by ~800 km (Taylor et al., 2012).
In 18 years of study (1996-2013), the upwelling showed temporary changes and a decreasing trend due to the decrease in the wind (Astor et al., 2014). In eastern Venezuela, persistent trade winds (3 to 9 m/s) on the shelf cause the Ekman transport and pumping offshore (high seas) and the decrease in surface temperature (1 to 3 °C). Its variability reflects atmospheric control by the North Atlantic anticyclone and regional evaporation. The upwelling implies an atmospheric circulation with a southerly overturn, which affects the frequency of hurricanes in the Caribbean (Jury, 2018). Table 1 shows the mentioned values. It can be concluded that, in the Colombian coastal upwelling, the winds are stronger while, in eastern Venezuela, they are slightly lower and with a decreasing trend in some years, which entails marked temporary changes in the upwelling and, even, no occurrence of the outcrop.
Table 1 Comparison of variables and/or important factors in the upwellings of the Guajira of Colombia and eastern Venezuela. The values mentioned in hydrography, nutrients, and chlorophyll-a correspond to surface water. The superscript after each value corresponds to the cited author.
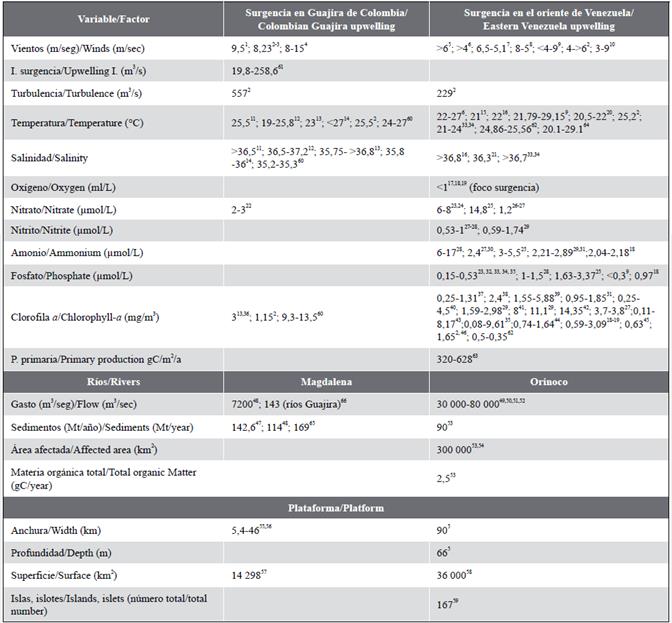
1 Chávez y Messié (2009); 2Rueda-Roa (2012); 3Rueda-Roa y Müller-Karger (2013); 4Andrade y Barton (2013); 5Herrera y Febres (1975); 6Aparicio (2003); 7Freón y Ans (2003); 8Walsh et al. (1999); 9Astor et al. (2004); 10Jury (2018); 11Fajardo (1979); 12Cabrera y Donoso (1993); 13Andrade y Barton (2005); 14Paramo et al. (2011); 15Astor et al. (2003); 16Astor et al. (1998); 17Gómez (2006); 18Gómez y Barceló (2014); 19Gómez et al. (2014); "Castellanos et al. (2002); 21Müller-Karger et al. (2004); 22Corredor (1977); 23Richards (1960); 24Bonilla et al. (1993); 25Ballester (1965); 26Okuda (1978); 27Mandelli y Ferraz (1982); 28Kato (1961); 29Gómez et al. (2008); 30Richards y Vaccaro (1956); 31Gómez y Chanut (1988, 1993); 32Hulburt (1966); 33Okuda et al. (1969); 34Okuda (1981); 35Ferraz (1989); 36Corredor (1979); 37Maigalef (1965); 38Morris et al. (1981); 39Cabrera (1987); "Pineda y Aguado (1980); 41Varela et al. (2003); 42Gómez (2006); 43Ferraz (1987); 44Moigis (1986); 45Müller-Karger y Varela (1988); 46Muller-Karger (2013); 47Restrepo-López et al. (2015); 48Restrepo y Kjerfve (2000); 49Rabinovich y Novoa (1982); 50Meade et al. (1983); 51Lewis y Saunders (1989); 52Monente (1990); 53Blough et al. (1993); 54Müller-Karger et al. (1989); 55Álvarez-León et al. (1995); 56Paramo et al. (2003); 57Chasqui et al. (2013); 58este trabajo/This paper; 59Gómez (1996); 60Franco-Herrera et al. (2006); 61Montoya-Sánchez (2019); 62Lorenzoni (2017); 63Müller-Karger et al. (2019); 64Calvo-Trujillo et al. (2018); 65Higgins et al. (2016); 66Beier et al. (2017).
Commentary on winds and upwelling rates
The Venezuelan upwelling has interannual variations due to changes in wind speed, which acts as pulses and intensifies the phenomenon (Astor et al., 2004, 2014). In 1998, the upwelling was weak and subsidence was observed at the Cariaco station (Müller-Karger et al., 2004). The upwelling occurs until April-May if the ENE trade winds have a speed of ≥ 8 m/s. With this wind, fish production is optimal in upwelling areas (Cury and Roy, 1989). However, in eastern Venezuela, the wind values are less intense on the northeastern shelf, where the greatest fishing activity occurs. At the Cariaco station, the wind reached 8-9 m/s, but it was located downwind of the intense upwelling and far from the coast (depth > 1000 m).
In the southern Caribbean, winds with different average speed are recorded: moderate (6.3 m/sec) to the east -of 68 °W (Venezuela); strong (8.3 m/sec) -between 69°-74° W (Guajira), and intense -of 8.7 m/sec between 74°-76° W (outside Colombia). In this area, the upwelling process is less efficient due to a lower proportion of winds aligned with the direction of the coast (85 % and 94 % for the western and eastern areas of the southern Caribbean). Also, to the west, a slightly higher latitude is reached and the Coriolis parameter causes ~10 % less transfer from the wind to the upwelling (Rueda-Roa, 2012). In the eastern part of the Cariaco basin (1994-2009), Ekman transport ranged between 1.35-2.77 m2/s (Lorenzoni et al., 2017).
In La Guajira, the highest values of the upwelling index (258.6 m3/s per 100 m of coastline) are registered in February, decreasing in October (19.8 m3/s) and reaching 237.6 m3/s in July (Murcia-Riaño et al., 2017). In the Colombian upwelling, transport is 1.5 times larger than in eastern Venezuela because the winds are 1.3 times stronger. Consequently, in the water column, turbulence is ~2.5 times greater in the west than in the east (557 and 229 m3/s, respectively). This is very important because it can limit fish production by dispersing plankton and transporting larvae offshore and deeper; likewise, it has been proposed that in La Guajira nutrients are exported before being used in the upwelling (Rueda-Roa, 2012). Similarly, the direction of the coast must be considered, which in Colombia is to the southwest (Punta Gallinas to Camarones) and from east to west (Camarones to Santa Marta) while in Venezuela it is from east to west.
To determine the influence of the wind as a factor responsible for upwelling, indices have been established (Bakun, 1973) because they give an idea of Ekman's transport as an index of the water that rises to replace the surface water displaced by the wind. Likewise, indices are calculated using atmospheric pressure fields (geostrophic winds) and water surface temperature (Aparicio, 2003), and with the wind and temperature variables correlations are established for predictive models (Herrera and Febres, 1975).
In Venezuela, wind data from meteorological stations (Herrera and Febres, 1975; Aparicio, 2003), maritime wind and sea temperature (1950-1990) by merchant ships (Freón and Ans, 2003) have been used. The problem with these data is that the ships generally exceed the shelf and the Venezuelan upwelling is coastal, so perhaps the data from the fixed stations are more appropriate, which are also biased by interference from sea winds (land and sea) with the trade winds (Freón and Mendoza, 2003).
According to ship records (1950-1990), the average shows stable maximums between December-June with values close to 6.5 m/s, which decrease to 5.1 m/s in other months. The temperature showed great regularity, with minimums of < 26 °C in February-March and maximums of > 28 °C in September-October (Freón and Ans, 2003). However, values of < 26 °C are too high to indicate upwelling in Venezuela because 21-22 °C on the surface are a sign of intense upwelling. Having conflicting data on winds and temperature, it is difficult to apply the hypothesis of the optimal recruitment window in the Venezuelan case, since the coastal data indicate that the reproduction of the Venezuelan sardine (Sardinella aurita) occurs below the optimal value of 5.5 m/s while, for the vessels, it occurs around the optimal value (Freón and Mendoza, 2003). The reproduction of the Venezuelan sardine occurs in areas close to the coast (Gómez, 2006, 2015; Gómez and Hernández, 2008). In general, the recruitment and optimal window hypotheses, among others, may be useful in the areas where they were formulated, but they have doubtful applicability in tropical ecosystems, such as Venezuela.
The recent trend is to use indices that include other variables to try to predict with more realism and to be able to explain the variability of populations. For example, in long time series, the nutrient index that uses nitrate and temperature responds better to predict chlorophyll concentration and abundance of zooplankton (García-Reyes et al., 2014). In the same way, it is recognized that the management of pelagic ecosystems must integrate physical studies with biological functions because the seasonal variation of favorable winds for upwelling influences species differently, as is the case of the sardine in California (García-Reyes et al., 2013), and the sardine Sardinella aurita from the South Caribbean.
2. HYDROGRAPHY OF THE WATER THAT EMERGES
Colombian Guajira. In September 1972, oceanographic observations in the Colombian Caribbean (71°-75° W), in the vicinity of the Guajira peninsula (72° W), found waters with a temperature of 25.5 °C and salinity of > 36.5 and movements ascending with an intensity of ~114 m/month (Fajardo, 1979). In 1975, during the upwelling, the maximum concentrations of nitrate on the surface were 2-3 µmol/L (Corredor, 1977), values that reflect the source or mass of Subtropical Subsurface Water (SUW). Phytoplankton growth is less than in other upwellings due to the relative impoverishment of the source water (Corredor, 1979). It is mentioned that SUW upwellings, with temperatures between 22.6-25.8 °C and that in active upwelling foci it has up to 19 °C and salinities between 36.5 and 37.2 (Cabrera and Donoso, 1993). In 1994 (April), the strong focus was located at 12.5 °N, with a surface temperature of 23 °C and an isotherm around 25 °C. Up to 100 km from the coast, cyclonic circulation was observed (Andrade y Barton, 2005).
In 1998 (February), the surface temperature was 23 °C (salinity > 36.8), but at the edge of the shelf, from the surface to 200 m depth, salinities of 36.4 were found. In November 1998 it was characteristic that the emerged water was surrounded by warm water with lower salinity -up to 35.75 (Andrade and Barton, 2005). South of La Guajira, in Tayrona Park (September/1999-May/2000), the temperature varied between 24.0-27.0 °C and the salinity between 35.235.3 in the dry season (upwelling) (Franco-Herrera et al., 2006). In La Guajira, researchers have focused on indirect measurements and in situ data from cruise ships, which determine temperature and salinity (Andrade and Barton, 2005; Paramo et al., 2011). Recently, these variables, in addition to dissolved oxygen and nutrients, have been extracted from the climatology of the world Ocean Atlas 2009 (Bastidas-Salamanca et al., 2017; Murcia-Riaño et al., 2017).
During 1981-2000, the surface temperatures obtained by ships (COADS) indicate that, in the low and high Guajira, the average was 27.08 °C. In February-March, the minimums (24.43 and 24.50 °C) are presented and in October-November the maximums (29.45 and 29.54 °C), with an annual interval of 4.95 and 5.07 °C (Bernal et al., 2006). Near the coast (late 2005 to February/2006), surface temperatures were ≤ 27 °C (salinity of 36) and 23 °C (salinity of 35.8), at a depth of > 30 m (Paramo et al., 2011). It is also mentioned that it is SUW (Wüst, 1964; Fajardo, 1979; Bula, 1990) located between 100 and 200 m deep (Hernández and Joyce, 2000). However, it is considered that the water that supplies the upwelling in the Guajira may be influenced by a coastal branch (extreme south) of the Panama-Colombia gyre, which flows 100 m deep and in an eastern direction (Andrade, 2001; Andrade et al., 2003; Jouanno et al., 2008) as a subsurface current (Beier et al., 2017), its origin determines the low amount of nutrients in the water that emerges with the upwelling (Paramo et al., 2011). The cyclonic gyre is more than 200 km wide and has an average speed of > 60 cm/s (Bernal et al., 2010). The western part of the gyre persists throughout the year (Centurioni and Niiler, 2003), but the eastern part flows out of the Darien Gulf, forming the Panama-Colombia Countercurrent (Andrade, 2001; Ruiz Ochoa, 2011), whose intensity varies with seasonality. The countercurrent becomes more pronounced in the rainy season (wet) and extends to La Guajira (Donoso, 1990). In general, in waters of the continental shelf and slope of the Central American Caribbean (Belize to the southern Colombian Caribbean), where the gyre is formed, the vertical profiles are typical of oligotrophic waters (Aguirre and Salmerón, 2015; Brenes et al., 2017) and in the first 100 m the temperature varies little (Sheng and Tang, 2003). Consequently, the Panama-Colombia gyre is oligotrophic.
The analysis of changes in the intensity of the upwelling between 1982-2014 (Santos et al., 2016) determines differences between warming in the open sea (~ 0.25 °C/dec) and coastal localities that have moderate non-significant cooling (~-0.05 °C/dec). In the months of strong upwelling (January-March), the minimum temperature (24.5 °C) was between 73° and 72 °W and the maximum upwelling rate (4 m2/s) between 75.5° and 74.5 °W. The displacement of the minimum temperature towards the east (~ 2 °) may be related to the flow of water caused by the coastal countercurrent of the Caribbean (Andrade et al., 2003; Jouanno et al., 2008). These waters are most intense between December and May (Bernal et al., 2010).
It is mentioned that in the Colombian Caribbean (Bastidas-Salamanca et al., 2017) low salinity has been observed since August associated with plumes from the Orinoco and Amazon rivers, which extend throughout the Caribbean between August-November, three to four months after the maximum rainfall (Chérubin and Richardson, 2007). In October-November, they join the pulse of the Magdalena River and other rivers that drain into the Caribbean. This corresponds to the lowest salinities in the annual cycle, which carry nutrients that come from the continent. Likewise, it is mentioned that in eastern La Guajira there is a high concentration pulse in February and July, which could be explained as an advection from the east; however, there is no evidence of a direct contribution associated with the emergence of the Guajira (Bastidas-Salamanca et al., 2017). It is also mentioned that the upwelling is almost permanent due to a combination of the coastal morphology, the bathymetry and the persistence towards the west of the trade winds; the most important event occurs between December-May and another weak upwelling in June-August due to the intensification of the low-level jet wind from the Caribbean (Cook and Vizy, 2010). With harmonic models, Del Rosario et al. (2019) established upwelling predictions with a horizon between 4-6 months.
The explanations for the low productivity in La Guajira are varied: oligotrophic waters (Andrade et al., 2003) reduced efficiency in the transfer of energy by the wind (Rueda-Roa and Müller-Karger, 2013), and of that in June-December surface waters have low salinity as they originate in the southwest of the Colombia basin, which favors stratification and warming and inhibits vertical mixing (Beier et al., 2017). It has also been suggested that depending on the time of year, the source of fertilization comes from the east, through mesoscale eddies, transporting nutrients from the Gulf of Venezuela, from nearby upwelling sources and even from the Cariaco basin (eastern Venezuela), or it comes from the west, by the discharge of the Magdalena River, and is transported by the Caribbean Countercurrent (Murcia-Riaño et al., 2017).
With satellite data (1999-2008), it was established that the average annual surface temperature is ≥ 25.5 °C. In Santa Marta, the lowest annual amplitude was found (2.8 °C), with an upwelling limit of 75.5° W, because up to 77° W the annual average is 27.4 °C (Rueda-Roa, 2012). The upwelling affects an area of 110,000 km2 in the southwestern Caribbean (Castellanos et al., 2002).
Recently, using numerical models and some oceanographic profiles (Correa-Ramírez et al., 2020), it has been suggested that Subtropical Water emerges in the upwellings of La Guajira and Venezuela, which forms on the Nicaraguan platform and is transported below the gyre. Panama-Colombia by the Colombia Countercurrent (average speed of ~0.28 m/s). The lower salinity observed in the upwelling waters results from intense vertical mixing processes. From Nicaragua, the current travels between 2600 and 4400 km before reaching Guajira and eastern Venezuela, with a residence time of 3.6 and 6.1 months, respectively. Before emerging on the coasts of both countries, this time contributes to the increase (or decrease) of nutrients in Subtropical Water (Correa-Ramírez et al., 2020). It has also been concluded that warming occurs in the entire surface layer in the Guajira upwelling (Montoya-Sánchez, 2019).
Eastern Venezuela. Based on information from ships (COADS) between 1959-1990, the surface temperature shows regularity with minimum values of < 26 °C in February-March and maximum values of > 28 °C in September-October; the range of variation is less than coastal measurements (Freon and Ans, 2003). Based on tide gauge data (1968-1986), the surface temperature had a minimum of ~22 °C in the first quarter of the year, with maximums of ~27 °C in September-October and an annual amplitude of 5 °C (Aparicio, 2003). It is mentioned that there was difficulty in recording regional hydrography because permanent oceanographic observations have been infrequent; furthermore, an irregular pattern occurs in the vertical movement of water, so the isotherm of 21 °C on the surface is used to define strong or intense upwelling, although in 1997 and 1998 the 23 °C isotherm was the one that surfaced (Astor et al., 2003). Likewise, in 1933 and 1937, the surface temperature was 24 °C, which showed that the upwelling was not intense (Herrera and Febres, 1975).
In the Cariaco time series (1995-2017), upwellings were observed in the first years (December/1995 and April/1996), when the surface temperature was < 22.5 °C. In December/1996-May/1997 it was < 22 °C. In both events, salinity was > 36.8 on the surface. They also mention that at 120 m the dissolved oxygen had a concentration of 2.6 ml/L, a value observed at 50 m in February 1997, which indicated the ascent of deep waters (Astor et al., 1998). During the upwelling, the pH is low (< 8.0) in surface waters (Astor et al., 2017). Between November/1995-December/2001, the surface temperature varied between 21.79 and 29.15 °C. In 1997 and 2001, strong upwellings occurred when the 21 °C isotherm reached a depth of 1821 m, but in 1998 and 1999 the 21 °C isotherm had less intensity because it remained below 40 m, which is why the upwelling was weak (Walsh et al., 1999; Astor et al., 2004, 2005). In the east of Isla Margarita, in March 2003-2004, during the intense upwelling, dissolved oxygen values of <1 ml/L were determined on the surface (Gómez, 2006; Gómez and Barceló, 2014).
In 1996, by satellite images, 13 sources of upwelling were identified, of which 7 had temperatures between 21-22 °C (minimum 20.5 °C). When they are very intense, the foci unite to form extensive areas of cold water, which reach an area of up to 52 000 km2 (Castellanos et al., 2002), a value close to the previous estimate of ~55 000 km2 (Gómez, 1996). Depending on the intensity of the wind, the waters rise from a depth of 120-140 m, where the Subtropical Water that emerges in February-March is located, and then water with salinity of 36.9 reaches the surface. This phenomenon is appreciated until May. From August to October, the surface water is warm (> 28 °C) and of lower salinity (36.3), coinciding with the rainy season (Müller-Karger et al., 2004). Also, based on images (19992008), it is mentioned that, in the Venezuelan upwelling (east of 68 °W), the average annual surface temperature was 25.2 °C and the Subtropical Water depth (according to isobath 22 °C) is at 85 m (Rueda-Roa, 2012).
In the period 1994-2009, east of the Cariaco basin, the average temperature (December-July) was 24.86 ± 1.03 °C (Lorenzoni et al., 2017). On a ten-year scale, the surface temperature has increased ~1.0 ± 0.14 °C (Taylor et al., 2012; Astor et al., 2014); in the Gulf of Cariaco (2014-January 2015) it varied between 20.1-29.1 °C (Calvo-Trujillo et al., 2018). Recently, through satellite information and in situ data, it is mentioned that in the middle of the year (June-August) an upwelling is detected, which is warmer (~1-2 °C) compared to that of the first months (Rueda-Roa et al., 2018). In Table 1, values obtained on the surface are observed.
Intensification of upwellings due to global warming. It is pertinent to mention the debated approach on the intensification of upwellings proposed in the last decade of the 20th century. The hypothesis is that, due to greenhouse gases, global warming increases the temperature gradient between land and ocean and intensifies pressure gradients, which could accentuate wind stress along the coasts and intensify upwelling of water in the eastern limits of the major world oceans (Bakun, 1990). They are called "EBUE areas" (Eastern Boundary Upwelling Ecosystems), of which Humboldt, Bengal, California and the Canary Islands are the main ones, which contribute > 20 % of the world's fisheries (Pauly and Christensen, 1995). Its monitoring is important for the response of fisheries to global warming (Cheung et al., 2013; Payne, 2013).
The intensification of upwellings has studies that verify it (Bakun et al., 2010; Cropper et al., 2014; Sydeman et al., 2014; Oerder et al., 2015; Wang et al., 2015) and can cause changes in marine biota (Chávez and Messié, 2009; Sydeman et al., 2014). Other studies question it (Barton et al., 2013; Black et al., 2014). The hypothesis was raised two decades ago and in recent years, due to current global warming, interest in the subject has increased, but there is still no consensus (Gómez-Letona et al., 2017). Apparently, due to the increase in favorable winds, upwellings have intensified to the north of 21 °N, but south of 19 °N they have decreased due to unfavorable winds that propitiate the subsidence of surface water (Cropper et al., 2014). It is possible that this situation could occur in upwellings in the southern Caribbean, located between 10.2 and 12.5 °N.
Therefore, it is appropriate to refer to the Venezuelan sardine fishing crisis, which began in 2005 and lasted for about a decade (Gómez, 2018a). It is mentioned that the crisis was caused by overfishing of sardines in 2003 and 2004 (Rueda-Roa, 2012; Mendoza, 2015), when the annual catches were 200 232 t. However, the various hydroacoustic estimates agreed on the existence of 850 000 t exploitable (Gerlotto and Ginés, 1988; Stromme and Saetersdal, 1989; Cárdenas and Achury, 2002) and a biomass of up to 1 300 000 t (Cárdenas, 2003). Several studies also indicated that the sardine was being under-exploited (Freón and Mendoza, 2003; Freón et al., 2003) and/or stable (Guzmán and Gómez, 2000). In contrast, it has been suggested that the main cause of the current fluctuation of the sardine resource has to do more with the decrease in regional aquatic fertility because since 2005 upwellings have been weak (Gómez et al., 2012; Gómez and Barceló, 2014), the phytoplankton biomass has decreased notably (Gómez et al., 2014) and it is likely that the cause of the sardine crisis is a change in the ecological regime (Gómez, 2018b, 2019), which affected ecosystem services such as the fishing. Likewise, the weakening of the trade winds due to the migration of the high pressure center of the Azores to the north was mentioned (Taylor et al., 2012). This affects the lower intensity of the Venezuelan upwelling.
3. NUTRIENTS OF THE UPWELLED WATER
Colombian Guajira. The maximum nitrate concentration was 2-3 µmol/L, a lower value than in other upwelling areas, such as Peru and northwestern Africa (Corredor, 1979). In La Guajira, a mechanism for the enrichment of nutrients is the sand particles carried by the wind from desert areas, as observed in satellite photos. This is also the case in California and Northwest Africa (Andrade and Barton, 2005). Based on nutrient data (January-July) obtained from WOA09 climatological atlases and oceanographic cruises (June and October), the highest concentrations of nitrate are found at depths greater than 150 m and increase from January to July at the level of the bottom layer (150-500 m). In October, they fall to the lowest values (Dueñas-Lagos et al., 2017).
It is mentioned that the characteristics of the Colombian Caribbean, from the physicochemical point of view, have not been addressed; therefore two transects were analyzed, one longitudinal over 12 °N and the other latitudinal at 74 °W (Murcia-Riaño et al., 2017). In the longitudinal one, in February, the mixed layer is 50 m deep (average temperature: 25.5 ± 0.49 °C; salinity: 36.4 ± 0.10); There is no increase in nutrients: the average of phosphates, nitrate and silicates was 0.07, 1.73 and 2.3 µmol/L, respectively. These values show that there is not a pulse of high concentration of nutrients that comes from deeper layers. In July, the depth of the mixed layer is less (30 m) and the temperature increased 1.3 °C (average: 26.8 ± 0.39 °C) With this, it is estimated that a second upwelling pulse occurs, but it is not evident that waters with lower temperatures arrive from the subsurface; however, a pulse of high concentration of nitrates and silicates from the east is detected. In November, waters from the Colombia Countercurrent (temperature: 27.7 ± 0.27 °C; salinity: 35.8 ± 0.35) reach La Guajira and in the transect (12 °N) the silicates have a high concentration with values up to 10 µmol/L (Murcia-Riaño et al., 2017). Previously, it was mentioned that in the Central American shelf the waters are oligotrophic (Aguirre and Salmerón, 2015; Brenes et al., 2017). It has been argued that Subtropical Subsurface Water outcrops in La Guajira, which is located 100-200 m deep (Hernández and Joyce, 2000); however, it is suggested that the waters supplying the upwelling may be influenced by the Panama-Colombia gyre (Darien current), which in the region flows below up to 100 m deep (Andrade et al., 2003). This origin would determine the low amount of nutrients in the water that emerges (Paramo et al., 2011).
Eastern Venezuela. In the upwelling water, nitrate has a concentration between 6-8 µmol/L (Richards, 1960; Bonilla et al., 1993); 14.8 µmol/L between Margarita and Araya (Ballester, 1965), and 1.2 µmol/L in the Cariaco Trench and Gulf (Okuda, 1978; Mandelli and Ferraz, 1982). Nitrite ranges from 0.53 to 1 µmol/L in the Gulf of Cariaco (Kato, 1961; Mandelli and Ferraz, 1982) and from 0.59 to 1.74 µmol/L in the islands of Coche, Cubagua and the south de Margarita in 2004-2005 (Gómez et al., 2008). Ammonium concentrations between 6 and 17 µmol/L are mentioned in the first 50 m of the gulf and the Cariaco Trench (Kato, 1961). Also up to 2.4 µmol/L (Richards and Vaccaro, 1956; Mandelli and Ferraz, 1982) and from 3.0 to 5.5 µmol/L between Araya and Margarita (Ballester, 1965). On the island Cubagua and the southeast of Margarita 2.21 and 2.89 µmol/L are cited in the first 20 m depth (Gómez and Chanut, 1988, 1993; Gómez et al., 2008). In the 2003-2004 upwellings, the average concentration was 2.04 and 2.18 µmol/L east of Margarita (Gómez and Barceló, 2014). It is mentioned that ammonium concentrations are low when nitrite and nitrate are high (Gómez and Chanut, 1993) and it was commented that, in the area, the limiting nutrient for microalgae may be ammonium (Salazar-Gómez et al. 2011; Gómez et al., 2012). In the decade 2003-2012, ammonia had the highest concentrations during 2003 in Margarita (Figure 2). For phosphate, the surface range is 0.15 to 0.53 µmol/L (Richards, 1960; Hulburt, 1966; Okuda et al., 1969; Okuda, 1981; Ferraz, 1989). They are also cited between 1-1.5 µmol/L (Kato, 1961) and 1.63-3.37 µmol/L (Ballester, 1965) and in the Cariaco station <0.3 µmol/L (Astor et al. , 2004). In Margarita, during the strong upwellings of 2003 and 2004, averages of up to 0.97 µmol/L were determined (Gómez and Barceló, 2014). In the Orinoco plume (eastern Granada Island), ammonium and urea had a concentration of 0.094 and 0.347 µmol/L, respectively; phosphate and nitrate are undetectable (John et al., 2012). Table 1 shows figures cited on the surface.
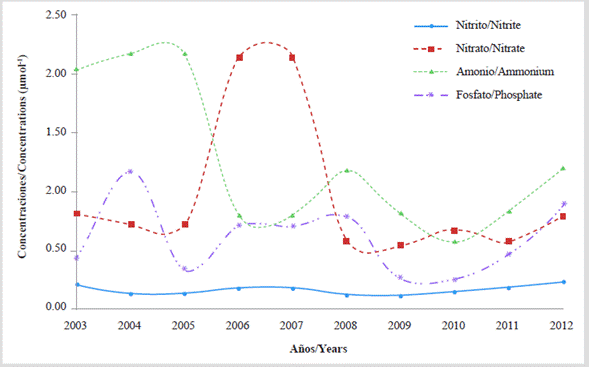
Figure 2 Annual variation of inorganic nutrients (µmol/L) in the water column (up to 20 m every 15 days) east of Margarita, Venezuela (decade 2003-2012; Gómez and Barceló, 2014).
According to the values of the hydrography and the limited information on nutrients, while there are no concrete data with temporary permanence, at least of medium range, the origin of the water that emerges in the Colombian Guajira is still not clear because some authors affirm oligotrophic waters arise. In the Venezuelan upwelling, the phenomenon presents large temporal variations, but it is clear that Subtropical Waters with higher concentrations of inorganic nutrients emerge than in the Colombian upwelling.
4. RIVERS
Colombian Guajira. In the southeastern Colombian Caribbean (departments of La Guajira and eastern Magdalena) there are 13 small rivers (Gaira, Manzanares, Piedras, Mendihuaca, Guachaca, Buritaca, Don Diego, Palomino, Jerez, Cañas, Ancho, Tapias and Ranchería), which, in total, discharge 143 m3/s and 4.51 km3/year (Beier et al., 2017). At the southwestern of La Guajira, in Barranquilla (Bocas de Ceniza), is the mouth of the most important river in Colombia, the Magdalena, which has a length of 1550 km and a basin of 257 438 km2. It discharges an average of 7200 m3/s (228 km3 of water per year) with a sediment load of 114 x 106 t/year. Peak discharges occur between October and December (Restrepo and Kjerfve, 2000). Between 1978 and 2010, the rivers that drain into the Caribbean Colombian downloaded on average 146.3 x 10⁶ t/year of sediment. Of them, Magdalena contributed 97 % (Restrepo-López et al., 2015). Between 1990-1999, discharges of up to 169 ± 73 x 106 t/ year are cited (Higgins et al., 2016), which are a source of nutrients for the Colombian Caribbean, especially the oceanic zone of La Guajira (Murcia-Riaño et al., 2017).
During the dry season, the Magdalena plume moves to the SW by the trade winds (Andrade and Thomas, 1988; Molina et al., 1996) and causes turbidity in the Amansaguapos Bay, where the continental shelf is 35 km wide and bottoms of fine sand (Pinzón et al., 1998). The upwelling nucleus in La Guajira and the mouth of the Magdalena are about 500 km apart; in satellite photographs, patches of pigments from the river are observed. The water has a high temperature (35 °C) and the current flows west, which prevents its waters from entering the upwelling system (Andrade and Barton, 2005). Mesozooplankton samplings up to 1000 m indicate that the community structure in La Guajira differs from the Magdalena plume and Rosario Islands (Gutiérrez-Salcedo, 2011). In images and by observations in situ at Cabo de la Vela, warm and fresh waters of Lake Maracaibo are evident; the upwelling is affected by these waters that reach up to 50 m deep. The plume from Lake Maracaibo discharges into the Gulf of Venezuela, where it turns to the west and joins the Guajira, thereby becoming a mechanism to enrich the region (Andrade and Barton, 2005), although it is possible that warm waters and less saline come from the Darien Countercurrent. Using images and numerical models, it is suggested that the flow from Lake Maracaibo to the Gulf of Venezuela is only possible when the trade winds decrease (Gómez et al., 2017) and chlorophyll varies between 0.1 and 5.2 mg/m3 (Rodríguez and Varela, 1987).
Eastern Venezuela. The intense upwelling occurs on the continental shelf, which receives the intrusion of estuarine water from the Gulf of Paria at its eastern end. The intrusion is discharged mainly by two navigable channels (Mánamo and Macareo) of the Orinoco River and enters the Caribbean through the Boca del Dragón, between the Paria peninsula and the island of Trinidad. During the months of maximum discharges, these waters affect the entire northeastern platform of Venezuela (Aparicio and Contreras, 2003), for which the Orinoco acquires greater importance, despite the fact that it also empties into the Atlantic through the enormous delta, which reaches 300 km in length, large main streams and numerous tributaries.
The Orinoco is 2101 km long and drains waters from a 1 250 000 km2 basin. Its flow varies between 30 000 and 80 000 m3/s in September-October, with an annual average of 36 000 m3/s (Rabinovich and Novoa, 1982; Meade et al., 1983; Lewis and Saunders, 1989; Monente, 1990), and discharge to the sea around 90 x 106 t/year of suspended material (Blough et al., 1993). Brackish waters have high concentrations of silicate and organic phosphorus, but are poor in nitrate and phosphate (Richards, 1960) and are devoid of nitrates (Bonilla et al., 1993). The influence of the great Orinoco is noticeable from July to the end of the year (Ljoen and Herrera, 1965; Febres, 1974; Okuda et al., 1974). The maximum discharges occur in August-September (Aparicio, 2003). To the southeast of the shelf, the low-salinity layer is 15 m high (Okuda et al., 1974) and moves with a speed of 15-33 cm/s (Moore and Todd, 1993); in September-October, the layer affects an area greater than 300 000 km2 (Müller-Karger et al., 1989; Blough et al., 1993).
In the second half of the year, the waters of the Orinoco affect Margarita Island, located 220 km from the Dragon's Mouth. Considering that the Caribbean current has a speed of 50 cm/s in October (Gordon, 1967), these waters would take five days to arrive (Gómez, 1996), which would explain their presence to the north of the island (Müller-Karger et al., 1989; Bonells et al., 1990; Müller-Karger and Varela, 1990) and by salinity of 15.95 in localities. It also affects the east and south of Margarita by values of 29.9-34.5 in other places and 29.55 in Cubagua Island (Gómez et al., 2008). Intensive studies verified that during July-December, south of Margarita, surface waters have lower salinity (Gómez and Chanut, 1993). However, it is stated that the bulk of the Orinoco waters are dispersed north of the Cariaco Trench and that the small but measurable decrease in salinity during the rainy season is due to local rivers (Tuy, Neverí, Manzanares) and not to the Orinoco River (Müller-Karger et al., 1989; Müller-Karger and Varela, 1990). This is not the case in the east and south of Margarita and the islands of Coche and Cubagua.
In the southeastern Caribbean, the dissolved and colored organic matter introduced by the Orinoco River is very important. It is estimated to discharge 2.5 x 10¹² g/year (~1 % of dissolved carbon in the oceans) and also large amounts of suspended (~80 mg/L) and dissolved (~34 mg/L) material (Blough et al., 1993). From photographs, it is determined that the extensive coloration of the plume corresponds to dissolved and colored organic matter (Odriozola et al., 2007) instead of being a highly productive plume of nutrients (López et al., 2013). Nitrate deficiency is reconfirmed (Bonilla et al., 1993), but it contains high values of ammonium and urea that favor phytoplankton (John et al., 2012). The photomineralization of dissolved (colored) organic matter in ammonia is the source of nitrogen for phytoplankton, which increases their biomass (López et al., 2013). These nutrients have a physiological effect, which increases the photosynthetic potential observed in waters influenced by the Orinoco plume and are detected up to 1000 km from its delta (Morell and Corredor, 2001). North of Trinidad, in surface sediments, the assemblage of planktonic foraminifera indicates a greater influence from the Orinoco plume than from the upwelling (Wilson and Hayek, 2019).
When river discharge decreases, its impact on the region is less due to the spatial reduction of the plume, which is reflected in the low estimates of primary production, as verified by its temporal variability (2002-2011) obtained from the color of the ocean. In 2005, the lowest estimates were obtained (López et al., 2013), coinciding with the most intense drought in the Amazon region in the last hundred years, driven by an abnormally warm tropical North Atlantic, which reduced the intensity of the trade winds from the northeast (Marengo et al., 2008).
The Amazon River has a length of 7062 km and a basin of 7 050 000 km2; discharges into the Atlantic a volumeequivalent to 18 % of the world's rivers; its average flow is 230 000 m3/s with a maximum flow of 300 000 m3/s in May-June (Goes et al., 2014); 20 % of the transported silica is exported, reaches the Lesser Antilles (Edmont and Boyle, 1981) and is verified in the eastern Caribbean (Ljoen and Herrera, 1965). From February to May, there are continuous currents from Brazil to the Caribbean Sea, which join the waters of the Orinoco off the coast of Venezuela (Müller-Karger and Varela, 1988). The maximum influence of the river occurs in June (Hu et al., 2004) and sedimentological studies on the Venezuelan shelf confirm the origin of particles from the Amazon (Van Andel, 1967; Milliman et al., 1982).
In the southeastern Caribbean, the discharge of these rivers is influenced by hydrological variations on the continent, guided by climatic changes caused by the annual translation of the ITCZ. When it moves south, it leads to increased rainfall in southern Ecuador and droughts or decreased rainfall in the north. However, various causes produce the reduction of rainfall over the Orinoco-Amazon basin to occur for longer periods; its evidence is verified since the Holocene, according to records of the deposition of titanium in the sediments of the Cariaco Trench (Haug et al., 2001) and when extrapolated to northern South America. These changes control variations in marine productivity in the eastern Caribbean and the impact of rivers, proving global connections with the regional climate (López et al., 2013). In La Guajira, there is no evidence of the effects of water from large rivers that contribute dissolved and colored organic matter, unlike the upwelling in eastern Venezuela, due to the immense contribution of the Orinoco River and relatively from the Amazon.
5. PHYTOPLANKTON BIOMASS
Colombian Guajira. In situ chlorophyll estimates are scarce; most of the values mentioned are derived from satellite images. Andrade and Barton (2005) cite a maximum chlorophyll-a of 3 mg/m3, a value comparable to that determined in situ by Corredor (1979). During the period 2002-2014, between Santa Marta and Cabo de la Vela, chlorophyll had a positive trend (0.05 mg/m/year), but from ~22 km from the coast it decreased (-0.01 to -0.05 mg/m3/year), and also from Cabo de la Vela to Punta Gallinas (-0.01 mg/m3/year), without verifying the oceanic trend (Gutiérrez-Leones et al., 2015). To the southwest of La Guajira (Tayrona Park), during the dry season (upwelling), in situ chlorophyll varies between 9.3 and 13.5 mg/m3, with low values during the rains, although the phytoplankton is more diverse. In both periods, the concentration of microplankton was higher than nano and picoplankton, but mesozooplankton was more abundant during upwelling (Franco-Herrera et al., 2006). The possible effect of the Magdalena River must be considered. With the 0.5 and 0.25 mg/m3 isolines, the direction and extension of the plume was delimited, which, in the dry season (December-April), moves towards the WNW and the rest of the year towards the NNW (Cañón and Santamaría, 2003). In December 2005, chlorophyll concentrations were higher when the winds had a lower intensity while in February 2006, the values were lower, despite the intense winds that favor upwelling. This physical-biological decoupling had not been documented (Paramo et al., 2011).
In the southern Caribbean (period 1998-2009), up to 100 km from the coast, the concentration of chlorophyll derived from photographs (Rueda-Roa, 2012) was estimated with emphasis on the eastern upwelling (63-65 °W) and western (70-73 °W). In both areas, during 8-9.5 months of the year, values of > 0.35 mg/m3 were calculated, but with wide variability (0.2 to 5.8 mg/m3). In the west, the annual average was 0.37 mg/m3 and in the east, 0.55 mg/m3. Meanwhile, in the central Caribbean, the average was 0.17 mg/m3 and in the Guajira upwelling it was 1.15 mg/m3. These values are lower than those cited for other upwellings, which range from 1.5 to 4.5 mg/m3 in California and NW Africa, respectively (Chávez and Messié, 2009).
Eastern Venezuela. The in situ determinations of chlorophyll carried out since the 1960s are numerous. It is mentioned that, between Margarita Island and the Araya Peninsula, the annual average in surface varies between 0.25 and 1.31 mg/m3, at 10 m between 0.08 and 1.48 mg/m3 and at 20 m between 0.09 and 0.90 mg/m3 (Margalef, 1965). Waters outside the Orinoco River, the concentration is 2.4 mg/m3 (Morris et al., 1981). Numerous studies have been carried out in Margarita: on the north coast it ranges between 1.55 and 5.88 with an annual average of 2.54 mg/m3 (Cabrera, 1987); in the southeast, 0.95 to 1.85 mg/m3 is cited (Gómez and Chanut, 1993), and on the south coast (El Guamache bay) it varies between 0.25 and 4.5 mg/m3 (Pineda and Aguado, 1980). In the southeast and south of Margarita, annual averages range between 1.59 and 2.98 mg/m3 (Gómez et al., 2008). Around Margarita, the maximum surface chlorophyll is 8 mg/m3 (Varela et al., 2003). On the island of Coche, the concentration is higher near the bottom (20 m), where there are values of up to 11.1 mg/m3 (Gómez et al., 2008). To the southeast of Margarita, during the intense upwellings of 2003 and 2004, the maximum values 014.35 mg/m3) were 10-12 m deep (Gómez, 2006) and the annual averages were comparable to the specific values i ndicated for the region (Ballester, 1965; Margalef, 1965). In the Gulf of Cariaco, values of 3.8 mg/m3 (Mandelli and Ferraz, 1982), 0.11 to 8.17 mg/m3 (Ferraz, 1987) and 0.08 to 9.61 mg/m3 (Ferraz, 1989) have been reported. In turn, averages of 0.74 and 1.64 mg/m3 are recorded in the Gulf and the Cariaco Trench (Moigis, 1986).
In the Cariaco station (1995-2005), the bio-optical properties of the waters were evaluated. Temporary changes in light penetration (euphotic zone) are caused by the concentration of phytoplankton, detrital particles and dissolved organic matter (colored), which have greater absorption during the period of upwelling (January-May). The depth of the euphotic layer (36.7 ± 12.3 m) and chlorophyll (> 1 mg/m3) is less, but it decreases (< 0.2 mg/m3) during the rains (June-November) and the euphotic zone is larger (47.9 ± 13.5 m). Furthermore, dissolved organic matter dominates the absorption of light and causes an overestimation (7 to 45 %) in chlorophyll values derived from photographs (Lorenzoni et al., 2011). In the eastern Cariaco basin (1995-2009), the average (December-July) of chlorophyll and primary production were 0.50 mg/m3 and 1.763 ± 994 mg/cmVday, respectively. In the western part of the basin, the temperature is higher and the chlorophyll and primary production values are lower (Lorenzoni et al., 2017). In the period 1995-2017, the primary production fluctuated between 320 and 628 gC m2/year (Müller-Karger et al., 2019). In the Gulf of Cariaco (2014-January 2015), chlorophyll varied between 0 and 17.5 mg/m3 (Calvo-Trujillo et al., 2018). The concentrations mentioned and determined in coastal areas of eastern Venezuela (Nueva Esparta and Sucre states) are markedly higher than the averages in relatively close areas. It should be remembered that the amount of phytoplankton can be classified as low when the concentration of chlorophyll fluctuates around 0.2 mg/m3 (Margalef, 1961).
From 2002 to 2018, on the continental shelf east of Margarita, two permanent stations were sampled (Gómez and Barceló, 2014; Gómez et al., 2014). In the first 10 years of the study, the highest annual averages of phytoplankton biomass were 2.91 and 3.09 mg/m3 in 2003 and 2004 (Figure 3). During 2005-2007, these decreased to 1.19 mg/m3 and in 2008-2009 the lowest annual averages were determined (0.91 and 0.59 mg/m3, respectively). In 2010-2012, the annual average increased slightly (1.281.51 mg/m3); these values were less than half of the phytoplankton biomass in 2003 and 2004 (Gómez et al., 2014). Likewise, when comparing the periods of upwelling (January-May) and relaxation (June-December), the highest averages (3.60 and 3.92 mg/m3) were determined in the upwellings of 2003 and 2004, but they decreased more than 60 % (0.68 to 1.51 mg/m3) between 2005 and 2009. In 2010 there was a slight increase to 2.40 mg/m3; however, in 2011 and 2012 it decreased again (1.82 and 1.44 mg/m3). During the relaxation period of 2003 and 2004, the chlorophyll concentration (2.68 and 2.20 mg/m3) was higher compared to the following years, which denotes a lower biomass of phytoplankton during that last period.
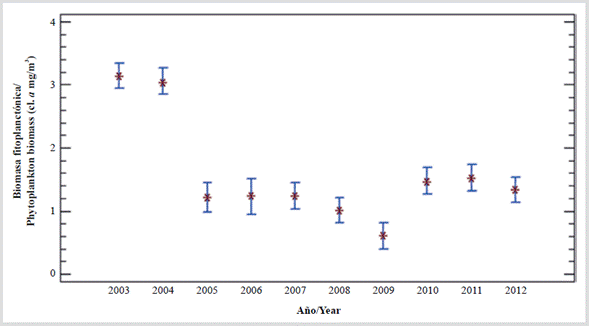
Figure 3 Annual variation of phytoplankton biomass (cl. a mg/m3) in water column (up to 20 m every 15 days) east of Isla Margarita, Venezuela (decade 2003-2012; Gómez and Barceló, 2014).
Since the end of the last century, estimates of chlorophyll have been made based on satellite images. The southern Caribbean is cited as having the highest concentrations (average 0.63 mg/m3), but with great annual variability (Müller-Karger and Varela, 1988). During the period 1998-2009, in the upwelling of eastern Venezuela, the biomass of phytoplankton had an annual average of 1.65 mg/m3, being higher than in the west (1.15 mg/m3) of the southern Caribbean (Rueda-Roa, 2012; Rueda-Roa and Müller-Karger, 2013). These figures are very low compared to the aforementioned on-site values.
In the Orinoco plume, in situ chlorophyll concentrations are lower than those calculated from images (Varela et al., 2003) due to the colored dissolved organic matter (Müller-Karger and Aparicio, 1994; Odriozola et al., 2007). Thus, between Venezuela and Puerto Rico, in a station located 85 km west of Granada, the images greatly overestimate the concentration -they infer between 2-4 mg/m3- while in situ they were 0.2 mg/m3 and a large proportion of chlorophyll was in the fraction < 2 µm of phytoplankton, which was stable with respect to nutrient depletion and with little nutritional stress (John et al., 2012).
In eastern Venezuela, the chlorophyll concentration is 1.4 times higher than in the western southern Caribbean (Rueda-Roa, 2012), but the estimated biomass of pelagic fish is four times higher (Stromme and Saetersdal, 1989). For this reason, there must be other explanations for the large difference in the biomass amount, especially of filter species such as sardines. On the other hand, there is no clarity on the matter because it is stated that, in eastern Venezuela, during September-October (weak upwelling), the sardine biomass is higher near the upwelling sources in the first 10 km of the coast, where chlorophyll values between 1-3 mg/m3 were observed, but in the hydroacoustic evaluation cruises, no correlation was found between the biomass of the sardine and the temperature and/or chlorophyll in situ (Rueda-Roa, 2012). It is possible that the difference in chlorophyll concentration in both upwellings (1.4 times) occurs because they are considered years after 2005, when the sardine crisis began -which lasted for more than a decade. During the large sardine catches of 2003 and 2004, the annual averages of chlorophyll-a were 3.09 and 2.91 mg/m3, and since 2005, when the crisis began, the biomass of phytoplankton decreased markedly (Figure 3) and remained that way for several years (Gómez et al., 2014). Also, downwind of the sardine area in the Cariaco station, the concentration of chlorophyll and the abundance of phytoplankton had a significant decrease (Astor et al., 2014). Table 1 shows surface values mentioned.
In the western upwelling of the southern Caribbean, in the middle of the year, the chlorophyll concentration is higher because it is related to greater turbulence (Rueda-Roa, 2012). However, in other upwellings, it is cited that concentrations derived from satellite images have an optimal relationship (maximum) with moderate winds and are minimum with weak or strong winds (García-Reyes and Largier, 2012). It is recognized that the chlorophyll concentrations derived from images are several times overestimating the true values, especially when the concentrations are < 5 mg/m3. Hence, it is considered reasonable to derive regional algorithms, especially in areas influenced by river discharges that affect the optical properties of the waters. This is the case of eastern Venezuela, which is explained because the standard algorithms come from oceanic waters (http://oceancolor.gsfc.nasa.gov) that cause large errors and an overestimation of between 4 and 19 times (Vazyulya et al., 2014). It is proposed that regional algorithms be determined based on local and satellite measurements, which must be simultaneous and with less error. However, it should certainly be noted that the on-site estimates are the actual ones.
It is concluded that in the Colombian Guajira the concentrations of chlorophyll-a are lower compared to those determined in eastern Venezuela, where numerous in situ estimates have been made, as well as those derived from images, which also have higher concentrations (~50 %). Considering that in both upwellings there is an important fishing resource such as sardines, whose recruits and adults feed on phytoplankton, that species should also be able to sustain a fishery in La Guajira.
Series of 10 years on the platform east of Margarita. Since 2002, biweekly observations at two fixed stations in the southeast of Margarita (depth reaches 35 m) confirm that in the 2003 and 2004 upwellings the minimum surface temperature was 21.6 °C (Gómez, 2006; Gómez et al., 2014) and that in the water column (up to 20 m) the annual average temperature was 24.5 and 25.0 °C, respectively. Meanwhile, in the period 20052012 the averages were higher (25.7 to 27.0 °C) and in 2010 the maximum point value (30.2 °C) was determined. Thus, during the upwellings of the period 2005-2012, the averages of temperature (Figure 2) and salinity in the water column indicated that it cannot be ascribed to the so-called type B (21 to 24 °C and > 36.7 salinity) of Okuda (1978, 1981), which is why no subtropical waters emerged during those years. Consequently, the upwellings were weak and/ or moderate in intensity because the isotherm of 21 °C did not rise, which is the indicator of intense upwelling, as is well known (Okuda, 1978, 1981) and accepted (Astor et al., 2003, 2004; Gómez, 2006; Gómez et al., 2008, 2012). This affects marine fertility and the availability of fishery resources, such as sardines (Gómez et al., 2014). Between 2005 and 2012 there was a noticeable increase in temperature (Figure 4), a situation that had been observed since mid-2005, when the temperature increased by around 2 °C east of Margarita and the sardine fishing decreased dramatically (Gómez et al., 2008). In 2003 and 2004, the average temperatures (< 25 °C) were conducive to a greater abundance of phytoplankton, which indeed occurred in those years (Gómez, 2006; Cellamare and Gómez, 2007). It is cited that in the months of the main upwelling (January-May), the sardine is found up to 70 km from the coast, but when the phenomenon weakens (September-October) it is concentrated in the first 10 km (Rueda-Roa et al., 2017).
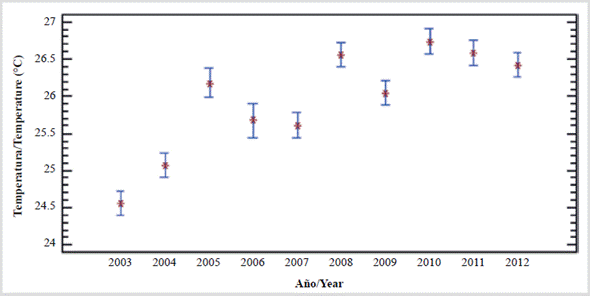
Figure 4 Annual variation of temperature (°C) in the water column (up to 20 m every 15 days) east of Margarita Island, Venezuela (decade 20032012; Gómez and Barceló, 2014).
6. CONTINENTAL PLATFORM AND PRESENCE OF ISLANDS
Colombian Guajira. Towards the southwest of Cabo de la Vela, the platform widens and reaches 46 km in front of Riohacha; later, in Palomino it decreases again and practically disappears in Tayrona Park and Santa Marta parks (Álvarez-León et al., 1995; Paramo et al., 2003). North of La Guajira, in front of Punta Gallinas, the shelf is very narrow: it is ~5.4 km. The distribution of the sediments characterizes three sectors: between the Buritaca and Camarones rivers, fine sand and mud predominate; from Riohacha to Cabo de la Vela, very coarse and fine sands, and from this cape to Punta Estrella, fine sand and mud again. Between Riohacha and Manaure, in the open sea sand predominates, while between Punta Espada and Punta Gallinas, at depths greater than 20-30 m, mud predominates (Paramo et al., 2012). The Guajira continental shelf has an area of 14 298 km2 between the Palomino River (11°25' N, 73°57' W) and Punta Castilletes (11°50' N, 71°18' W). Between Arenales and Cabo de la Vela, in depths between 3 and 20 m, the "sandbanks" constitute 47 % of the area (Chasqui et al., 2013).
Eastern Venezuela. In a south-north direction, it ranges from the continental coast to the edge of the platform (11°30' N), which has a width of 90 km and an average depth of 66 m (Herrera and Febres, 1975). It includes the underwater valley of Carúpano, which is part of the La Tortuga bank, whose length is 95 km (Maloney, 1971). It is the widest Venezuelan shelf, and by seismic records it has a sedimentary fill (> 700 m) that covers an underlying system of trenches and tectonic faults (Morelock et al., 1972); it is where the upwelling is most noticeable. On the shelf, the color of the sediments is related to their content of carbonates and organic matter: they are gray or yellowish when they have a high percentage of calcium carbonate and they are green or grayish green when they have abundant organic matter (Miró, 1974) which occurs in numerous areas such as the eastern portion of the Araya peninsula, the south of the islands of Coche and Cubagua and between the Los Frailes archipelago and the northeast of Margarita, among others. On the platform, the resuspension of cells from the sediment contributes to the higher concentration of chlorophyll (Müller-Karger and Aparicio, 2004). From the eastern end of the Paria peninsula (Punta Seca) to the west of Punta Araya and the north coast of the Macanao peninsula (Margarita Island), the coastline is ~400 km long. Considering that, up to the edge of the shelf, its mean width is 90 km (Herrera and Febres, 1975), the area of the northeastern continental shelf is estimated to be 36 000 km2.
The marked difference in the biomass of small pelagic fish in the upwellings of eastern Venezuela and Colombia may be related to the size and depth of the continental shelf. In eastern Venezuela, the platform has a width of 90 km and an average depth of 66 m (Herrera and Febres, 1975). But in the Guajira of Colombia it is narrow and deep. Thus, to the north it is 18 km (depth 200 m) and opposite Punta Gallinas it is ~5.4 km (Paramo et al., 2012). In a wide and shallow platform, the physical properties of the upwelling control the recycling of nutrients (Arístegui et al., 2009) and favor a higher productivity of the pelagic ecosystem (Dale and Prego, 2002).
Islands. The presence of islands and archipelagos enrich the water through the well-known "island effect" studied for the first time in Barbados -an island close to the southeastern Caribbean, when describing the vertical oscillations of fertile waters (Sander, 1973); in eastern Venezuela, it is mentioned on La Tortuga Island (Margalef, 1969). Long-term studies show that this effect is also related to internal waves, which in shallow platforms cause resuspension of sediments (Liao et al., 2014) and a notable increase in phytoplankton biomass (~1 mg/m3) , associated with the presence of islands, while it has < 0.1 mg/m3 in nearby oligotrophic waters (Andrade et al., 2014). The northeastern Venezuelan platform is characterized by the presence of larger islands (Margarita, La Tortuga, Coche, Cubagua, among others), archipelagos (Los Frailes, Los Testigos, Los Hermanos), numerous smaller islands, islets, hills and cliffs. 167 of these accidents are estimated, with an area of ~1404.26 km2 (Gómez, 1996) and 465 km of coastline (Miró, 1974). This situation does not occur in the upwelling area of the Colombian Guajira. Furthermore, the continental shelf has little width and area. It has been suggested to explore the presence of internal waves in the Guajira peninsula and establish its relationship with the upwelling (Gutiérrez-Leones et al., 2015).
The islands and archipelagos favor the formation of gyres, in which the physical energy of the ocean is converted into trophic energy to support biological processes; in its center, the gyres favor the upwelling or subsidence of water, which allows the concentration or dispersal of plankton (Bakun, 2006). The movement of the gyres facilitates the well-known "ocean triad", that is, the enrichment, concentration and retention of plankton to increase biological productivity and the reproduction of organisms (Bakun, 1996). Likewise, they constitute a reproductive habitat for coastal pelagic fish, as occurs in California (Parrish et al., 1981) with the Brazilian (Matsuura et al., 1985) and the Venezuelan (Gómez, 2006) sardines. The presence of islands encourages the accumulation of water and forms bands of flow and other turns in their vicinity. On islands 2-3 km in diameter, currents have a velocity of ≥ 1 m/sec. These form strongly divergent cyclonic and anticyclonic gyres that favor the upwelling of waters in their interior, but convergences also occur in their outer limits that facilitate the formation of the triad (Bakun, 2006).
Finally, another important difference between the two upwellings is the presence of large semi-closed bodies of water in eastern Venezuela (gulfs of Cariaco and Santa Fe) and of numerous coastal lagoons in the states of Nueva Esparta and Sucre. Lagoons are known to enrich the waters of the adjacent sea, but their role in upwelling areas, already fertile, was unknown. Through intensive studies (every three days), it was verified that the waters that leave the La Restinga lagoon (Margarita Island) are more fertile due to higher values of primary production, chlorophyll and zooplankton, which enrich the nearby waters during the second half of the year when in the adjacent sea the relaxation of the upwelling occurs (Gómez, 1991). This is an important factor for regional aquatic fertility to occur throughout the year and explains the reason why, towards the end of the year, schools of sardines approach the mouths of the lagoons to feed: these areas become more rich in phytoplankton than during the first months (Gómez et al., 2008). The above also explains that, in September-October, schools of sardines abound in the first 10 km of the coast (Rueda-Roa et al., 2017).
Unlike the upwelling in the Colombian Guajira, in the northeast of Venezuela there is a wide and shallow continental shelf, with the presence of numerous islands and several archipelagos. In addition, on the continental coast there are gulfs, bays and coastal lagoons that enrich the adjacent sea when the upwelling weakens or ceases.
CONCLUSIONS
1. In the Guajira of Colombia, the upwelling seems to be influenced by the Darien Countercurrent, which contains low concentrations of inorganic nutrients. There are no great rivers that contribute dissolved and colored organic matter. The continental shelf is not very wide and it does not have archipelagos and/or islands that favor the increase of aquatic productivity. The high intensity of the wind may export nutrients and plankton to ocean waters, limiting fish production.
2. The eastern part of Venezuela has greater fertility and fishing production because the Subtropical Subsurface Water mass is what supplies the upwelling during the first months of the year. During the second semester, as the most intense hydrographic phenomenon relaxes, the area is enriched with the contribution of dissolved and colored organic matter from the Orinoco River and planktonic biomass from coastal lagoons, gulfs and semi-closed bays. The wide and shallow depth of the continental shelf is also important, with the presence of archipelagos and major and minor islands, which cause local enrichment.
3. In the Colombian Guajira, it is suggested to carry out in situ studies of hydrography, inorganic nutrients, the abundance of phyto and zooplankton and internal waves that allow the proper understanding of the upwelling in time.

