


 text in
  English (pdf)
 Article in xml format
 Article references
 Send this article by e-mail
 Cited by SciELO
  Cited by Google
  Similars in
SciELO
Similars in
SciELO  Similars in Google
 Permalink
INTRODUCTION
The Caribbean Sea, especially its southwestern sector, is characterized by a complex system of currents (Ricaurte-Villota and Bastidas, 2017). There is a wide variation of physical processes that control these currents depending on whether they occur in deep waters, beyond the continental slope, or near to the coastline (Grifoll et al., 2016). This leads to significant differences in the characteristics of the currents depending on their location, with large spatiotemporal variability. In recent decades, a number of studies have contributed to improving our understanding of the main oceanographic processes in the Caribbean, from the dynamics of the upwelling system in the Guajira (Correa-Ramírez et al., 2020) to the circulation patterns and distribution of water masses in the southwestern Caribbean (Lozano-Duque et al., 2010; Escobar, 2011; Toro, et al., 2019). Nevertheless, despite these studies concerning the southwestern Colombian Caribbean, knowledge of its hydrodynamics is still insufficient. This is particularly evident in places such as the Gulf of Urabá, where there is a lack of systematic measurements of oceanographic parameters. This has been evidenced in the design of coastal projects based on secondary information or on the basis of a single survey. The increase in short- and medium-term investments in the region underscores the importance and relevance of in situ oceanographic measurements. An example is the municipality of Turbo, located on the southeastern side of the Gulf of Urabá, where in recent years there has been an increase in project proposals for the development of tourism, port, and commercial services along the coastline.
Most of these proposals and projects take into account measurements of climatic parameters, but they rarely include oceanographic data. Consequently, the effects that the system of currents may have on the sediment dynamics and geomorphology of the site have not been considered. A particular case was evidenced by changes in Turbo’s municipal beach in 2015, as the movement of sediment closed off the mouth of the bay of El Uno, which neighbors the beach to the north (Alcántara et al., 2019). A new artificial inlet was opened near the delta of the Turbo River (to the north of the bay), and this inlet has been widening in the last few years. According to Alcántara et al. (2019), the closing and opening of inlets to the bay has caused an imbalance in the sediment dynamics of the entire area. The closure of the southern inlet produced a significant increase in sand on the municipal beach, creating the area known as Playa Dulce (formerly known as Playa Barajas) and other areas to the south of it. In contrast, the opening of the northern inlet modified sediment circulation around the delta and caused the erosion of the coastal spit (Punta Yarumal) that connects to the northern end of Playa Dulce. This imbalance demonstrates the need to understand the ongoing local dynamics in order to adequately predict the behavior of the coastline in the event of any natural or anthropogenic activity along the shore.
Studies have been conducted in the Gulf of Urabá using numerical modeling to explain the behavior of currents. Montoya and Toro (2006), using the ELCOM hydrodynamic model, determined that surface currents are mainly shaped by the outflow of the Atrato River. Toro et al. (2019), using the ROMS model, found that the Gulf can be divided into three regions (north, center and south) depending on the time of the year, where the circulation is modulated by the wind field and/or the river outflow. In general, these numerical experiments have been carried out at spatial scales of the order of kilometers. Although they have made important contributions to the understanding of the hydrodynamics in the Gulf, the study of the coastal strip requires research on a smaller spatial scale.
Surface drifters are commonly used to obtain information on surface currents, especially coastal currents. At sites close to the coastline, drifters are used over time scales ranging from minutes to days, depending on the phenomenon to be studied (Shafiei and Abbas, 2011). Moreover, drifters are a low-cost alternative when considering that some of them use conventional GPS technology, which has been demonstrated to have an adequate degree of accuracy (MacMahan et al., 2009). If the influence of the tides is also to be studied, it will be necessary to record the currents during a full tidal cycle.
The aim of this study is to advance understanding of the patterns of surface currents of a local system within the Gulf of Urabá, such as those along the urban beaches of the municipality of Turbo. To achieve this, four rounds of measurements were carried out, two in periods of high rainfall and two in periods of low rainfall, sampling the surface currents through drifters deployed between Las Vacas spit and the inlet of El Uno bay. These measurements made it possible to determine the direction and speed of the currents over periods of approximately 10 h, which were then compared with the tide level and with measurements of wind direction and speed.
STUDY AREA
The Gulf of Urabá is the largest estuary in the Colombian Caribbean Sea, located in its southwestern corner, between coordinates 7° 55’ and 8° 40’ N and 76° 53’ and 77° 23’ W. The Gulf is open to the Caribbean Sea at its northern end, with an approximate north-south length of 80 km and a width varying between 15 and 50 km. Its coastline, between Cape Tiburón (Chocó) and Rey spit (Antioquia), is 512 km long (Prüssmann and Correa, 2012). It is important to highlight that the Atrato River has an average annual flow of about 3000 m3/s that can vary between 1000 and 5000 m3/s. The Gulf of Urabá is relatively shallow, with depth values that do not exceed 30 m in Colombia bay (south) and in the Atrato delta, while its greatest depths are found to the north where it joins the Caribbean Sea (approximately 60 m) (Brakenridge et al., 2021).
Figure 1. Study area in the southwestern part of the Colombian Caribbean. Detail of the Gulf of Urabá and the area between the delta of the Turbo River and Las Vacas spit.
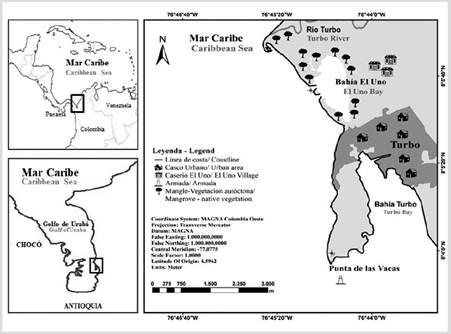
Figure 1 Study area in the southwestern part of the Colombian Caribbean. Detail of the Gulf of Urabá and the area between the delta of the Turbo River and Las Vacas spit.
The climate of the Gulf of Urabá is influenced by the Intertropical Convergence Zone (ITCZ), which moves southward between December and April, bringing with it a period of low rainfall, with monthly rainfall averages below 80 mm/month and strong trade winds from the northeast. Between May and November, the ITCZ shifts to the north and the rainy season arrives, with more than 150 mm/month of rainfall, with less intense winds from the south and southwest (Invemar, 2003). The Gulf’s dynamic is primarily shaped by outflows from the Atrato River, wind direction and intensity, wave energy, tides and density gradients (Lonin and Vásquez, 2005; Escobar, 2011; Escobar et al., 2019). Changes in current direction have been observed at different depths, suggesting the existence of an estuarine circulation pattern, with surface waters moving northward towards the Caribbean Sea and deeper waters moving southward into the Gulf.
The tide is mixed semidiurnal, with mean amplitude of 0.28 m and average values of 0.09 m during neap tides and 0.50 m during spring tides (IDEAM, 2019). These values suggest a significant amplification with respect to the outer shelf tide, whose range does not exceed ± 0.25 m (Kjerfve, 1981). The principal tidal components are two semi-diurnal harmonics (M2, 0.09 m; N2, 0.03 m) and two diurnal harmonics (K1, 0.10 m; O1, 0.06 m) (Nienhuis, 2019). Swell can be characterized according to the Gulf’s spatial position and climate season, with significant mean heights about 0.75 and 1.5 m during the low and high rain seasons, respectively (Escobar et al., 2015).
The municipality of Turbo is located on the southeastern shore of the Gulf of Urabá, facing the Atrato River delta (Figure 1). Between Yarumal spit (mouth of the Turbo River) and Las Vacas spit, the land can be divided into four areas according to their use: to the north and south there are two areas of vegetation cover (the coastal outcrops of Yarumal spit and Las Vacas spit); an area of sandy beach (Playa Dulce), which goes from the old inlet of El Uno bay to the spur located in the middle of the Las Vacas coastal spit; and a residential-commercial area that runs from the spur mentioned above to the port authority’s facilities. It should be noted that El Uno bay is a coastal lagoon enclosed by a barrier spit formed by the mouth of the Turbo River. Until 2015, the natural inlet of this bay was located on one side of Playa Dulce, but it was closed and an artificial inlet opened closer to the mouth of the Turbo River (Alcántara et al., 2019).
MATERIALS AND METHODS
Two low-cost surface drifters were used for our study, constructed with materials such as PVC containers and a spherical drogue with three planes of exposure, manufactured according to the design of Lucero and Mindiola (2007). Each drifter is made of two components: the upper part is a sealed container, which contains a GPS set to “track” mode, and the lower part is the drogue, designed to be dragged by the current (Lucero and Mindiola, 2007). The drifter was designed in such a way that the center of mass was located below the water surface, so that the currents were monitored at a depth of 0.5 to 1.5 m (Figure 2).
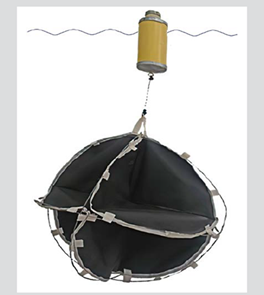
Figure 2 Surface drifter. The upper part (yellow container) holds the GPS, and the bottom part (black structure) is the drogue or vanes.
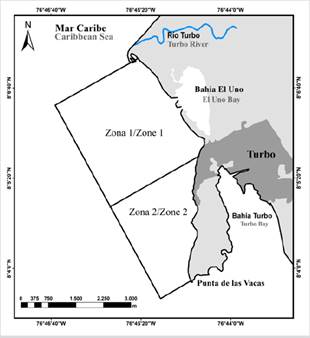
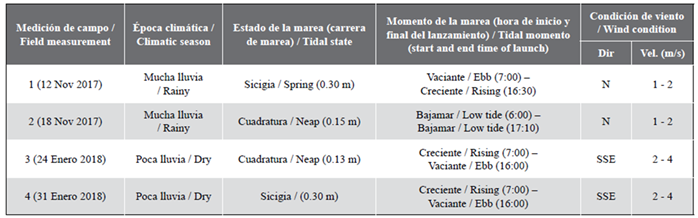
The study area was divided into two zones: zone 1, between the coastal outcrop at Yarumal spit and Playa Dulce, and zone 2, between Playa Dulce and Las Vacas spit (Figure 3). Four rounds of measurements were conducted: two in the rainy season (November 12 and 18, 2017) and two in the dry season (January 24 and 31, 2018). In each experiment, drifters were launched an average of four times, distributed in the aforementioned zones, at a distance of about 500 m from the coast and more than 2 m deep. The duration of each launch was approximately 10 h, so that the drifters could be followed visually in daylight and thus covered most of the tidal cycle. Every minute the GPS recorded the location (latitude and longitude) and corresponding time (date and time). Using these data recorded between two points, the surface velocity and direction were calculated, as well as the zonal and meridional components of the velocity (u, v).
Wind (strength and direction) and tidal data were analyzed in order to understand the behavior of the currents. The wind data are 1 to 6 h averages recorded at the Centro de Investigaciones Oceanográfica e Hidrográficas (CIOH) station, located in the northern end of the Gulf of Urabá (Sapzurro, Chocó). Taking into account results that show the spatial variability of the Gulf of Urabá’s wind field (Toro et al., 2019), in spite of the distance between the station and the study area, we may assume that both areas share similar wind conditions. Forecast values from the Sapzurro tide gauge (CIOH, 2017) were also used to assess the variability of the tide and specifically, its range (spring or neap) and diurnal phases (rising, ebb, high tide or low tide) (Table 1). All the surveys were conducted with low-wave conditions, with wave height increasing slightly during the low rainfall season surveys due to the steady trade winds from the north (Table 1).
RESULTS
The paths taken by the surface drifters in each of the four rounds are shown in Figures 4, 6, 8 and 10. The path of each drifter is identified with a number and a color corresponding to the different launches. Wind data (wind roses and vector time series), mean sea level rise and water velocity component values (u, v) and magnitude is presented in Figures 5, 7, 9 and 11. The observations for high and low rainfall periods will be analyzed separately below.
Two measurement rounds were conducted during the rainy season (November 12 and 18, 2017) (Figures 4 and 6). Wind conditions were similar over the whole period, with low winds to the northwest in the early morning and late afternoon and higher winds to the southeast during the rest of the day, reaching 4 m/s around midday (Figures 5A and 7A).
The first round of measurements (November 12) took place during spring tide, with a tidal range of approximately 0.30 m (Figure 5B). A total of four launches were carried out. In the morning, drifters L1 and L2 were launched (Figure 4). The two drifters moved in opposite directions (to the south and north, respectively). L1 was released just before high tide, with conditions of weak winds (1.75 m/s) towards the northwest (Figure 5B). The direction of the current was southeast, towards the interior of Turbo bay, with an average speed of 0.3 m/s (Figures 5D and 5E). The second release (L2) took place while the tide was going out during a period of strong winds (3 m/s) blowing to the southeast (Figure 5B). In this case, the direction of current was to the north, with velocities between 0.05 and 0.10 m/s (Figures 5D and 5E).
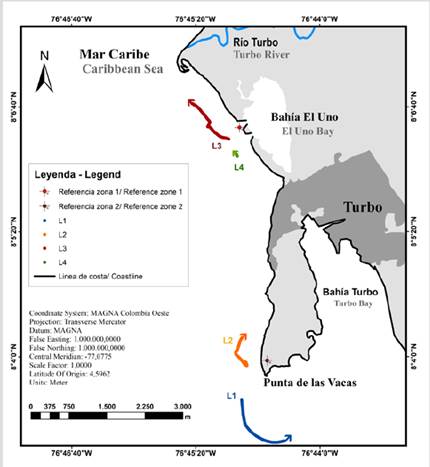
Figure 4 Round 1: November 12, 2017, rainy season. Paths for the four drifter launches: L1, L2, L3 and L4.
Drifters L3 and L4 were launched on November 12 in the afternoon (Figure 4). For these two launches the wind direction was to the southeast with an average speed of 4 m/s (Figure 5B). Launch L3 was near low tide (Figure 5C), and showed a northwesterly current with velocities of between 0.3 and 0.4 m/s (Figure 5D and E). In the case of L4, released during a rising tide (Figure 5C), the current was again northward but weaker than L3 with speeds between 0.05 and 0.10 m/s (Figure 5D and E).
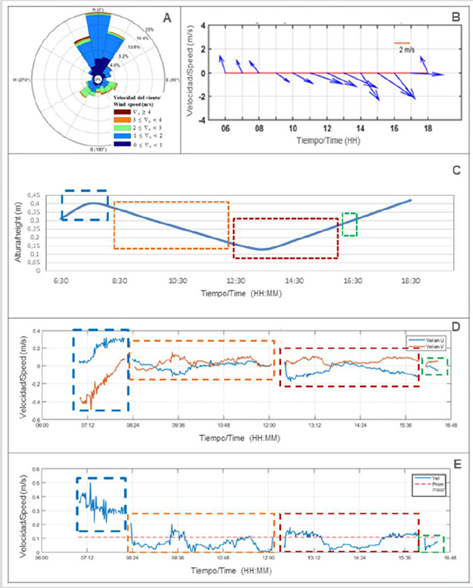
Figure 5 Round 1: November 12, 2017, rainy season. In situ measurements of the wind speed and direction: (A) wind rose and (B) wind vector series. (C) Tide level. (D) Zonal and meridional current components. (E) Current magnitude. The box colors in (C), (D) and (E) match those of the paths in Figure 4.
The second round was carried out on November 18, 2017, with a total of four launches (Figure 6). During this round there was a neap tide, with a tidal range of approximately 0.15 m (Figure 7C). L1 and L2 were launched in the morning with the drifters starting around only 100 m apart. At the time of the launch, the tide was high and the wind direction varied (to the northeast, shifting to the west until it reached a southeasterly direction) with an average speed of 1.75 m/s (Figure 7B). Both drifters followed a very similar path for approximately 5 h. Initially the direction of the current was westward with magnitudes < 0.05 m/s. Then the magnitude increased to 0.15 m/s in a northwesterly direction (Figures 7D and 7E). It is important to note that this increase in velocity coincided with an increase in the speed of northwesterly winds, i.e., the current flowed in the opposite direction to the wind (Figure 7).
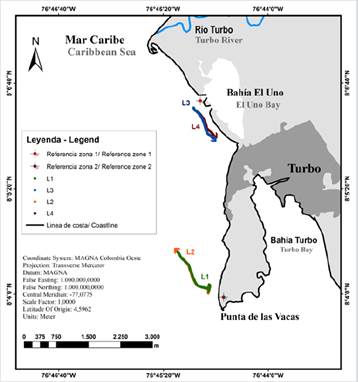
Figure 6 Round 2: November 18, 2017, rainy season. Paths for the four drifter launches: L1, L2, L3 and L4.
L3 and L4 were launched in the afternoon on November 18, again with the drifters starting close together. At this time, the tide was going out and the wind direction was to the southeast with an average speed of 2.5 m/s (Figure 7B). Again, the drifters kept to a similar path, close to the coastline. They showed that the currents were to the southeast, with a velocity that initially decreased from 0.07 to 0.03 m/s and increased towards the end of the period, reaching 0.15 m/s (Figures 7D and 7E). The current flowed in the same direction as the wind, however, the current increased in magnitude precisely when the wind weakened (Figure 7).
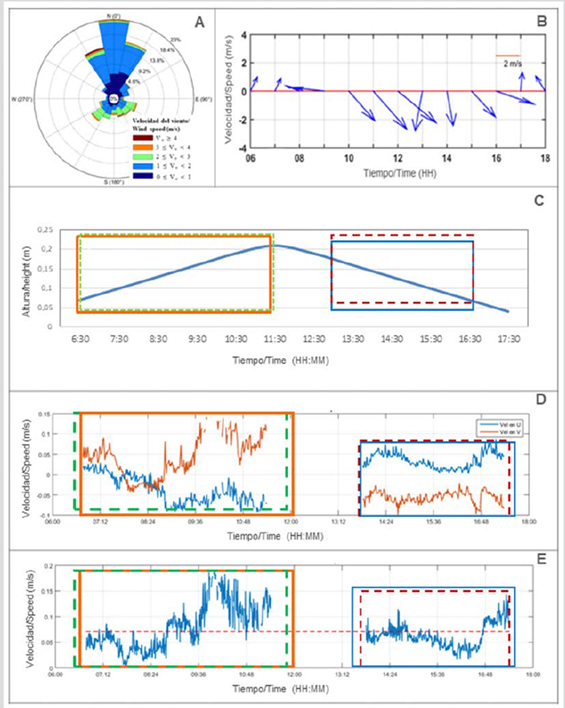
Figure 7 Round 2: November 18, 2017, rainy season. In situ measurements of the wind speed and direction: (A) wind rose and (B) wind vector series. (C) Tide level. (D) Zonal and meridional current components. (E) Current magnitude. The box colors in (C), (D) and (E) match those of the paths in Figure 6.
The other two rounds were carried out during the dry season (January 24 and 31, 2018, respectively) (Figures 8 and 10). The wind behavior was similar for both launches, with a predominant southerly component and speeds between 2 and 4 m/s (Figures 9A and 11A).
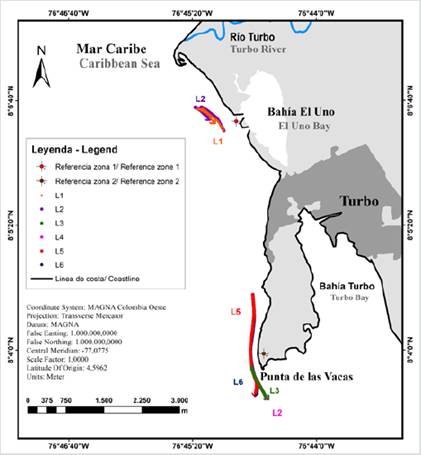
Figure 8 Round 3: January 24, 2018, dry season. Paths for the six drifter launches: L1, L2, L3, L4, L5 and L6.
The third round took place during a neap tide, with a tidal range of 0.13 m (Figure 9C). The L1 and L2 drifters were launched in the morning at positions close to each other (< 100 m apart). In this case the tide was going out and the wind had a predominant southerly direction and average speed of 4 m/s (Figures 9B and 9C). The drifters followed similar paths for 5 h. The currents were initially to the northwest (0.1 m/s) and then suddenly changed direction to the southeast (0.05 m/s) (Figures 9D and 9E).
Round 3 took place during the afternoon, when drifters L3 to L6 were launched. It was close to low tide and the wind kept to a predominant southeasterly direction, with an average speed of 3.75 m/s. After the L3 and L4 drifters were launched, they were pulled to the southeast and quickly left the study area. For this reason, L5 and L6 were launched further to the north during high tide, although it was at minimum amplitude (3 cm) (Figure 9C). For these launches the current flowed in a southerly direction with an average speed of 0.2 m/s (Figures 8 and 9D).
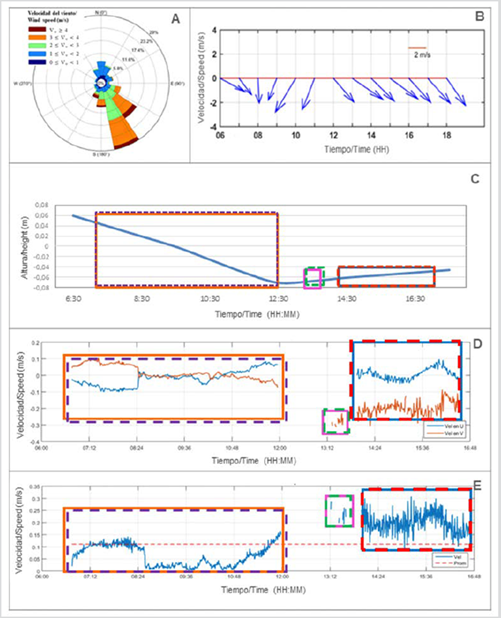
Figure 9 Round 3: January 24, 2018, dry season. In situ measurements of wind speed and direction: (A) wind rose and (B) wind vector series. (C) Tide level. (D) Zonal and meridional current components. (E) Current magnitude. The box colors in (C), (D) and (E) match those of the paths in Figure 8.
Finally, the fourth round (January 31, 2018) was carried out during a spring tide, with a tidal range of approximately 0.3 m (Figure 11C). The first drifter (L1) was launched in the morning on a rising tide (Figure 11C) and with northwesterly winds with an average speed of 4.25 m/s (Figure 11B). The drifter traveled in a southerly direction and quickly left the study area, so a second drifter (L2) was launched which was pulled in the same direction, approaching the coastline. Both drifters recorded currents of low magnitude; between 0.06 and 0.09 m/s (Figures 11D and 11E). In the afternoon, only one drifter (L3) was launched, with the tide going out (Figure 11C) and with wind direction towards the southeast with an average speed of 5.5 m/s. In this case the current flowed in a southeasterly direction, with speed that decreased from 0.12 to 0.04 m/s (Figure 11E).
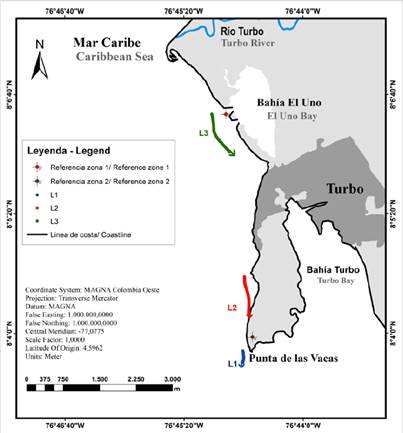
Figure 10 Round 4: January 31, 2018, dry season. Paths for the three drifter launches: L1, L2 and L3.
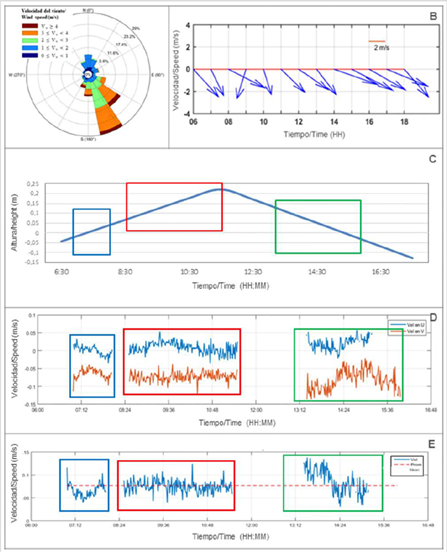
Figure 11 Round 4: January 31, 2018, dry season. In situ measurements of the wind speed and direction: (A) wind rose and (B) wind vector series. (C) Tide level. (D) Zonal and meridional current components. (E) Current magnitude. The box colors in (C), (D) and (E) match those of the paths in Figure 10.
DISCUSSION
The rounds of measurements were carried out to analyze the pattern of coastal currents in relation to the variation of the tide and the wind. The study area, located on the southeastern shore of the Gulf of Urabá, along about 6 km of coastline between Yarumal spit and Las Vacas spit, was divided into two sectors. In each of these, two surface drifters were launched in both seasons of the year, low rainfall (dry) and high rainfall (wet), and the paths they took were analyzed together with the surface winds and the tidal cycle in order to determine the dominant surface circulation processes and patterns.
The way that the tidal current behaves in the Gulf of Urabá, being a semi-enclosed body of water, is consistent with that of a standing wave. The incident and reflected tidal wave combine, so that the standing wave has zero amplitude at the head of the Gulf (antinode) and maximum amplitude at a certain distance from the head, where the minimum tidal amplitude (node) would be located. For a rectangular gulf of constant depth H this distance is given by T(gH) ½ /4 , where T is the tidal period (Proudman, 1953; Godin, 1993). In the case of the dominant semidiurnal component (M2), and considering water depths between 20 and 40 m, this corresponds to lengths between 158 and 224 km. These distances are greater than the length of the Gulf of Urabá, so it can be expected that the node does not lie within the Gulf and that the tide will oscillate approximately in phase within the entire Gulf (if rotation and friction effects are ignored, and it is assumed that the wave propagation velocity is not limited by the depth of water in the Gulf).
During rounds 1 and 3, the current pattern is consistent with the tidal cycle in which the measurements were made. In round 1, when the tide was rising, the current pulled the L1 drifter southward, i.e., it followed the direction of the water entering the Gulf and even Turbo bay itself. During round 3, at high tide, the L3, L4, L5 and L6 drifters were pulled southward by the current, in the same direction as the water entering the Gulf. However, these observed currents lag behind the current expected for a standing tidal wave, as the minimum velocities (near high and low tide) and maximum velocities (at full and neap tide) occur later than expected.
The time lag of the currents behind the predicted tide can be explained by the distance between the study area and the location of the tide gauge (Sapzurro), which is approximately 90 km. Ignoring all local factors (gulf geometry, bottom friction, river outflow), we can assume that the propagation velocity of the tidal phase propagation in shallow water is given by V(gH) ½ , where g is the acceleration of gravity and H is the water depth. Therefore, at depths between 15 and 25 m the tidal wave phase takes approximately 2 h to propagate between Sapzurro and Turbo. This lag was also recorded by Higuita and Quintana (2020), and may be exacerbated by the bathymetry and irregular shape of the Gulf of Urabá.
With respect to the effect of winds, the currents recorded during rounds 2 and 4 have no apparent relationship with the tidal wave, but are related to wind direction. In round 2, carried out in the rainy season with weak trade winds, the pattern of currents seems to be correlated with the diurnal variability of the winds, particularly with the currents off Las Vacas spit (to the west) and off El Uno bay (to the south). In round 4, during the dry season, there were strong northwesterly winds throughout the day and the currents flowed to the south. This motion is consistent with the tidal phase during the first two launches, but not during the third, off El Uno bay. These results point to the importance of winds in driving the currents (Toro et al., 2019).
Although the wind speed was higher during the dry season than during the rainy season, the magnitude of the currents was similar or even lower. This is probably because the tide and wind had opposite effects. It should also be noted that the effect of wind can be direct, due to wind drag, or indirect, associated with the meteorological tide. The direct response corresponds to wind drag on the shallowest layers of the water column, an effect that varies with depth. Since this study used shallow drifters (between 0.5 and 1.5 m depth), they are dragged in essentially the same direction as the wind (in the northern hemisphere, a rightward drift of about 10° has been observed experimentally and in the laboratory, see for example, Wu, 1983).
Meanwhile, near the coast, there are wind diurnal oscillations associated with sea-land breezes, directed offshore (towards the center of the Gulf, almost perpendicular to the coastline) during the night and onshore during the day, as shown by Arroyo (2019) in his hodograms for the Urabá region. This oscillation is very clear in the rainy season, while the trade winds are weak, and is less evident in the dry season, when the trade winds intensify (Figures 3, 5, 7 and 9). Therefore, in the Gulf of Urabá, sea-land breezes can be expected to be directed towards the head of the Gulf during the day and towards the mouth of the Gulf during the night (Arroyo, 2019). The result is a 24-h weather cycle in the inner part of the Gulf, with the sea level increasing in the afternoon and decreasing in the early morning. This cycle would be approximately in phase with the astronomical tide during round 3 and out of phase during the other rounds. These results are consistent with those recorded by Toro et al. (2019) for certain times of the year in the Gulf of Urabá, where wind directions and currents are in phase, specifically during October and December with southerly winds and stronger currents.
Regarding other factors, the observations presented here show that both tidal wave variation and wind intensity have an important effect on coastal currents in the region, but also point to the need to consider other factors in the modification of the current pattern and the tidal wave lag. Among these factors are the adjacent coastal lagoons, such as El Uno and Turbo bays. Both geoforms are associated with the coastal spits derived from the mouth of the Turbo River, producing semi-enclosed bodies of water that can intensify the effect of the tide, mainly in terms of the velocity at times of draining and filling.
The results suggest a lag in the way drifter L1 (round 1), which was launched near Las Vacas spit in minimal wind and swell conditions, was pulled towards the interior of Turbo bay (Figure 4). Other examples are the routes taken by drifters L3 and L4 (round 2) and L3 (round 4), launched just in front of El Uno bay at times when the tide was ebbing; the currents that moved these drifters were headed south when they were expected to move towards the mouth of the Gulf because of the phase of the tide (ebb). These results are consistent with the observations of Alcántara et al. (2019), who mention a relationship between the coastal outcrop at Yarumal spit in El Uno bay, the outflow of the Turbo River and the tidal currents at the bay’s inlets that prevent them from closing.
The pattern of currents during the dry season also points to the existence of a N-S drift current between Yarumal spit and Las Vacas spit. This current may be associated with the breaking waves caused by the increase in the northerly winds during those rounds conducted in the dry season (Table 1). This is consistent with the results of Escobar (2011), who suggests that the oblique wave breaking in shallow waters would cause the drift currents. Another possible modulator of currents in the Gulf of Urabá is the outflow of the Atrato River, at least in the vicinity of its delta. Toro et al. (2019) found the strongest currents around the river mouths in general throughout the year, but mainly during the rainy season.
CONCLUSIONS
Observations of the surface drifters, together with the wind and tidal time series, confirm that the rise and fall of the tide is associated with a southward and northward displacement of the water masses in the Gulf. Being a semi-enclosed body with a south-north orientation, the tidal currents are directed to and from the head of the Gulf during the rising and ebbing tide respectively, in a direction approximately perpendicular to the propagation of the tidal phase. In the study area, the tidal wave causes the currents to be sharply parallel to the coast.
The results suggest that during the dry season there is a notable influence of the northwesterly wind on the currents, possibly following an anticyclonic circulation (clockwise) in the inner part of the Gulf (from the mouth of the Atrato River to the south). As a consequence, during the dry season, the average wind direction (northwesterly) coincided with the prevailing current direction to the south. This would be the source of a N-S drift current from Yarumal spit to Las Vacas spit, which could be responsible for the deposition of sediments at Playa Dulce.
The paths taken by the drifters and the currents that guided them also point to the influence of El Uno bay. The filling and draining of this bay are undoubtedly delayed with respect to the tide in the waters of the Gulf itself, and thus would be able to modify the current system in the surrounding area. This could be the reason why some drifters start to head towards the bay’s inlet during the rising tide or why the water flows away from the inlet, for example towards the mouth of the Gulf, when the tide is outgoing.
Our results suggest that both the tide and wind modulate the coastal current system in the interior of the Gulf. However, in this study we have used the tidal elevation values recorded at Sapzurro, which is located in the northern end of the Gulf. Therefore, the results cannot be conclusive since the tidal wave lag between the northern part of the Gulf and the study area could not be accurately quantified. Calculations based on the speed of tidal propagation in shallow waters suggest a delay of about two hours. A suggestion for future studies of coastal currents is to also consider the swell and discharge of the Atrato river.
Although the measurements were taken relatively close to the coast, they were not sufficient to determine the risks to which bathers at Playa Dulce might be exposed, nor the influence of the coastal protection structure built there. Our results confirm the need for simultaneous measurements of variables such as sea level, currents, waves and wind in a systematic manner. Finally, this study demonstrates that it is possible to assess the dynamics of the current field in coastal regions with low-cost instruments.

