


 text in
  English (pdf)
 Article in xml format
 Article references
 Send this article by e-mail
 Cited by SciELO
  Cited by Google
  Similars in
SciELO
Similars in
SciELO  Similars in Google
 Permalink
INTRODUCTION
Plastics are produced in huge quantities, with about 400 million tons of plastic produced annually across the world (Devasahayam et al., 2019). The majority is disposed of improperly, due to a lack of efficient solid waste management systems and inadequate planning of urban and industrial settlements (Das et al., 2019; Vanapalli et al., 2019). The accumulation of plastics in different aquatic and terrestrial ecosystems is causing serious environmental problems and affecting the various forms of life that inhabit them (Caruso, 2019). Plastics degrade slowly through mechanical action, biodegradation and photo-oxidation (Ma et al., 2019). The likelihood that these products will biodegrade is very low, and so when they decompose, their mechanical, optical, or electrical characteristics start to change, leading to cracking, erosion, discoloration and fragmentation (Singh and Sharma, 2008). Smaller objects are created as plastics start to fragment. Pieces smaller than 5 mm in diameter are termed microplastics (MP) (Alimba and Faggio, 2019), and can be classified as primary or secondary MP. Primary MP are designed and manufactured at these sizes for a specific purpose, e.g., those usually found in facial and body cleansers (exfoliants), cosmetics and synthetic microfibers in clothing (Pan et al., 2019). Secondary MP are those that originate from the fragmentation of larger plastic objects (Cole et al., 2011).
Currently, it is estimated that around 245 million tons of MP enter the marine environment annually via tourism, sewage, fisheries and/or industrial spills (Alimba and Faggio, 2019). Considerable concentrations of MP with different characteristics have been found in marine ecosystems around the world (Lima et al., 2016; Invemar and MADS, 2017; Schmidt et al., 2018; Nie et al., 2019; Kor and Mehdinia, 2020). The abundance of MP in the sea has resulted in significant negative impacts on marine organisms and ecological processes, due to their pervasive presence on ocean surfaces (Pan et al., 2019). Due to their small size, MP can be ingested by many living organisms at different trophic levels and cause them harm, as most marine organisms do not metabolize MP, lacking an enzyme that specializes in the decomposition of synthetic polymers (microplastics) (Guzzetti et al., 2018).
In vertebrate organisms, the ingestion of plastic debris causes obstruction of the intestines, resulting in intestinal lesions, morbidity, and mortality. It has also been found that these elements lead to mechanical obstruction of movement, entrapment, drowning, restricted feeding and damage to the skin and skeletal system of these organisms (Alimba and Faggio, 2019). Furthermore, after being ingested and having started to accumulate inside the organism, MP can move between tissues or also be eliminated through excretion. The accumulation of this material can cause lesions to the inside or outside of the organism, intestinal blockages, changes in feeding, fertility problems and decreased survival of offspring (Guzzetti et al., 2018). MP also play an important role as vectors of biological and chemical contaminants within food webs (Carbery et al., 2019; Caruso, 2019). They have been found in small organisms such as zooplankton (Botterell et al., 2019), mussels (Giacomo et al., 2015), and sea cucumbers (Mohsen et al., 2019) among others; as well as in much larger organisms such as fish (Chan et al., 2019), birds (having fed on contaminated organisms) (Provencher et al., 2018), turtles (Caron et al., 2018), cetaceans (Zhu et al., 2019) and other marine mammals.
Half of the planet’s primary production takes place in the marine environment, and provides the energy needed to support important biodiversity (Sarma and Delabehera, 2019). Marine ecosystems also function as important carbon sinks and are the basis of the economic livelihood of many countries through tourism and fisheries production. However, these ecosystems are being deteriorated every day by anthropogenic activities including MP pollution, which prevent natural processes from occurring efficiently and affect wildlife, the ecological system and human health by means of food pathways (Alimba and Faggio, 2019). In light of this constant deterioration, research has been carried out to identify the main sites through which MP enter the marine environment, finding estuaries to be one of the major sources (Zhao et al., 2019). These are important environments as hosts of a diversity of species, their biological production, and their role as sources or sinks of different materials in coastal ecosystems (Invemar, 2017a). On the other hand, they provide a wide variety of ecosystem services, such as recreation, tourism, nutrient recycling, food and raw material production, carbon sequestration, and coastal protection from extreme weather events (García et al., 2018).
Buenaventura Bay is an estuary, through which the Dagua, Caimán, Limones, Anchicayá and Raposo rivers drain into the sea, home to communities of benthos, macroinvertebrates and fish that are vulnerable to diverse types of pollution (Gamboa et al., 2018; Martínez et al., 2019; Duque et al., 2020; Molina et al., 2020), including microplastics (Tafurt et al., 2021; Vásquez et al., 2021). In Buenaventura, the discharge of domestic wastewater has lowered the water quality of river networks. Other sources of contamination include mining waste, agricultural and livestock runoff, as well as waste from the fishing industry and the port of Buenaventura. This has affected the environmental quality of this estuarine ecosystem (Invemar, 2018; Troncoso et al., 2009). In addition to the pollution brought downriver, many zones of the estuary have also been used to dump pollutants such as domestic and industrial solids, MP, and oil byproducts (Invemar, 2005; Invemar, 2018). Estuaries are of interest for the study of MP since they transport this pollutant into the marine environment from inland waters (Zhang et al., 2019). For all these reasons, this study sought to carry out a spatiotemporal determination of the density, distribution and types of MP in the surface waters of Buenaventura Bay in the Colombian Pacific.
STUDY AREA
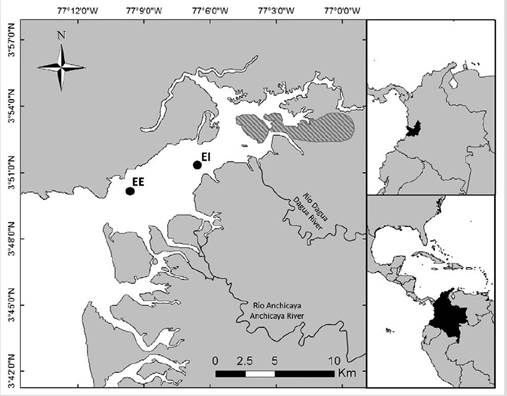
This research was conducted in Buenaventura Bay, situated between latitudes 3° 44’-56’ N and longitudes 77° 01’-20’ (Figure 1). It is approximately 3.4 km wide at the sea mouth and the inner bay is 5.5 km across. It is 30 km long, which gives it a narrow and elongated shape (Otero, 2005), and its average depth is 5 m. The hydroclimatic seasons in Buenaventura Bay can be classified as bimodal, with higher rainfall from September to October, and lower rainfall between February and March (Otero et al., 2007; Guzmán et al., 2014). It is also positioned close to Colombia’s Cordillera Occidental mountain range, which cools the warm and humid air currents, causing intense precipitation (Cantera and Blanco, 2001). The average annual sea surface temperature is 28.2 °C, with average monthly minimum temperatures of 27.8 °C in November and maximums of 28.5 °C in March (Otero, 2005). The bay is made up of two large, well-defined sectors: the external bay and the inner bay (Invemar and CVC, 2015). The external bay has direct communication with the open sea, and is therefore strongly influenced by it. The inner bay is considered a well-mixed estuary and is greatly affected by freshwater from the rivers and estuaries that flow into it (Invemar and CVC, 2015).
METHODOLOGY
Fieldwork phase
For this study, six surface water samples were collected during the months of April, July and November 2015, and March, June and October 2019, corresponding to the region’s predominant climatic periods: dry season (March-April), transition season (June-July) and rainy season (October-November). In each season, three replicates were taken in two zones of the estuary, one from the inner estuary (IE) and another from the external estuary (EE). Station IE (77° 6’ 33.1’’ W and 3° 50’ 51.5’’ N) is an area affected by the mouth of the river Dagua and is closer to the urban center and possible sources of contamination. Station EE (77° 9’ 35.9’’ W and 3° 50’ 58.7’’ N) is farther away from the main urban area and is more affected by the sea (Figure 1). The spatial distribution of the sampling points follows a possible MP concentration gradient across the bay. Also, sampling during the dry, transition and rainy seasons allows the effect that changes in precipitation and runoff have on MP concentrations to be evaluated.
Surface water samples were collected at both points (IE and EE) for each season (dry, transition and rainy), using a 250-micron horizontal trawl with a 29.5 cm mouth diameter. The trawls were towed over a distance of 600.4 ± 50.7 m (mean ± SD), for 10 minutes, at a constant speed. Each of the collected samples were replicated three times making a total of 36 samples. These samples were transferred to clean containers and subsequently refrigerated at a temperature of 4 °C.
Laboratory phase
Methodologies for PM analysis proposed by Masura et al. (2015) and Invemar (2017a) were adapted for the treatment of the samples. First, each sample collected underwent a separation process, in which they were transferred with the help of distilled water to a tower of stacked stainless-steel sieves with apertures of 5 mm and 0.25 mm in diameter. The elements collected on the 5 mm sieve and those that passed through the 0.25 mm sieve were discarded, since they did not fall within the size of material to be studied. The sieved solids were transferred to beakers and placed in a Merment drying oven model 30-750 at 90 °C for 24 hours or until the samples were dry. Subsequently, the material was oxidized in order to eliminate any organic matter present in the samples and reduce any interference they might present in the identification of the MP; for this, 20 to 30 mL of 10 % sodium hypochlorite were added to each sample and they were left to stand for 24 to 48 h. After a significant decrease in organic matter was observed, the hypochlorite was removed by washing the MP with distilled water in a 0.25 mm sieve. The washed solids were then transferred to a density separator, which contained a 5M saline solution, and the mixture was left to stand for one hour. Once the solids were separated by density, those that had settled were drained from the separator and inspected to ensure they contained no MP. Finally, all floating and suspended solids were collected in a Petri dish and subsequently heated in the oven at 80 °C until the samples were dry. Once dry, the samples were first inspected under a stereoscope to eliminate elements identified as not being MP due to their morphology. Finally, all MP were classified according to size and shape using a ZEISS AxioCam microscope.
Statistical analysis
A Nonmetric Multidimensional Scaling (nMDS) method was developed, based on similar matrices constructed from Euclidean distances and untransformed data (Clarke, 1993; Clarke et al., 2014), to identify the density dynamics of the different MP types found (fragments, fibers and pellets) in the years studied (2015 and 2019), in the different seasons (dry, rainy and transition) and sampling location (inner and external estuary). Possible differences in the data groups were also evaluated using a Permutational Multivariate Analysis of Variance (Permanova), where significance values (p(PERM)) were calculated from 9999 permutations, considering α < 0.05 as statistically significant differences. Additional post hoc tests, the Permanova pair-wise test, were performed to identify significantly different groups (Clarke, 1993; Clarke et al., 2014; Anderson, 2017), also using Euclidean Distances and untransformed data. Finally, a similarity percentage analysis (SIMPER) was performed using the two-way Euclidean distance formula to identify whether the studied variables (years, seasons and location) have similarities regarding MP type collected (Nie et al., 2019; Ribeiro et al., 2019).
RESULTS
The shapes of MP found in the different seasons of the years analyzed (2015 and 2019), and at different locations in the estuary, consisted of fragments, fibers, and pellets (Figure 2). The average of total MP found was 382 017.4 ± 59 973.3 particles/km² (average ± standard error), with the largest proportion of this being fragments, at 237 584.7 ± 49 757.5 particles/km² (62.2 %), followed by fibers at 143 021.3 ± 19 804.9 particles/km² (37.4 %) and finally pellets at 1411.4 ± 791.2 particles/km² (0.4 %). The average sizes of the MP ranged from 88.6 µm to 5878.163099 µm, specifically, 1075.6 ± 116 µm, 1741.9 ± 215.2 µm and 353.6 ± 115 µm for fragments, fibers and pellets, respectively.
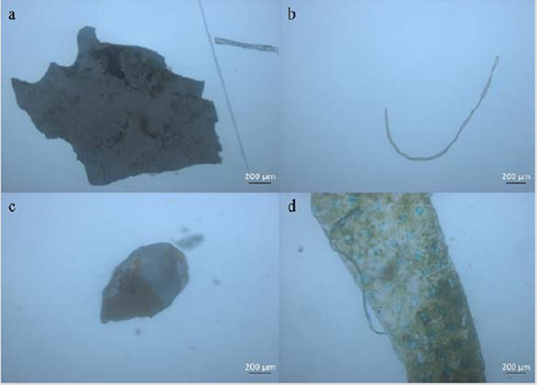
Figure 2 Types of microplastics found in surface water samples. (A) Fragment, (B) Fiber, (C) Pellets, (D) Union of fiber and fragment.
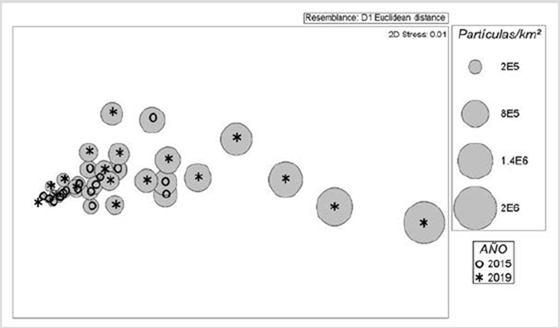
The abundance of the different types of MP studied was higher in 2019 (521 275 ± 103 671.2 particles/km²) compared to 2015 (242 759.8 ± 42 203.2 particles/km²), showing a progressive accumulation of these elements on the water’s surface (Figure 3). Also, differences in the densities and sizes of these elements were found for the different hydroclimatic seasons and locations of the estuary chosen for the study.
Microplastics in 2015
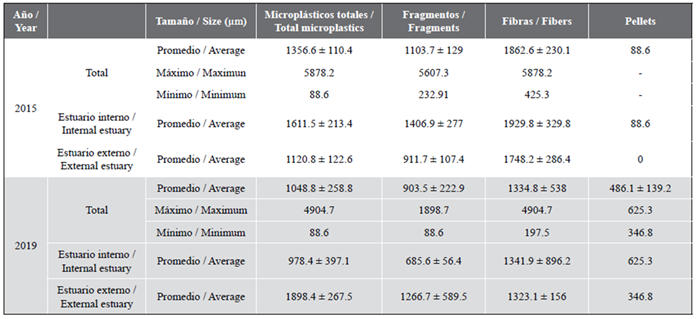
In 2015, MP fragments dominated the samples with 143 962.2 ± 27 935.8 particles/km² (59.3 %), followed by fibers with 97 856.7 ± 23 057 particles/km² (40.3 %); pellets were the least common MP type with 940.9 ± 940.9 particles/km² (0.4 %) (Table 1). MP sizes for this year ranged from 88.6 µm to 5878.2 µm, with an average size of 1103.3 ± 129 µm for fragments, 1862.6 ± 230.1 µm for fibers and 88.6 µm for pellets (Table 2).
Table 1 Average density of microplastics in 2015 and 2019 (particles/km²) (average ± standard error), depending on the seasons and sampling location. Inner Estuary (IE), External Estuary (EE). The results of the post hoc tests, the Permanova pair-wise test, are represented by letters (p (PERM) < 0.05).
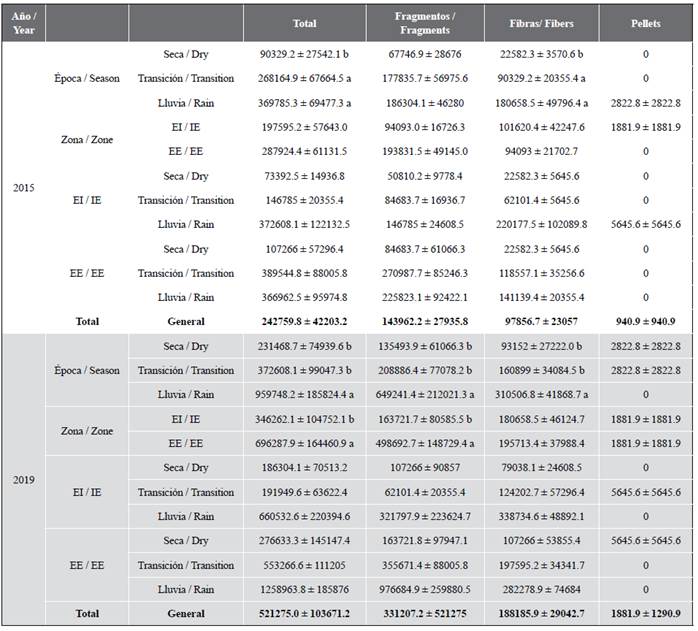
Table 2 Sizes of microplastics in 2015 and 2019 (µm) (average ± standard error), for each year’s total and for each sampling location.
MP density only showed significant differences depending on the season analyzed (p(PERM) = 0.012), with a higher total accumulation in the rainy season (369 785.3 ± 69 477.3 particles/km²) and the transition season (268 164.9 ± 67 664.5 particles/km²), and a lower accumulation in the dry season (90 329.2 ± 27 542.1 particles/km²) (Table 1). It is important to highlight that, in all the seasons studied for 2015, fragments were the predominant type of MP compared to the others (Table 1). The Simper analysis showed that the type of MP that contributed the most to the differences between variables were fragments collected in the dry season (98.5 %).
The amount of MP increased the further from the inner estuary and closer to the external estuary the samples were taken, with the lowest estimated amount in the IE (197 595.2 ± 57 643 particles/km²) and the highest in the EE (287 924.4 ± 61 131.5 particles/km²) (Table 1). Although fragments predominated overall in 2015, their presence varied depending on the area of the estuary, in the IE fibers predominated with 101 620.4 ± 42 247.6 particles/km² (51.4 %), while in the EE fragments were the most common MP type with 193 831.5 ± 49 145 particles/km² (67.3 %) (Table 1). Meanwhile, fibers had the largest MP sizes at 1929.8 ± 329.8 µm in the IE and 1748.2 ± 286.4 µm in the EE (Table 2). Simper analysis suggests that the MP type that made the greatest contribution to the differences in MP distribution was fragments found in the EE (92.04 %).
The highest concentrations of total MP in the IE occurred during the rainy season, followed by the transition and finally the dry season, with averages of 372 608.1 ± 122 132.5 particles/km², followed by 146 785.0 ± 20 355.4 particles/km² and 73 392.5 ± 14 936.8 particles/km², respectively (Table 1). At this location, there were more of all types of MP during the rainy season. The most common type of MP were fibers (220 177.5 ± 102 089.8 particles/km²) and fragments (146 785.0 ± 24 608.5 particles/km²), whereas pellets were found in lower quantities compared to the others and were only found in the rainy season (Table 1). In the EE, the largest amount of MP was found during the transition period (389 544.8 ± 88 005.8 particles/km²), followed by the rainy season (366 962.5 ± 95 974.8 particles/km²) and the least amount in the dry season (107 266 ± 572 96.4 particles/km²) (Table 1). The most common MP types during the transition period were fragments (270 987.7 ± 85 246.3 particles/km²) and during the rainy season more fibers were collected (141 139.4 ± 20 355.4 particles/km²). No pellets were found at any time of year (Table 1).
Microplastics in 2019
In 2019, the most common type of MP were fragments, with an average density of 331 207.2 ± 91 558.2 particles/km² (63.5 %), followed by fibers with 188 185.9 ± 29 042.7 particles/km² (36.1 %), and finally pellets with 1881.9 ± 1290.9 particles/km² (0.4 %) (Table 1). The sizes of the MP ranged from 88.6 µm to 4904.7 µm. (Table 2).
There were significant differences in the amount of MP found in each of the different seasons studied (rainy, transition and dry) (p(PERM) = 0.0011) and between the locations sampled (p(PERM) = 0.0133). For the seasons, the highest amounts of total MP were recorded in the rainy season (959 748.2 ± 185 824.4 particles/km²) and the lowest in the transition and dry seasons, with average densities of 372 608.1 ± 99 047.3 particles/km² and 231 468.7 ± 74 939.6 particles/km², respectively (Table 1). The most common MP type were fragments (649 241.4 ± 212 021.3 particles/km²) and fibers (310 506.8 ± 41 868.7 particles/km²), in the rainy season (Table 1). The Simper analysis showed that the type of MP that contributed the most to the differences in distribution were fragments collected in the rainy season (93.6 %).
In 2019, as in 2015, MP concentrations increased the further the sample was taken from urban areas and river mouths, evidenced by smaller quantities of MP found in the IE (346 262.1 ± 104 752.1 particles/km²) and larger quantities in the EE (696 287.9 ± 164 460.9 particles/km²) (Table 1). In the IE, fibers were the most common type of MP with 180 658.5 ± 46 124.7 particles/km² (52.2 %) and in the EE, fragments were most common with 498 692.7 ± 148 729.4 particles/km² (71.6 %) (Table 1). In both zones, fibers were found to have the largest MP sizes (Table 2). The Simper analysis suggests that the MP type with the greatest contribution to the differences in the distribution of MPs was fragments collected in the IE (90.3 %).
There were also significant differences in the concentration of MP between the zones and seasons sampled. The highest total concentrations of MP were found in the rainy season, followed by the transition season (660 532.6 ± 220 394.6 particles/km², 191 949.6 ± 63 622.4 particles/km², respectively) and the lowest number of particles in the dry season (186 304.1 ± 70 513.2 particles/km²) (Table 1). Also, there was a higher concentration of fibers than other MP (338 734.6 ± 48 892.1 particles/km²) in the rainy season, followed by fragments in this same season (321 797.9 ± 223 624.7 particles/km²). In the IE, pellets were only found during the transition season (5645.6 ± 5645.6 particles/km²) (Table 1). For the EE, similar to the IE, the season with the highest concentration of MP was the rainy season with 1 258 963.8 ± 185 876 particles/km², followed by the transition with 553 266.6 ± 111 205 particles/km² and the dry season with 276 633.3 ± 145 147.4 particles/km² (Table 1). The highest concentrations of MPs were found to be fragments and fibers during the rainy season (976 684.9 ± 259 880.5 particles/km², 282 278.9 ± 74 684 particles/km², respectively) (Table 1).
Increase in microplastic pollution from 2015 to 2019
The results for both years show an increase of 114.7 % in total MP density in 2019 compared to 2015, from 242 759.8 ± 42 203.2 particles/km² in 2015 to 521 275 ± 103 671.2 particles/km² in 2019, indicating an average annual rate of increase of 28.7 %. Similarly, it was observed that for the three types of MP analyzed there was an increase in each from 2015 to 2019 (Figure 4a). Additionally, differences in MP densities were found depending on the season and estuary zone. For both years studied, the highest MP concentrations were observed in the rainy (664 766.7 ± 129 828.1 particles/km²) and transition seasons (320 386.5 ± 59 313.7 particles/km²), while in the dry season they occurred in lower amounts (160 899 ± 43 606 particles/km²) (Figure 4b). In both years, concentrations of MP increased the further away from the urban area and the river inlets and the closer to the sea the samples were taken, with a lower density of MP in the IE (271 928.7 ± 60 734.9 particles/km²) and a higher density of MP in the EE (492 106.2 ± 98 467.1 particles/km²) (Figure 4c). In the IE, the most common type of MP were fibers during the rainy season (279 456.1 ± 57 143.2 particles/km²) and the transition (93 152 ± 29 253.7 particles/km²), while in the EE, fragments were most common during the rainy, transition and dry seasons (211 709.2 ± 208 340.2 particles/km², 158 076.2 ± 57 973.8 particles/km² and 64 924.1 ± 54 560.9 particles/km², respectively). In the IE, the highest amount of total MP was recorded during the rainy season (516 570.3 ± 129 780.8 particles/km²), followed by the transition (169 367.3 ± 31 534.5 particles/km²) and dry seasons (129 848.3 ± 40 945 particles/km²), The same occurred in the EE with averages of 812 963.1 ± 220 307.8 particles/km², 471 405.7 ± 73 229.5 particles/km², 191 949.6 ± 79 400.2 particles/km² for the rainy, transition and dry seasons, respectively. Overall, MP fragments dominated the study (62.2 %), followed by fibers (37.4 %). It should be noted that there was a significant increase in fragments found in the estuary from 2015 to 2019 (130.1 %) (Figure 4a).
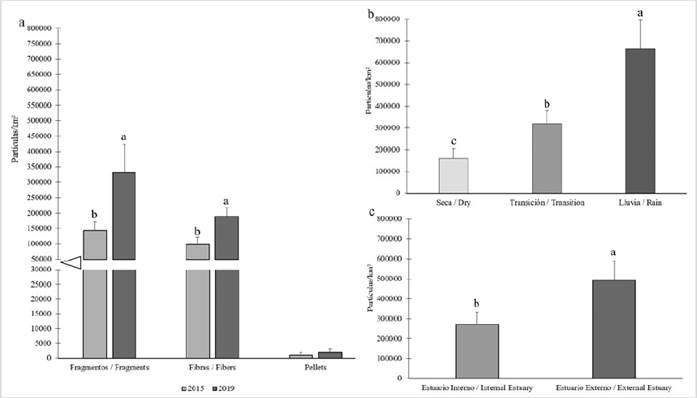
Figure 4 a) Average density of the types of microplastics for 2015 (light gray) and 2019 (dark gray). b) Average density of the total microplastics for the seasons analyzed. c) Average density of all microplastics for the locations analyzed. The results of the post hoc tests, the Permanova pair-wise test, are represented by letters (p (PERM) < 0.05).
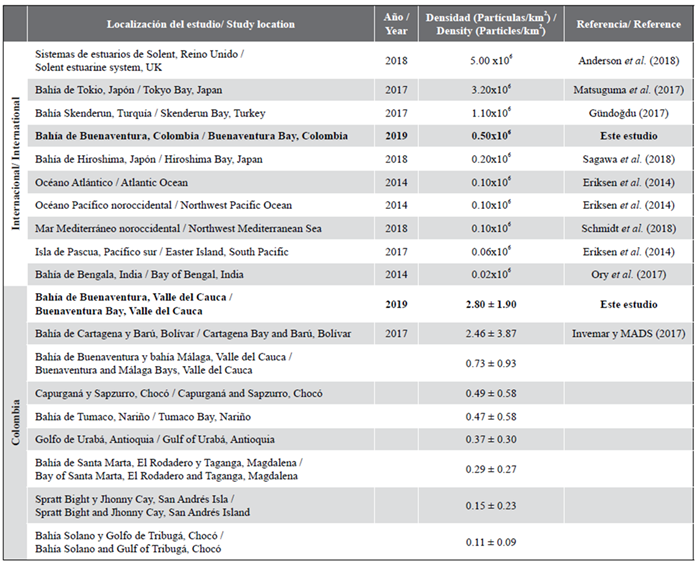
Comparing the concentrations of MP in surface waters of the Buenaventura Bay estuary (0.5 × 10⁶ particles/km²) with the concentrations recorded in surface waters of other coastal regions suggests that Buenaventura has an intermediate level of contamination, with a tendency to high (Table 3), especially if the rate of increase of the average annual concentration of microplastics is considered, which is 28.7 %. On the other hand, at the local level, when comparing the concentrations of MP in surface waters of the Buenaventura Bay estuary (2.8 particles/m³) with the concentrations found in different marine-coastal environments in Colombia, it was found that Buenaventura Bay has a higher amount of microplastics in the water than those recorded for other coastal areas of Colombia.
DISCUSSION
The amount of MP in the surface waters of Buenaventura Bay increased by 114.7 % from 2015 to 2019; this increase possibly results from the characteristics of the study site and its surroundings. Buenaventura is one of the most well-known port cities in South America, and its population has doubled in the last 30 years, and is now home to 423,927 people (Ávila Arias and Toro Cárdenas, 2003). These factors alone, together with the inefficient management of solid waste and its inhabitants’ limited or lack of culture of environmental protection (Suárez Manzano and Suárez Montaño, 2015), mean that the amount of waste deposited in the bodies of water that flow into the estuaries is increasing, explaining the large increase in the amount of MP found in the bay.
It is also important to consider that the port of Buenaventura’s proximity to the equator means that the world’s principal shipping routes run close by, and it is therefore a hub and transshipment port (Sociedad Portuaria Regional de Buenaventura S.A., 2017). Owing to this, its waters, and those of the bay, could be exposed to MP pollution generated by the ballast water of international transit vessels. Ballast water is used to improve the safety and stability of ships, but it is an also a major source of pollution. Vessels take on sea water from their port of origin and then discharge it at the destination port, unintentionally releasing different substances and organisms that do not belong to that ecosystem (García-Mendoza, 2015).
Fragments were the type of MP that occurred with the highest concentration during 2015 and 2019 (59.3 % and 63.5 % of total MP, respectively). This is in line with a study carried out in the Persian Gulf (Kor and Mehdinia, 2020), where fragments were found to predominate, representing 41 % of total MP. In the northwestern Pacific Ocean, too, fragments accounted for 80 % of the total MP analyzed (Pan et al., 2019). Likewise, in Colombia, in a study conducted in the mangrove swamp of the Ciénaga Grande de Santa Marta, fragments were one of the most common MP recovered (Invemar and MinAmbiente, 2018), and similarly, fragments predominated in research conducted in the departments of Nariño, Valle del Cauca, Bolívar and Chocó (Caribbean) (42 %, 69 %, 83 % and 58 %, respectively) (Invemar and MADS, 2017).
Due to the irregular shape of these MP, it can be inferred that they are secondary MP, i.e., they are derived from the fragmentation of larger pieces. A possible reason for the large amount of these MP on the surface is that they have a lower density than the estuary water. Fragments, as well as fibers (a MP type that this study found in high concentrations), have large surface areas and small mass, and so float and accumulate quickly on the surface (Pan et al., 2019). This may also explain the abundance of MP in the EE in the two years studied; this part of the estuary has a higher density due to its proximity to the open sea, resulting in a greater presence of MP on the surface of the water rather than on the bottom.
Precipitation had a clear influence on the amount of MP collected. During the rainy season, runoff and river flows increase (Támalo et al., 2016), ending their journey in the Pacific Ocean. In the municipality of Buenaventura, it has been shown that much of the solid waste management is inadequate, not only due to the absence of environmental education, but also because of the lack of proper waste disposal systems (Suárez Manzano and Suárez Montaño, 2015), resulting in a direct contribution to and continuous mixing of freshwater bodies that carry polluting materials to the estuaries. Furthermore, the region does not have an adequate wastewater treatment system, which increases the risk of contamination. As a result, MP are washed into the ocean by runoff, a process that is intensified by increased rainfall in the estuary zone and in the tributary river basins.
Finally, the considerable increase of MP in the Buenaventura Bay estuary prompts the adoption of corresponding measures to avoid a continuous increase in levels of MP over time and to counteract the possible harmful effects on marine life and human health. MP, specifically MP fragments, represent a serious ecological threat. First, this is due to their small size, which makes them more easily ingested by many organisms, meaning their bioavailability through the food webs increases, and second, because fragments concentrate and magnify persistent organic pollutants in water (Saeed et al., 2020), affecting various organisms. A greater effort to study and protect estuarine ecosystems is needed not only in Buenaventura Bay, but also around the world, since it is through these ecosystems that most MP enter the marine environment (Zhang et al., 2019). Furthermore, estuaries provide environmental services such as the regulation of imbalances and disturbances, nutrient recycling, habitats, and shelter for various organisms (many of commercial interest), not to mention the recreational, aesthetic and educational services they offer to human populations.
CONCLUSIONS
In the timeframe of the study, from 2015 to 2019, the concentration of MP grew 114.7 %, which represents a 28.7 % annual increase on average in the density of MP on the surface waters of Buenaventura Bay. There was also evidence of an increase in MP density towards the outer zone of the bay, probably due to the density gradient (due to salinity), which allows particles, especially fragments, to float longer and travel greater distances in the external estuary. Increased runoff, due to increased rainfall, contributed to the increase in MP concentration in the rainy season. The increase in microplastics confirms the need to further study the problem of plastic pollution in Buenaventura Bay. The presence of microplastics in estuarine ecosystems represents a risk to the ecosystem itself and to the ecosystem services derived from it.

